Zip Codes with the Lowest Poverty Level Among Children Under the Age of 5 in Georgia
RELATED REPORTS & OPTIONS
Lowest Poverty | Child 0-5
Georgia
Compare Zip Codes
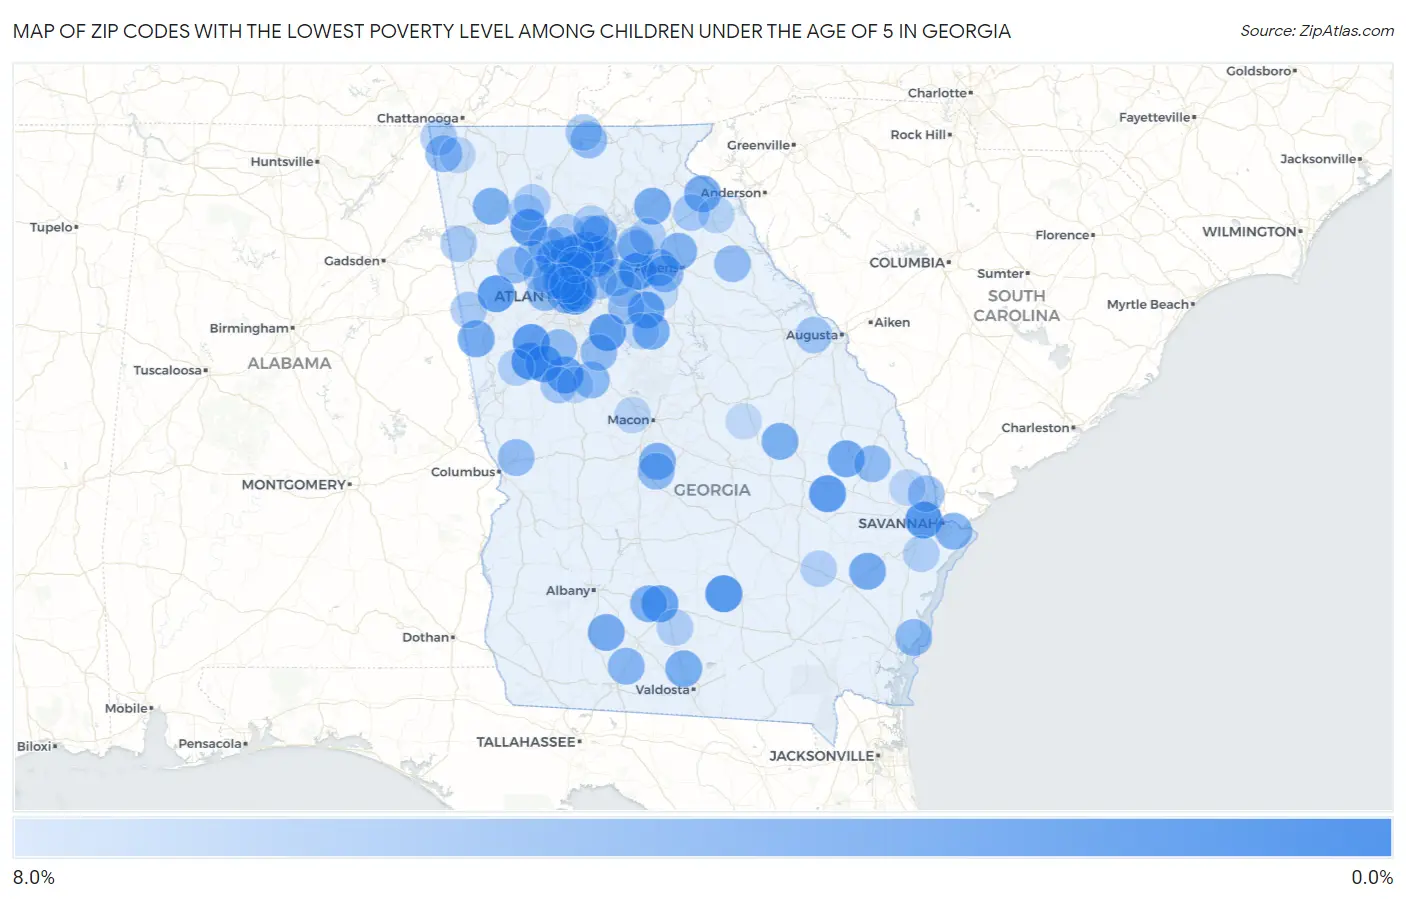
Map of Zip Codes with the Lowest Poverty Level Among Children Under the Age of 5 in Georgia
8.0%
0.0%
Zip Codes with the Lowest Poverty Level Among Children Under the Age of 5 in Georgia
| Zip Code | Child Poverty | vs State | vs National | |
| 1. | 30620 | 0.22% | 20.3%(-20.1)#1 | 18.1%(-17.8)#12 |
| 2. | 31512 | 0.36% | 20.3%(-20.0)#2 | 18.1%(-17.7)#26 |
| 3. | 31322 | 0.40% | 20.3%(-19.9)#3 | 18.1%(-17.7)#31 |
| 4. | 30259 | 0.50% | 20.3%(-19.8)#4 | 18.1%(-17.6)#61 |
| 5. | 30252 | 0.64% | 20.3%(-19.7)#5 | 18.1%(-17.4)#107 |
| 6. | 30265 | 0.78% | 20.3%(-19.6)#6 | 18.1%(-17.3)#165 |
| 7. | 30184 | 0.80% | 20.3%(-19.5)#7 | 18.1%(-17.3)#175 |
| 8. | 30420 | 0.81% | 20.3%(-19.5)#8 | 18.1%(-17.2)#184 |
| 9. | 30179 | 0.87% | 20.3%(-19.5)#9 | 18.1%(-17.2)#215 |
| 10. | 30097 | 0.91% | 20.3%(-19.4)#10 | 18.1%(-17.2)#232 |
| 11. | 30292 | 1.0% | 20.3%(-19.3)#11 | 18.1%(-17.0)#292 |
| 12. | 30317 | 1.0% | 20.3%(-19.3)#12 | 18.1%(-17.0)#297 |
| 13. | 30276 | 1.3% | 20.3%(-19.0)#13 | 18.1%(-16.7)#433 |
| 14. | 30025 | 1.5% | 20.3%(-18.8)#14 | 18.1%(-16.6)#521 |
| 15. | 30066 | 1.5% | 20.3%(-18.8)#15 | 18.1%(-16.5)#550 |
| 16. | 31793 | 1.6% | 20.3%(-18.8)#16 | 18.1%(-16.5)#566 |
| 17. | 30306 | 1.7% | 20.3%(-18.6)#17 | 18.1%(-16.3)#668 |
| 18. | 30005 | 1.8% | 20.3%(-18.6)#18 | 18.1%(-16.3)#687 |
| 19. | 30450 | 2.1% | 20.3%(-18.3)#19 | 18.1%(-16.0)#886 |
| 20. | 30319 | 2.2% | 20.3%(-18.2)#20 | 18.1%(-15.9)#956 |
| 21. | 31316 | 2.4% | 20.3%(-18.0)#21 | 18.1%(-15.7)#1,074 |
| 22. | 30170 | 2.4% | 20.3%(-18.0)#22 | 18.1%(-15.7)#1,079 |
| 23. | 30068 | 2.4% | 20.3%(-17.9)#23 | 18.1%(-15.7)#1,101 |
| 24. | 31784 | 2.4% | 20.3%(-17.9)#24 | 18.1%(-15.6)#1,129 |
| 25. | 30554 | 2.5% | 20.3%(-17.9)#25 | 18.1%(-15.6)#1,157 |
| 26. | 30557 | 2.5% | 20.3%(-17.8)#26 | 18.1%(-15.6)#1,170 |
| 27. | 30324 | 2.5% | 20.3%(-17.8)#27 | 18.1%(-15.5)#1,186 |
| 28. | 30666 | 2.6% | 20.3%(-17.8)#28 | 18.1%(-15.5)#1,212 |
| 29. | 30056 | 2.6% | 20.3%(-17.7)#29 | 18.1%(-15.5)#1,217 |
| 30. | 31632 | 2.6% | 20.3%(-17.7)#30 | 18.1%(-15.4)#1,251 |
| 31. | 30041 | 2.8% | 20.3%(-17.6)#31 | 18.1%(-15.3)#1,347 |
| 32. | 30733 | 2.8% | 20.3%(-17.6)#32 | 18.1%(-15.3)#1,349 |
| 33. | 30075 | 2.8% | 20.3%(-17.5)#33 | 18.1%(-15.2)#1,396 |
| 34. | 31795 | 2.9% | 20.3%(-17.5)#34 | 18.1%(-15.2)#1,407 |
| 35. | 31049 | 2.9% | 20.3%(-17.5)#35 | 18.1%(-15.2)#1,408 |
| 36. | 31005 | 2.9% | 20.3%(-17.5)#36 | 18.1%(-15.2)#1,424 |
| 37. | 30327 | 3.1% | 20.3%(-17.3)#37 | 18.1%(-15.0)#1,540 |
| 38. | 30024 | 3.1% | 20.3%(-17.3)#38 | 18.1%(-15.0)#1,554 |
| 39. | 30009 | 3.1% | 20.3%(-17.2)#39 | 18.1%(-14.9)#1,580 |
| 40. | 31410 | 3.2% | 20.3%(-17.1)#40 | 18.1%(-14.9)#1,641 |
| 41. | 30565 | 3.3% | 20.3%(-17.1)#41 | 18.1%(-14.8)#1,684 |
| 42. | 30313 | 3.4% | 20.3%(-16.9)#42 | 18.1%(-14.6)#1,787 |
| 43. | 31738 | 3.5% | 20.3%(-16.8)#43 | 18.1%(-14.5)#1,853 |
| 44. | 30017 | 3.6% | 20.3%(-16.7)#44 | 18.1%(-14.4)#1,893 |
| 45. | 30257 | 3.7% | 20.3%(-16.6)#45 | 18.1%(-14.3)#1,985 |
| 46. | 31522 | 3.8% | 20.3%(-16.6)#46 | 18.1%(-14.3)#1,995 |
| 47. | 30622 | 3.9% | 20.3%(-16.5)#47 | 18.1%(-14.2)#2,072 |
| 48. | 30338 | 3.9% | 20.3%(-16.4)#48 | 18.1%(-14.1)#2,117 |
| 49. | 31047 | 4.1% | 20.3%(-16.3)#49 | 18.1%(-14.0)#2,213 |
| 50. | 30033 | 4.1% | 20.3%(-16.3)#50 | 18.1%(-14.0)#2,220 |
| 51. | 30738 | 4.1% | 20.3%(-16.3)#51 | 18.1%(-14.0)#2,225 |
| 52. | 30248 | 4.2% | 20.3%(-16.1)#52 | 18.1%(-13.8)#2,358 |
| 53. | 30461 | 4.2% | 20.3%(-16.1)#53 | 18.1%(-13.8)#2,365 |
| 54. | 30132 | 4.2% | 20.3%(-16.1)#54 | 18.1%(-13.8)#2,367 |
| 55. | 30168 | 4.3% | 20.3%(-16.0)#55 | 18.1%(-13.8)#2,393 |
| 56. | 30560 | 4.3% | 20.3%(-16.0)#56 | 18.1%(-13.8)#2,394 |
| 57. | 30215 | 4.3% | 20.3%(-16.0)#57 | 18.1%(-13.8)#2,412 |
| 58. | 30189 | 4.3% | 20.3%(-16.0)#58 | 18.1%(-13.7)#2,420 |
| 59. | 31820 | 4.3% | 20.3%(-16.0)#59 | 18.1%(-13.7)#2,427 |
| 60. | 30627 | 4.4% | 20.3%(-15.9)#60 | 18.1%(-13.7)#2,482 |
| 61. | 30054 | 4.5% | 20.3%(-15.8)#61 | 18.1%(-13.6)#2,562 |
| 62. | 31326 | 4.7% | 20.3%(-15.6)#62 | 18.1%(-13.4)#2,709 |
| 63. | 30307 | 4.8% | 20.3%(-15.6)#63 | 18.1%(-13.3)#2,750 |
| 64. | 30548 | 5.1% | 20.3%(-15.2)#64 | 18.1%(-12.9)#2,998 |
| 65. | 30047 | 5.2% | 20.3%(-15.1)#65 | 18.1%(-12.8)#3,049 |
| 66. | 30813 | 5.3% | 20.3%(-15.1)#66 | 18.1%(-12.8)#3,062 |
| 67. | 30206 | 5.3% | 20.3%(-15.0)#67 | 18.1%(-12.8)#3,098 |
| 68. | 30521 | 5.5% | 20.3%(-14.9)#68 | 18.1%(-12.6)#3,221 |
| 69. | 30082 | 5.6% | 20.3%(-14.7)#69 | 18.1%(-12.5)#3,316 |
| 70. | 30517 | 5.6% | 20.3%(-14.7)#70 | 18.1%(-12.5)#3,319 |
| 71. | 30182 | 5.6% | 20.3%(-14.7)#71 | 18.1%(-12.4)#3,341 |
| 72. | 30101 | 5.7% | 20.3%(-14.7)#72 | 18.1%(-12.4)#3,361 |
| 73. | 30559 | 5.7% | 20.3%(-14.7)#73 | 18.1%(-12.4)#3,372 |
| 74. | 30339 | 5.7% | 20.3%(-14.6)#74 | 18.1%(-12.4)#3,382 |
| 75. | 30124 | 5.7% | 20.3%(-14.6)#75 | 18.1%(-12.3)#3,402 |
| 76. | 30115 | 5.8% | 20.3%(-14.6)#76 | 18.1%(-12.3)#3,431 |
| 77. | 30040 | 5.8% | 20.3%(-14.5)#77 | 18.1%(-12.2)#3,458 |
| 78. | 30752 | 5.9% | 20.3%(-14.5)#78 | 18.1%(-12.2)#3,487 |
| 79. | 30567 | 6.0% | 20.3%(-14.3)#79 | 18.1%(-12.0)#3,611 |
| 80. | 30030 | 6.1% | 20.3%(-14.3)#80 | 18.1%(-12.0)#3,634 |
| 81. | 30139 | 6.1% | 20.3%(-14.3)#81 | 18.1%(-12.0)#3,636 |
| 82. | 31637 | 6.1% | 20.3%(-14.2)#82 | 18.1%(-12.0)#3,660 |
| 83. | 30171 | 6.2% | 20.3%(-14.1)#83 | 18.1%(-11.8)#3,772 |
| 84. | 31324 | 6.3% | 20.3%(-14.0)#84 | 18.1%(-11.8)#3,817 |
| 85. | 30220 | 6.3% | 20.3%(-14.0)#85 | 18.1%(-11.8)#3,822 |
| 86. | 30028 | 6.4% | 20.3%(-14.0)#86 | 18.1%(-11.7)#3,848 |
| 87. | 30064 | 6.4% | 20.3%(-14.0)#87 | 18.1%(-11.7)#3,858 |
| 88. | 31563 | 6.4% | 20.3%(-14.0)#88 | 18.1%(-11.7)#3,865 |
| 89. | 30188 | 6.5% | 20.3%(-13.9)#89 | 18.1%(-11.6)#3,911 |
| 90. | 30520 | 6.5% | 20.3%(-13.9)#90 | 18.1%(-11.6)#3,921 |
| 91. | 30350 | 6.7% | 20.3%(-13.6)#91 | 18.1%(-11.4)#4,073 |
| 92. | 30305 | 6.7% | 20.3%(-13.6)#92 | 18.1%(-11.4)#4,084 |
| 93. | 31220 | 6.7% | 20.3%(-13.6)#93 | 18.1%(-11.3)#4,096 |
| 94. | 30295 | 6.9% | 20.3%(-13.5)#94 | 18.1%(-11.2)#4,199 |
| 95. | 30707 | 6.9% | 20.3%(-13.4)#95 | 18.1%(-11.2)#4,204 |
| 96. | 31312 | 6.9% | 20.3%(-13.4)#96 | 18.1%(-11.2)#4,223 |
| 97. | 30055 | 7.0% | 20.3%(-13.3)#97 | 18.1%(-11.0)#4,315 |
| 98. | 30641 | 7.0% | 20.3%(-13.3)#98 | 18.1%(-11.0)#4,317 |
| 99. | 30052 | 7.2% | 20.3%(-13.1)#99 | 18.1%(-10.8)#4,449 |
| 100. | 31089 | 7.4% | 20.3%(-13.0)#100 | 18.1%(-10.7)#4,527 |
Common Questions
What are the Top 10 Zip Codes with the Lowest Poverty Level Among Children Under the Age of 5 in Georgia?
Top 10 Zip Codes with the Lowest Poverty Level Among Children Under the Age of 5 in Georgia are:
What zip code has the Lowest Poverty Level Among Children Under the Age of 5 in Georgia?
30620 has the Lowest Poverty Level Among Children Under the Age of 5 in Georgia with 0.22%.
What is the Poverty Level Among Children Under the Age of 5 in the State of Georgia?
Poverty Level Among Children Under the Age of 5 in Georgia is 20.3%.
What is the Poverty Level Among Children Under the Age of 5 in the United States?
Poverty Level Among Children Under the Age of 5 in the United States is 18.1%.