Zip Codes with the Lowest Poverty Level Among Children Under the Age of 5 in Oregon
RELATED REPORTS & OPTIONS
Lowest Poverty | Child 0-5
Oregon
Compare Zip Codes
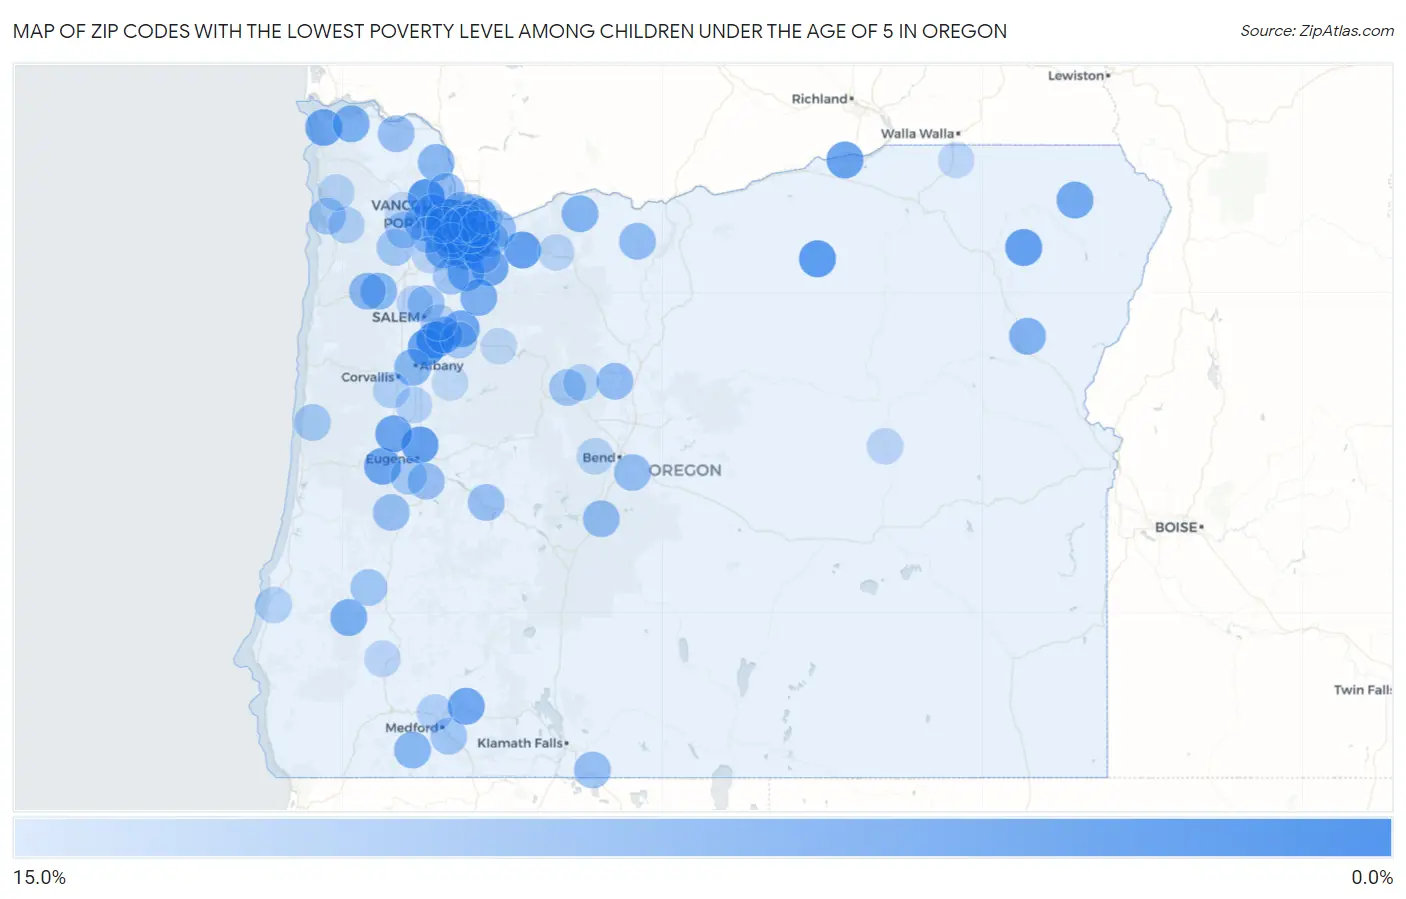
Map of Zip Codes with the Lowest Poverty Level Among Children Under the Age of 5 in Oregon
15.0%
0.0%
Zip Codes with the Lowest Poverty Level Among Children Under the Age of 5 in Oregon
| Zip Code | Child Poverty | vs State | vs National | |
| 1. | 97133 | 0.99% | 14.6%(-13.6)#1 | 18.1%(-17.1)#270 |
| 2. | 97392 | 1.0% | 14.6%(-13.6)#2 | 18.1%(-17.1)#279 |
| 3. | 97239 | 1.0% | 14.6%(-13.5)#3 | 18.1%(-17.0)#306 |
| 4. | 97836 | 1.6% | 14.6%(-13.0)#4 | 18.1%(-16.5)#586 |
| 5. | 97034 | 1.9% | 14.6%(-12.7)#5 | 18.1%(-16.2)#742 |
| 6. | 97229 | 2.2% | 14.6%(-12.4)#6 | 18.1%(-15.9)#946 |
| 7. | 97267 | 2.4% | 14.6%(-12.2)#7 | 18.1%(-15.7)#1,073 |
| 8. | 97824 | 2.4% | 14.6%(-12.2)#8 | 18.1%(-15.7)#1,081 |
| 9. | 97055 | 2.5% | 14.6%(-12.1)#9 | 18.1%(-15.6)#1,156 |
| 10. | 97408 | 2.5% | 14.6%(-12.1)#10 | 18.1%(-15.6)#1,160 |
| 11. | 97219 | 2.7% | 14.6%(-11.9)#11 | 18.1%(-15.3)#1,310 |
| 12. | 97352 | 2.9% | 14.6%(-11.7)#12 | 18.1%(-15.2)#1,417 |
| 13. | 97220 | 2.9% | 14.6%(-11.7)#13 | 18.1%(-15.2)#1,444 |
| 14. | 97202 | 2.9% | 14.6%(-11.6)#14 | 18.1%(-15.1)#1,461 |
| 15. | 97035 | 3.0% | 14.6%(-11.5)#15 | 18.1%(-15.0)#1,530 |
| 16. | 97882 | 3.1% | 14.6%(-11.5)#16 | 18.1%(-15.0)#1,551 |
| 17. | 97068 | 3.4% | 14.6%(-11.1)#17 | 18.1%(-14.6)#1,780 |
| 18. | 97146 | 3.6% | 14.6%(-11.0)#18 | 18.1%(-14.4)#1,894 |
| 19. | 97487 | 3.6% | 14.6%(-10.9)#19 | 18.1%(-14.4)#1,915 |
| 20. | 97448 | 3.7% | 14.6%(-10.9)#20 | 18.1%(-14.3)#1,966 |
| 21. | 97004 | 3.8% | 14.6%(-10.8)#21 | 18.1%(-14.3)#2,028 |
| 22. | 97385 | 3.8% | 14.6%(-10.7)#22 | 18.1%(-14.2)#2,059 |
| 23. | 97524 | 3.9% | 14.6%(-10.7)#23 | 18.1%(-14.2)#2,080 |
| 24. | 97828 | 4.1% | 14.6%(-10.5)#24 | 18.1%(-14.0)#2,210 |
| 25. | 97013 | 4.3% | 14.6%(-10.3)#25 | 18.1%(-13.8)#2,392 |
| 26. | 97007 | 4.4% | 14.6%(-10.1)#26 | 18.1%(-13.6)#2,501 |
| 27. | 97140 | 4.5% | 14.6%(-10.1)#27 | 18.1%(-13.6)#2,526 |
| 28. | 97086 | 4.5% | 14.6%(-10.1)#28 | 18.1%(-13.6)#2,531 |
| 29. | 97113 | 4.9% | 14.6%(-9.69)#29 | 18.1%(-13.2)#2,824 |
| 30. | 97325 | 5.1% | 14.6%(-9.48)#30 | 18.1%(-13.0)#2,958 |
| 31. | 97416 | 5.3% | 14.6%(-9.27)#31 | 18.1%(-12.8)#3,099 |
| 32. | 97103 | 5.4% | 14.6%(-9.12)#32 | 18.1%(-12.6)#3,200 |
| 33. | 97038 | 5.6% | 14.6%(-9.02)#33 | 18.1%(-12.5)#3,274 |
| 34. | 97814 | 6.0% | 14.6%(-8.59)#34 | 18.1%(-12.1)#3,581 |
| 35. | 97124 | 6.2% | 14.6%(-8.38)#35 | 18.1%(-11.9)#3,724 |
| 36. | 97031 | 6.3% | 14.6%(-8.25)#36 | 18.1%(-11.7)#3,833 |
| 37. | 97062 | 6.5% | 14.6%(-8.02)#37 | 18.1%(-11.5)#3,968 |
| 38. | 97530 | 6.8% | 14.6%(-7.80)#38 | 18.1%(-11.3)#4,130 |
| 39. | 97321 | 6.8% | 14.6%(-7.73)#39 | 18.1%(-11.2)#4,173 |
| 40. | 97378 | 6.9% | 14.6%(-7.71)#40 | 18.1%(-11.2)#4,189 |
| 41. | 97051 | 6.9% | 14.6%(-7.68)#41 | 18.1%(-11.2)#4,203 |
| 42. | 97006 | 7.0% | 14.6%(-7.62)#42 | 18.1%(-11.1)#4,259 |
| 43. | 97211 | 7.1% | 14.6%(-7.45)#43 | 18.1%(-10.9)#4,353 |
| 44. | 97027 | 7.3% | 14.6%(-7.24)#44 | 18.1%(-10.7)#4,502 |
| 45. | 97396 | 7.5% | 14.6%(-7.09)#45 | 18.1%(-10.6)#4,592 |
| 46. | 97223 | 7.7% | 14.6%(-6.88)#46 | 18.1%(-10.4)#4,719 |
| 47. | 97739 | 7.8% | 14.6%(-6.77)#47 | 18.1%(-10.3)#4,797 |
| 48. | 97021 | 7.8% | 14.6%(-6.75)#48 | 18.1%(-10.2)#4,809 |
| 49. | 97206 | 8.0% | 14.6%(-6.58)#49 | 18.1%(-10.1)#4,910 |
| 50. | 97231 | 8.0% | 14.6%(-6.57)#50 | 18.1%(-10.1)#4,914 |
| 51. | 97080 | 8.1% | 14.6%(-6.52)#51 | 18.1%(-10.0)#4,958 |
| 52. | 97089 | 8.1% | 14.6%(-6.52)#52 | 18.1%(-10.0)#4,959 |
| 53. | 97734 | 8.1% | 14.6%(-6.45)#53 | 18.1%(-9.94)#4,991 |
| 54. | 97702 | 8.2% | 14.6%(-6.33)#54 | 18.1%(-9.82)#5,065 |
| 55. | 97633 | 8.4% | 14.6%(-6.13)#55 | 18.1%(-9.62)#5,212 |
| 56. | 97435 | 8.5% | 14.6%(-6.06)#56 | 18.1%(-9.55)#5,264 |
| 57. | 97016 | 8.6% | 14.6%(-5.98)#57 | 18.1%(-9.47)#5,322 |
| 58. | 97426 | 8.7% | 14.6%(-5.90)#58 | 18.1%(-9.39)#5,379 |
| 59. | 97492 | 8.7% | 14.6%(-5.88)#59 | 18.1%(-9.37)#5,400 |
| 60. | 97303 | 9.2% | 14.6%(-5.40)#60 | 18.1%(-8.89)#5,732 |
| 61. | 97045 | 9.2% | 14.6%(-5.35)#61 | 18.1%(-8.84)#5,763 |
| 62. | 97212 | 9.4% | 14.6%(-5.18)#62 | 18.1%(-8.68)#5,876 |
| 63. | 97217 | 9.4% | 14.6%(-5.18)#63 | 18.1%(-8.67)#5,877 |
| 64. | 97032 | 9.5% | 14.6%(-5.05)#64 | 18.1%(-8.54)#5,958 |
| 65. | 97759 | 9.6% | 14.6%(-5.00)#65 | 18.1%(-8.49)#6,016 |
| 66. | 97535 | 9.6% | 14.6%(-4.99)#66 | 18.1%(-8.48)#6,021 |
| 67. | 97222 | 9.6% | 14.6%(-4.97)#67 | 18.1%(-8.46)#6,035 |
| 68. | 97471 | 9.8% | 14.6%(-4.79)#68 | 18.1%(-8.28)#6,128 |
| 69. | 97107 | 9.8% | 14.6%(-4.76)#69 | 18.1%(-8.25)#6,144 |
| 70. | 97148 | 9.9% | 14.6%(-4.67)#70 | 18.1%(-8.16)#6,184 |
| 71. | 97405 | 10.2% | 14.6%(-4.42)#71 | 18.1%(-7.91)#6,351 |
| 72. | 97498 | 10.3% | 14.6%(-4.32)#72 | 18.1%(-7.81)#6,411 |
| 73. | 97123 | 10.3% | 14.6%(-4.29)#73 | 18.1%(-7.78)#6,433 |
| 74. | 97205 | 10.3% | 14.6%(-4.23)#74 | 18.1%(-7.72)#6,463 |
| 75. | 97119 | 10.4% | 14.6%(-4.18)#75 | 18.1%(-7.67)#6,499 |
| 76. | 97221 | 10.5% | 14.6%(-4.11)#76 | 18.1%(-7.61)#6,528 |
| 77. | 97383 | 10.6% | 14.6%(-3.97)#77 | 18.1%(-7.46)#6,613 |
| 78. | 97214 | 10.9% | 14.6%(-3.66)#78 | 18.1%(-7.15)#6,784 |
| 79. | 97141 | 11.4% | 14.6%(-3.21)#79 | 18.1%(-6.70)#7,066 |
| 80. | 97333 | 11.5% | 14.6%(-3.06)#80 | 18.1%(-6.55)#7,152 |
| 81. | 97502 | 11.5% | 14.6%(-3.05)#81 | 18.1%(-6.54)#7,158 |
| 82. | 97411 | 11.7% | 14.6%(-2.86)#82 | 18.1%(-6.35)#7,277 |
| 83. | 97348 | 11.8% | 14.6%(-2.81)#83 | 18.1%(-6.30)#7,307 |
| 84. | 97730 | 11.9% | 14.6%(-2.71)#84 | 18.1%(-6.20)#7,384 |
| 85. | 97131 | 11.9% | 14.6%(-2.67)#85 | 18.1%(-6.16)#7,398 |
| 86. | 97703 | 11.9% | 14.6%(-2.66)#86 | 18.1%(-6.15)#7,405 |
| 87. | 97224 | 11.9% | 14.6%(-2.65)#87 | 18.1%(-6.14)#7,406 |
| 88. | 97230 | 12.0% | 14.6%(-2.55)#88 | 18.1%(-6.05)#7,475 |
| 89. | 97304 | 12.0% | 14.6%(-2.53)#89 | 18.1%(-6.02)#7,491 |
| 90. | 97266 | 12.0% | 14.6%(-2.53)#90 | 18.1%(-6.02)#7,492 |
| 91. | 97049 | 12.2% | 14.6%(-2.33)#91 | 18.1%(-5.82)#7,604 |
| 92. | 97132 | 12.4% | 14.6%(-2.15)#92 | 18.1%(-5.64)#7,715 |
| 93. | 97317 | 12.4% | 14.6%(-2.12)#93 | 18.1%(-5.61)#7,721 |
| 94. | 97442 | 12.5% | 14.6%(-2.07)#94 | 18.1%(-5.56)#7,757 |
| 95. | 97873 | 12.5% | 14.6%(-2.07)#95 | 18.1%(-5.56)#7,790 |
| 96. | 97003 | 12.6% | 14.6%(-1.98)#96 | 18.1%(-5.48)#7,815 |
| 97. | 97346 | 13.0% | 14.6%(-1.61)#97 | 18.1%(-5.10)#8,020 |
| 98. | 97862 | 13.1% | 14.6%(-1.52)#98 | 18.1%(-5.01)#8,080 |
| 99. | 97116 | 13.1% | 14.6%(-1.47)#99 | 18.1%(-4.96)#8,104 |
| 100. | 97355 | 13.2% | 14.6%(-1.34)#100 | 18.1%(-4.83)#8,173 |
Common Questions
What are the Top 10 Zip Codes with the Lowest Poverty Level Among Children Under the Age of 5 in Oregon?
Top 10 Zip Codes with the Lowest Poverty Level Among Children Under the Age of 5 in Oregon are:
What zip code has the Lowest Poverty Level Among Children Under the Age of 5 in Oregon?
97133 has the Lowest Poverty Level Among Children Under the Age of 5 in Oregon with 0.99%.
What is the Poverty Level Among Children Under the Age of 5 in the State of Oregon?
Poverty Level Among Children Under the Age of 5 in Oregon is 14.6%.
What is the Poverty Level Among Children Under the Age of 5 in the United States?
Poverty Level Among Children Under the Age of 5 in the United States is 18.1%.