Zip Codes with the Lowest Poverty Level Among Children Under the Age of 5 in Minnesota
RELATED REPORTS & OPTIONS
Lowest Poverty | Child 0-5
Minnesota
Compare Zip Codes
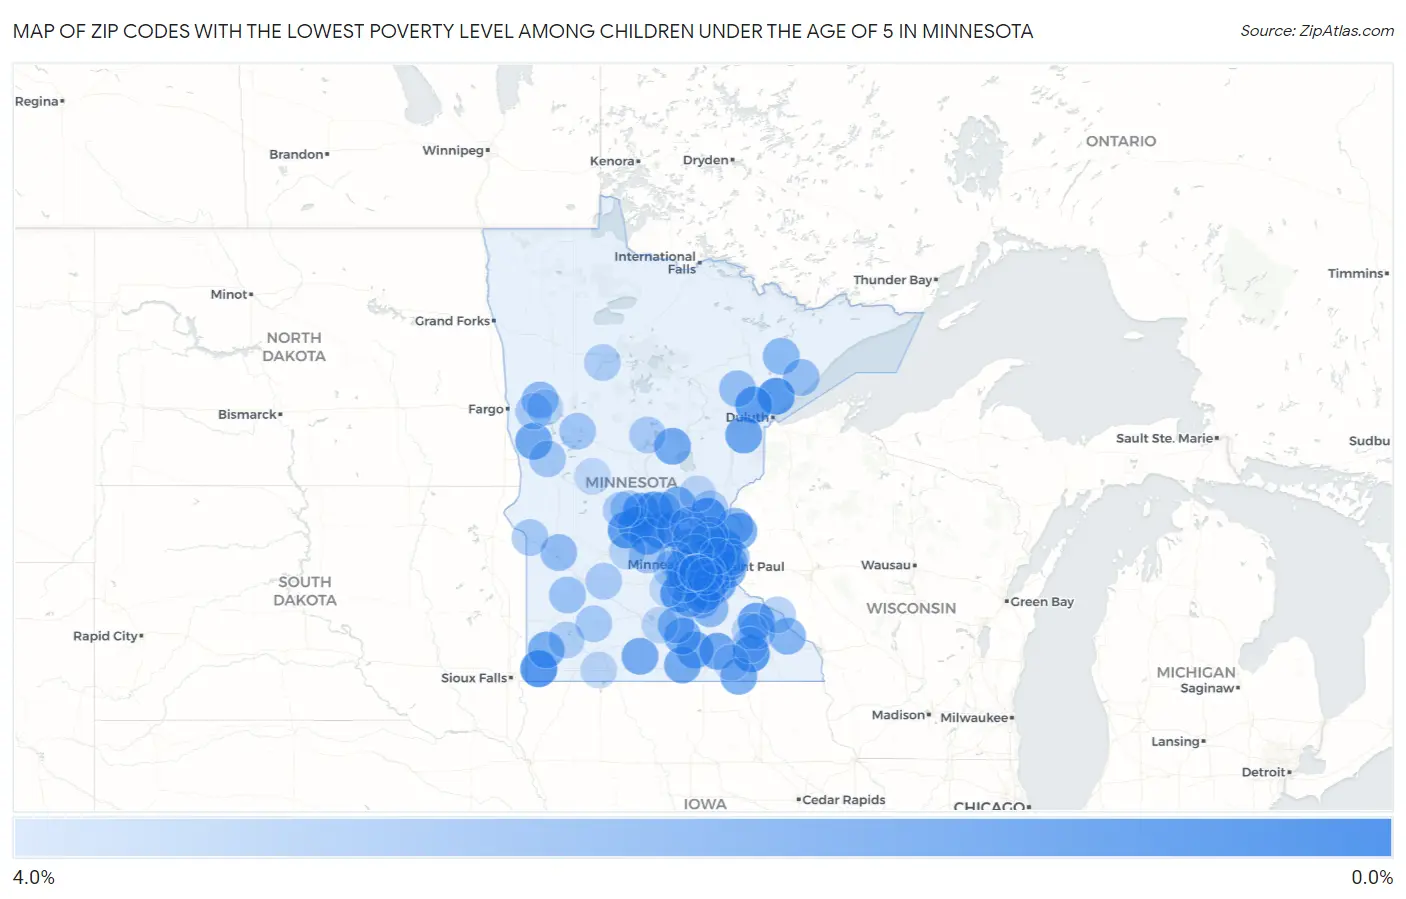
Map of Zip Codes with the Lowest Poverty Level Among Children Under the Age of 5 in Minnesota
4.0%
0.0%
Zip Codes with the Lowest Poverty Level Among Children Under the Age of 5 in Minnesota
| Zip Code | Child Poverty | vs State | vs National | |
| 1. | 56156 | 0.29% | 11.3%(-11.0)#1 | 18.1%(-17.8)#16 |
| 2. | 55008 | 0.35% | 11.3%(-11.0)#2 | 18.1%(-17.7)#22 |
| 3. | 55976 | 0.36% | 11.3%(-11.0)#3 | 18.1%(-17.7)#24 |
| 4. | 55803 | 0.36% | 11.3%(-11.0)#4 | 18.1%(-17.7)#25 |
| 5. | 55038 | 0.42% | 11.3%(-10.9)#5 | 18.1%(-17.6)#40 |
| 6. | 56011 | 0.60% | 11.3%(-10.7)#6 | 18.1%(-17.5)#91 |
| 7. | 56362 | 0.66% | 11.3%(-10.7)#7 | 18.1%(-17.4)#115 |
| 8. | 55779 | 0.67% | 11.3%(-10.7)#8 | 18.1%(-17.4)#121 |
| 9. | 55437 | 0.74% | 11.3%(-10.6)#9 | 18.1%(-17.3)#146 |
| 10. | 56310 | 0.76% | 11.3%(-10.6)#10 | 18.1%(-17.3)#157 |
| 11. | 55320 | 0.80% | 11.3%(-10.5)#11 | 18.1%(-17.3)#172 |
| 12. | 56377 | 0.88% | 11.3%(-10.5)#12 | 18.1%(-17.2)#221 |
| 13. | 55318 | 0.92% | 11.3%(-10.4)#13 | 18.1%(-17.1)#241 |
| 14. | 56368 | 0.94% | 11.3%(-10.4)#14 | 18.1%(-17.1)#252 |
| 15. | 56072 | 0.99% | 11.3%(-10.3)#15 | 18.1%(-17.1)#271 |
| 16. | 55353 | 1.0% | 11.3%(-10.3)#16 | 18.1%(-17.1)#276 |
| 17. | 55991 | 1.1% | 11.3%(-10.2)#17 | 18.1%(-17.0)#319 |
| 18. | 55014 | 1.1% | 11.3%(-10.2)#18 | 18.1%(-17.0)#323 |
| 19. | 55123 | 1.1% | 11.3%(-10.2)#19 | 18.1%(-17.0)#324 |
| 20. | 55707 | 1.1% | 11.3%(-10.2)#20 | 18.1%(-17.0)#325 |
| 21. | 55374 | 1.1% | 11.3%(-10.2)#21 | 18.1%(-16.9)#357 |
| 22. | 55917 | 1.2% | 11.3%(-10.2)#22 | 18.1%(-16.9)#361 |
| 23. | 55442 | 1.2% | 11.3%(-10.2)#23 | 18.1%(-16.9)#368 |
| 24. | 55068 | 1.2% | 11.3%(-10.1)#24 | 18.1%(-16.8)#388 |
| 25. | 56579 | 1.2% | 11.3%(-10.1)#25 | 18.1%(-16.8)#391 |
| 26. | 55438 | 1.3% | 11.3%(-10.1)#26 | 18.1%(-16.8)#412 |
| 27. | 56444 | 1.3% | 11.3%(-10.0)#27 | 18.1%(-16.8)#419 |
| 28. | 55308 | 1.4% | 11.3%(-9.98)#28 | 18.1%(-16.7)#446 |
| 29. | 56088 | 1.4% | 11.3%(-9.98)#29 | 18.1%(-16.7)#448 |
| 30. | 56357 | 1.4% | 11.3%(-9.94)#30 | 18.1%(-16.7)#468 |
| 31. | 56097 | 1.4% | 11.3%(-9.92)#31 | 18.1%(-16.7)#478 |
| 32. | 55345 | 1.5% | 11.3%(-9.88)#32 | 18.1%(-16.6)#502 |
| 33. | 55909 | 1.5% | 11.3%(-9.86)#33 | 18.1%(-16.6)#513 |
| 34. | 55074 | 1.5% | 11.3%(-9.79)#34 | 18.1%(-16.5)#553 |
| 35. | 56128 | 1.5% | 11.3%(-9.79)#35 | 18.1%(-16.5)#554 |
| 36. | 56048 | 1.6% | 11.3%(-9.76)#36 | 18.1%(-16.5)#578 |
| 37. | 55410 | 1.6% | 11.3%(-9.69)#37 | 18.1%(-16.4)#615 |
| 38. | 55364 | 1.7% | 11.3%(-9.65)#38 | 18.1%(-16.4)#632 |
| 39. | 55129 | 1.7% | 11.3%(-9.64)#39 | 18.1%(-16.4)#637 |
| 40. | 55120 | 1.9% | 11.3%(-9.44)#40 | 18.1%(-16.2)#762 |
| 41. | 55012 | 1.9% | 11.3%(-9.41)#41 | 18.1%(-16.1)#785 |
| 42. | 55969 | 2.0% | 11.3%(-9.35)#42 | 18.1%(-16.1)#818 |
| 43. | 55042 | 2.0% | 11.3%(-9.33)#43 | 18.1%(-16.1)#837 |
| 44. | 55372 | 2.0% | 11.3%(-9.29)#44 | 18.1%(-16.0)#855 |
| 45. | 55419 | 2.0% | 11.3%(-9.29)#45 | 18.1%(-16.0)#857 |
| 46. | 56063 | 2.1% | 11.3%(-9.26)#46 | 18.1%(-16.0)#876 |
| 47. | 55750 | 2.1% | 11.3%(-9.25)#47 | 18.1%(-16.0)#887 |
| 48. | 55044 | 2.1% | 11.3%(-9.24)#48 | 18.1%(-16.0)#897 |
| 49. | 55088 | 2.1% | 11.3%(-9.21)#49 | 18.1%(-15.9)#919 |
| 50. | 55019 | 2.2% | 11.3%(-9.18)#50 | 18.1%(-15.9)#936 |
| 51. | 56552 | 2.2% | 11.3%(-9.14)#51 | 18.1%(-15.9)#966 |
| 52. | 55011 | 2.3% | 11.3%(-9.05)#52 | 18.1%(-15.8)#1,022 |
| 53. | 56262 | 2.4% | 11.3%(-8.95)#53 | 18.1%(-15.7)#1,083 |
| 54. | 56071 | 2.4% | 11.3%(-8.91)#54 | 18.1%(-15.6)#1,115 |
| 55. | 55082 | 2.4% | 11.3%(-8.90)#55 | 18.1%(-15.6)#1,123 |
| 56. | 55386 | 2.4% | 11.3%(-8.90)#56 | 18.1%(-15.6)#1,125 |
| 57. | 55765 | 2.4% | 11.3%(-8.89)#57 | 18.1%(-15.6)#1,130 |
| 58. | 55616 | 2.5% | 11.3%(-8.88)#58 | 18.1%(-15.6)#1,141 |
| 59. | 56229 | 2.7% | 11.3%(-8.63)#59 | 18.1%(-15.4)#1,299 |
| 60. | 55423 | 2.7% | 11.3%(-8.60)#60 | 18.1%(-15.3)#1,317 |
| 61. | 55020 | 2.8% | 11.3%(-8.54)#61 | 18.1%(-15.3)#1,364 |
| 62. | 56379 | 2.8% | 11.3%(-8.52)#62 | 18.1%(-15.2)#1,374 |
| 63. | 55398 | 2.8% | 11.3%(-8.52)#63 | 18.1%(-15.2)#1,376 |
| 64. | 55328 | 2.8% | 11.3%(-8.50)#64 | 18.1%(-15.2)#1,383 |
| 65. | 55325 | 2.8% | 11.3%(-8.50)#65 | 18.1%(-15.2)#1,384 |
| 66. | 56573 | 2.8% | 11.3%(-8.49)#66 | 18.1%(-15.2)#1,394 |
| 67. | 56537 | 2.9% | 11.3%(-8.47)#67 | 18.1%(-15.2)#1,415 |
| 68. | 55304 | 2.9% | 11.3%(-8.45)#68 | 18.1%(-15.2)#1,432 |
| 69. | 55315 | 2.9% | 11.3%(-8.41)#69 | 18.1%(-15.1)#1,454 |
| 70. | 56549 | 3.0% | 11.3%(-8.37)#70 | 18.1%(-15.1)#1,480 |
| 71. | 56278 | 3.0% | 11.3%(-8.30)#71 | 18.1%(-15.0)#1,517 |
| 72. | 56152 | 3.0% | 11.3%(-8.30)#72 | 18.1%(-15.0)#1,520 |
| 73. | 55906 | 3.0% | 11.3%(-8.29)#73 | 18.1%(-15.0)#1,534 |
| 74. | 56331 | 3.1% | 11.3%(-8.28)#74 | 18.1%(-15.0)#1,542 |
| 75. | 55080 | 3.1% | 11.3%(-8.26)#75 | 18.1%(-15.0)#1,556 |
| 76. | 56230 | 3.1% | 11.3%(-8.26)#76 | 18.1%(-15.0)#1,559 |
| 77. | 56472 | 3.1% | 11.3%(-8.20)#77 | 18.1%(-14.9)#1,597 |
| 78. | 55981 | 3.2% | 11.3%(-8.18)#78 | 18.1%(-14.9)#1,611 |
| 79. | 56352 | 3.2% | 11.3%(-8.17)#79 | 18.1%(-14.9)#1,613 |
| 80. | 55311 | 3.2% | 11.3%(-8.11)#80 | 18.1%(-14.8)#1,646 |
| 81. | 56172 | 3.2% | 11.3%(-8.11)#81 | 18.1%(-14.8)#1,652 |
| 82. | 56678 | 3.3% | 11.3%(-8.07)#82 | 18.1%(-14.8)#1,677 |
| 83. | 55317 | 3.3% | 11.3%(-8.05)#83 | 18.1%(-14.8)#1,694 |
| 84. | 55360 | 3.3% | 11.3%(-8.03)#84 | 18.1%(-14.8)#1,703 |
| 85. | 56243 | 3.5% | 11.3%(-7.84)#85 | 18.1%(-14.6)#1,822 |
| 86. | 56003 | 3.5% | 11.3%(-7.80)#86 | 18.1%(-14.5)#1,838 |
| 87. | 55960 | 3.5% | 11.3%(-7.79)#87 | 18.1%(-14.5)#1,852 |
| 88. | 56554 | 3.6% | 11.3%(-7.74)#88 | 18.1%(-14.5)#1,873 |
| 89. | 55902 | 3.6% | 11.3%(-7.74)#89 | 18.1%(-14.5)#1,874 |
| 90. | 56150 | 3.6% | 11.3%(-7.72)#90 | 18.1%(-14.4)#1,887 |
| 91. | 56358 | 3.6% | 11.3%(-7.71)#91 | 18.1%(-14.4)#1,898 |
| 92. | 55124 | 3.7% | 11.3%(-7.64)#92 | 18.1%(-14.4)#1,946 |
| 93. | 55338 | 3.8% | 11.3%(-7.56)#93 | 18.1%(-14.3)#2,007 |
| 94. | 55330 | 3.8% | 11.3%(-7.54)#94 | 18.1%(-14.3)#2,017 |
| 95. | 56354 | 3.8% | 11.3%(-7.49)#95 | 18.1%(-14.2)#2,061 |
| 96. | 55918 | 3.8% | 11.3%(-7.49)#96 | 18.1%(-14.2)#2,062 |
| 97. | 55346 | 3.9% | 11.3%(-7.46)#97 | 18.1%(-14.2)#2,081 |
| 98. | 55127 | 3.9% | 11.3%(-7.44)#98 | 18.1%(-14.2)#2,086 |
| 99. | 55344 | 3.9% | 11.3%(-7.44)#99 | 18.1%(-14.2)#2,087 |
| 100. | 55431 | 3.9% | 11.3%(-7.43)#100 | 18.1%(-14.2)#2,094 |
Common Questions
What are the Top 10 Zip Codes with the Lowest Poverty Level Among Children Under the Age of 5 in Minnesota?
Top 10 Zip Codes with the Lowest Poverty Level Among Children Under the Age of 5 in Minnesota are:
What zip code has the Lowest Poverty Level Among Children Under the Age of 5 in Minnesota?
56156 has the Lowest Poverty Level Among Children Under the Age of 5 in Minnesota with 0.29%.
What is the Poverty Level Among Children Under the Age of 5 in the State of Minnesota?
Poverty Level Among Children Under the Age of 5 in Minnesota is 11.3%.
What is the Poverty Level Among Children Under the Age of 5 in the United States?
Poverty Level Among Children Under the Age of 5 in the United States is 18.1%.