Zip Codes with the Lowest Poverty Level Among Children Under the Age of 5 in Arkansas
RELATED REPORTS & OPTIONS
Lowest Poverty | Child 0-5
Arkansas
Compare Zip Codes
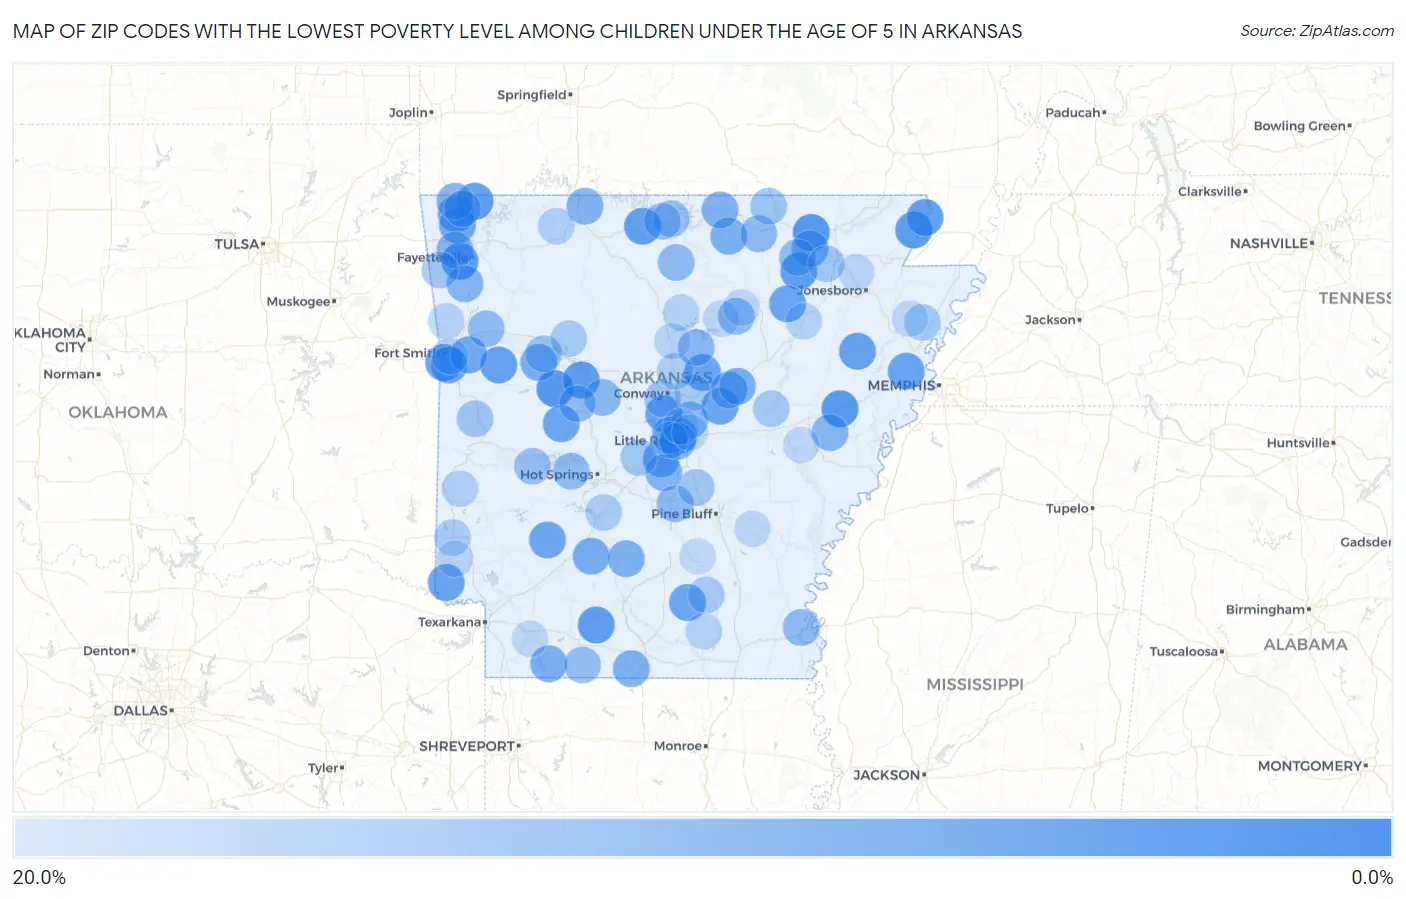
Map of Zip Codes with the Lowest Poverty Level Among Children Under the Age of 5 in Arkansas
20.0%
0.0%
Zip Codes with the Lowest Poverty Level Among Children Under the Age of 5 in Arkansas
| Zip Code | Child Poverty | vs State | vs National | |
| 1. | 72824 | 1.5% | 26.7%(-25.2)#1 | 18.1%(-16.5)#540 |
| 2. | 72434 | 1.6% | 26.7%(-25.0)#2 | 18.1%(-16.4)#617 |
| 3. | 72372 | 1.7% | 26.7%(-25.0)#3 | 18.1%(-16.3)#655 |
| 4. | 72461 | 2.0% | 26.7%(-24.7)#4 | 18.1%(-16.0)#842 |
| 5. | 72730 | 2.3% | 26.7%(-24.3)#5 | 18.1%(-15.7)#1,059 |
| 6. | 72751 | 2.4% | 26.7%(-24.3)#6 | 18.1%(-15.6)#1,111 |
| 7. | 72834 | 2.6% | 26.7%(-24.1)#7 | 18.1%(-15.5)#1,203 |
| 8. | 72469 | 2.6% | 26.7%(-24.1)#8 | 18.1%(-15.5)#1,230 |
| 9. | 71764 | 2.7% | 26.7%(-24.0)#9 | 18.1%(-15.4)#1,261 |
| 10. | 72687 | 2.8% | 26.7%(-23.9)#10 | 18.1%(-15.3)#1,361 |
| 11. | 72430 | 2.9% | 26.7%(-23.8)#11 | 18.1%(-15.2)#1,412 |
| 12. | 72908 | 3.2% | 26.7%(-23.5)#12 | 18.1%(-14.9)#1,636 |
| 13. | 72324 | 3.3% | 26.7%(-23.4)#13 | 18.1%(-14.7)#1,722 |
| 14. | 72928 | 3.4% | 26.7%(-23.2)#14 | 18.1%(-14.6)#1,800 |
| 15. | 72719 | 3.8% | 26.7%(-22.9)#15 | 18.1%(-14.3)#1,993 |
| 16. | 72111 | 3.9% | 26.7%(-22.7)#16 | 18.1%(-14.1)#2,128 |
| 17. | 72327 | 3.9% | 26.7%(-22.7)#17 | 18.1%(-14.1)#2,129 |
| 18. | 72106 | 4.0% | 26.7%(-22.7)#18 | 18.1%(-14.1)#2,187 |
| 19. | 71836 | 4.1% | 26.7%(-22.6)#19 | 18.1%(-14.0)#2,209 |
| 20. | 72562 | 4.2% | 26.7%(-22.5)#20 | 18.1%(-13.9)#2,301 |
| 21. | 72207 | 4.2% | 26.7%(-22.5)#21 | 18.1%(-13.8)#2,351 |
| 22. | 71631 | 4.3% | 26.7%(-22.4)#22 | 18.1%(-13.8)#2,396 |
| 23. | 72916 | 4.3% | 26.7%(-22.4)#23 | 18.1%(-13.7)#2,425 |
| 24. | 72007 | 4.4% | 26.7%(-22.3)#24 | 18.1%(-13.7)#2,473 |
| 25. | 72857 | 4.4% | 26.7%(-22.2)#25 | 18.1%(-13.6)#2,512 |
| 26. | 71940 | 4.5% | 26.7%(-22.2)#26 | 18.1%(-13.6)#2,539 |
| 27. | 72022 | 5.1% | 26.7%(-21.6)#27 | 18.1%(-13.0)#2,940 |
| 28. | 72941 | 5.2% | 26.7%(-21.5)#28 | 18.1%(-12.9)#3,021 |
| 29. | 72713 | 5.2% | 26.7%(-21.5)#29 | 18.1%(-12.8)#3,044 |
| 30. | 71743 | 5.5% | 26.7%(-21.2)#30 | 18.1%(-12.6)#3,250 |
| 31. | 72012 | 6.0% | 26.7%(-20.7)#31 | 18.1%(-12.1)#3,578 |
| 32. | 72865 | 6.1% | 26.7%(-20.6)#32 | 18.1%(-12.0)#3,641 |
| 33. | 72212 | 6.1% | 26.7%(-20.6)#33 | 18.1%(-12.0)#3,667 |
| 34. | 72565 | 6.2% | 26.7%(-20.5)#34 | 18.1%(-11.9)#3,717 |
| 35. | 71861 | 6.2% | 26.7%(-20.4)#35 | 18.1%(-11.8)#3,773 |
| 36. | 71749 | 6.5% | 26.7%(-20.2)#36 | 18.1%(-11.5)#3,946 |
| 37. | 71763 | 6.6% | 26.7%(-20.1)#37 | 18.1%(-11.5)#3,998 |
| 38. | 72415 | 6.7% | 26.7%(-19.9)#38 | 18.1%(-11.3)#4,100 |
| 39. | 72583 | 6.7% | 26.7%(-19.9)#39 | 18.1%(-11.3)#4,108 |
| 40. | 72102 | 6.8% | 26.7%(-19.9)#40 | 18.1%(-11.2)#4,156 |
| 41. | 72662 | 7.0% | 26.7%(-19.7)#41 | 18.1%(-11.1)#4,275 |
| 42. | 72715 | 7.1% | 26.7%(-19.6)#42 | 18.1%(-11.0)#4,329 |
| 43. | 72704 | 7.4% | 26.7%(-19.3)#43 | 18.1%(-10.7)#4,516 |
| 44. | 72011 | 7.4% | 26.7%(-19.3)#44 | 18.1%(-10.7)#4,533 |
| 45. | 72368 | 7.5% | 26.7%(-19.2)#45 | 18.1%(-10.5)#4,617 |
| 46. | 72774 | 7.6% | 26.7%(-19.1)#46 | 18.1%(-10.5)#4,641 |
| 47. | 72120 | 7.7% | 26.7%(-19.0)#47 | 18.1%(-10.4)#4,705 |
| 48. | 72025 | 8.1% | 26.7%(-18.6)#48 | 18.1%(-9.95)#4,982 |
| 49. | 72131 | 8.2% | 26.7%(-18.5)#49 | 18.1%(-9.88)#5,022 |
| 50. | 72205 | 8.2% | 26.7%(-18.5)#50 | 18.1%(-9.86)#5,033 |
| 51. | 72523 | 8.3% | 26.7%(-18.4)#51 | 18.1%(-9.73)#5,137 |
| 52. | 71653 | 8.4% | 26.7%(-18.3)#52 | 18.1%(-9.70)#5,159 |
| 53. | 72617 | 8.7% | 26.7%(-18.0)#53 | 18.1%(-9.41)#5,367 |
| 54. | 72513 | 8.7% | 26.7%(-18.0)#54 | 18.1%(-9.35)#5,413 |
| 55. | 72150 | 8.8% | 26.7%(-17.9)#55 | 18.1%(-9.27)#5,471 |
| 56. | 72947 | 8.9% | 26.7%(-17.7)#56 | 18.1%(-9.12)#5,574 |
| 57. | 72853 | 9.2% | 26.7%(-17.5)#57 | 18.1%(-8.90)#5,728 |
| 58. | 72712 | 9.3% | 26.7%(-17.4)#58 | 18.1%(-8.81)#5,787 |
| 59. | 72466 | 9.3% | 26.7%(-17.4)#59 | 18.1%(-8.80)#5,795 |
| 60. | 72653 | 9.4% | 26.7%(-17.3)#60 | 18.1%(-8.68)#5,875 |
| 61. | 71968 | 9.5% | 26.7%(-17.2)#61 | 18.1%(-8.54)#5,959 |
| 62. | 71740 | 9.7% | 26.7%(-17.0)#62 | 18.1%(-8.39)#6,065 |
| 63. | 72635 | 10.1% | 26.7%(-16.6)#63 | 18.1%(-7.98)#6,318 |
| 64. | 71957 | 10.2% | 26.7%(-16.5)#64 | 18.1%(-7.89)#6,358 |
| 65. | 72863 | 10.2% | 26.7%(-16.5)#65 | 18.1%(-7.86)#6,380 |
| 66. | 72554 | 10.7% | 26.7%(-16.0)#66 | 18.1%(-7.38)#6,667 |
| 67. | 72958 | 11.0% | 26.7%(-15.7)#67 | 18.1%(-7.06)#6,838 |
| 68. | 72132 | 11.1% | 26.7%(-15.6)#68 | 18.1%(-6.95)#6,893 |
| 69. | 72433 | 11.1% | 26.7%(-15.6)#69 | 18.1%(-6.95)#6,896 |
| 70. | 72744 | 11.3% | 26.7%(-15.4)#70 | 18.1%(-6.74)#7,053 |
| 71. | 72019 | 11.4% | 26.7%(-15.3)#71 | 18.1%(-6.66)#7,090 |
| 72. | 72034 | 11.4% | 26.7%(-15.3)#72 | 18.1%(-6.65)#7,096 |
| 73. | 72040 | 11.6% | 26.7%(-15.1)#73 | 18.1%(-6.46)#7,202 |
| 74. | 72330 | 11.8% | 26.7%(-14.9)#74 | 18.1%(-6.30)#7,320 |
| 75. | 72846 | 11.9% | 26.7%(-14.8)#75 | 18.1%(-6.21)#7,372 |
| 76. | 71832 | 12.1% | 26.7%(-14.5)#76 | 18.1%(-5.92)#7,544 |
| 77. | 71671 | 12.3% | 26.7%(-14.4)#77 | 18.1%(-5.76)#7,632 |
| 78. | 72173 | 12.4% | 26.7%(-14.3)#78 | 18.1%(-5.68)#7,691 |
| 79. | 71942 | 12.5% | 26.7%(-14.2)#79 | 18.1%(-5.56)#7,789 |
| 80. | 72058 | 12.9% | 26.7%(-13.8)#80 | 18.1%(-5.13)#7,997 |
| 81. | 71972 | 13.0% | 26.7%(-13.7)#81 | 18.1%(-5.10)#8,022 |
| 82. | 72638 | 13.2% | 26.7%(-13.5)#82 | 18.1%(-4.88)#8,143 |
| 83. | 71647 | 13.6% | 26.7%(-13.1)#83 | 18.1%(-4.43)#8,425 |
| 84. | 72112 | 13.8% | 26.7%(-12.8)#84 | 18.1%(-4.21)#8,549 |
| 85. | 72153 | 13.9% | 26.7%(-12.8)#85 | 18.1%(-4.16)#8,593 |
| 86. | 72932 | 14.0% | 26.7%(-12.7)#86 | 18.1%(-4.03)#8,657 |
| 87. | 72013 | 14.1% | 26.7%(-12.6)#87 | 18.1%(-3.95)#8,696 |
| 88. | 71842 | 14.4% | 26.7%(-12.3)#88 | 18.1%(-3.63)#8,909 |
| 89. | 72416 | 14.6% | 26.7%(-12.1)#89 | 18.1%(-3.49)#8,977 |
| 90. | 72354 | 14.6% | 26.7%(-12.1)#90 | 18.1%(-3.45)#9,000 |
| 91. | 72211 | 14.7% | 26.7%(-12.0)#91 | 18.1%(-3.41)#9,019 |
| 92. | 72530 | 14.8% | 26.7%(-11.9)#92 | 18.1%(-3.31)#9,069 |
| 93. | 72550 | 14.8% | 26.7%(-11.9)#93 | 18.1%(-3.25)#9,104 |
| 94. | 71644 | 14.9% | 26.7%(-11.8)#94 | 18.1%(-3.17)#9,146 |
| 95. | 72903 | 14.9% | 26.7%(-11.8)#95 | 18.1%(-3.16)#9,149 |
| 96. | 72029 | 15.0% | 26.7%(-11.7)#96 | 18.1%(-3.06)#9,205 |
| 97. | 72118 | 15.0% | 26.7%(-11.7)#97 | 18.1%(-3.05)#9,222 |
| 98. | 71845 | 15.1% | 26.7%(-11.6)#98 | 18.1%(-2.99)#9,253 |
| 99. | 72116 | 15.3% | 26.7%(-11.4)#99 | 18.1%(-2.81)#9,351 |
| 100. | 71665 | 15.3% | 26.7%(-11.4)#100 | 18.1%(-2.77)#9,376 |
Common Questions
What are the Top 10 Zip Codes with the Lowest Poverty Level Among Children Under the Age of 5 in Arkansas?
Top 10 Zip Codes with the Lowest Poverty Level Among Children Under the Age of 5 in Arkansas are:
What zip code has the Lowest Poverty Level Among Children Under the Age of 5 in Arkansas?
72824 has the Lowest Poverty Level Among Children Under the Age of 5 in Arkansas with 1.5%.
What is the Poverty Level Among Children Under the Age of 5 in the State of Arkansas?
Poverty Level Among Children Under the Age of 5 in Arkansas is 26.7%.
What is the Poverty Level Among Children Under the Age of 5 in the United States?
Poverty Level Among Children Under the Age of 5 in the United States is 18.1%.