Zip Codes with the Lowest Poverty Level Among Children Under the Age of 5 in Hawaii

RELATED REPORTS & OPTIONS

Lowest Poverty | Child 0-5
Population
Families and Households
Female Fertility
Female Fertility (Unmarried)
Race (Community Size)
Race (Percentage)
Ancestry (Community Size)
AfghanAfricanAlaska NativeAlaskan AthabascanAlbanianAleutAlsatianAmericanApacheArabArapahoArgentineanArmenianAssyrian / Chaldean / SyriacAustralianAustrianBahamianBangladeshiBarbadianBasqueBelgianBelizeanBermudanBhutaneseBlackfeetBolivianBrazilianBritishBritish West IndianBulgarianBurmeseCajunCambodianCanadianCape VerdeanCarpatho RusynCelticCentral AmericanCentral American IndianCherokeeCheyenneChickasawChileanChineseChippewaChoctawColombianColvilleComancheCosta RicanCreeCreekCroatianCrowCubanCypriotCzechCzechoslovakianDanishDelawareDominicanDutchDutch West IndianEastern EuropeanEcuadorianEgyptianEnglishEstonianEthiopianEuropeanFijianFilipinoFinnishFrenchFrench American IndianFrench CanadianGermanGerman RussianGhanaianGreekGuamanian / ChamorroGuatemalanGuyaneseHaitianHmongHonduranHopiHoumaHungarianIcelanderIndian (Asian)IndonesianInupiatIranianIraqiIrishIroquoisIsraeliItalianJamaicanJapaneseJordanianKenyanKiowaKoreanLaotianLatvianLebaneseLiberianLithuanianLumbeeLuxembourgerMacedonianMalaysianMalteseMarshalleseMenomineeMexicanMexican American IndianMongolianMoroccanNative HawaiianNavajoNepaleseNew ZealanderNicaraguanNigerianNorthern EuropeanNorwegianOkinawanOsageOttawaPaiutePakistaniPalestinianPanamanianParaguayanPennsylvania GermanPeruvianPimaPolishPortuguesePotawatomiPuebloPuerto RicanPuget Sound SalishRomanianRussianSalvadoranSamoanScandinavianScotch-IrishScottishSeminoleSenegaleseSerbianShoshoneSierra LeoneanSiouxSlavicSlovakSloveneSomaliSouth AfricanSouth AmericanSouth American IndianSoviet UnionSpaniardSpanishSpanish AmericanSpanish American IndianSri LankanSubsaharan AfricanSudaneseSwedishSwissSyrianTaiwaneseThaiTlingit-HaidaTohono O'OdhamTonganTrinidadian and TobagonianTsimshianTurkishU.S. Virgin IslanderUgandanUkrainianUruguayanUteVenezuelanVietnameseWelshWest IndianYakamaYaquiYugoslavianYumanYup'ikZimbabwean
Ancestry (Percentage)
AfghanAfricanAlaska NativeAlaskan AthabascanAlbanianAleutAlsatianAmericanApacheArabArapahoArgentineanArmenianAssyrian / Chaldean / SyriacAustralianAustrianBahamianBangladeshiBarbadianBasqueBelgianBelizeanBermudanBhutaneseBlackfeetBolivianBrazilianBritishBritish West IndianBulgarianBurmeseCajunCambodianCanadianCape VerdeanCarpatho RusynCelticCentral AmericanCentral American IndianCherokeeCheyenneChickasawChileanChineseChippewaChoctawColombianColvilleComancheCosta RicanCreeCreekCroatianCrowCubanCypriotCzechCzechoslovakianDanishDelawareDominicanDutchDutch West IndianEastern EuropeanEcuadorianEgyptianEnglishEstonianEthiopianEuropeanFijianFilipinoFinnishFrenchFrench American IndianFrench CanadianGermanGerman RussianGhanaianGreekGuamanian / ChamorroGuatemalanGuyaneseHaitianHmongHonduranHopiHoumaHungarianIcelanderIndian (Asian)IndonesianInupiatIranianIraqiIrishIroquoisIsraeliItalianJamaicanJapaneseJordanianKenyanKiowaKoreanLaotianLatvianLebaneseLiberianLithuanianLumbeeLuxembourgerMacedonianMalaysianMalteseMarshalleseMenomineeMexicanMexican American IndianMongolianMoroccanNative HawaiianNavajoNepaleseNew ZealanderNicaraguanNigerianNorthern EuropeanNorwegianOkinawanOsageOttawaPaiutePakistaniPalestinianPanamanianParaguayanPennsylvania GermanPeruvianPimaPolishPortuguesePotawatomiPuebloPuerto RicanPuget Sound SalishRomanianRussianSalvadoranSamoanScandinavianScotch-IrishScottishSeminoleSenegaleseSerbianShoshoneSierra LeoneanSiouxSlavicSlovakSloveneSomaliSouth AfricanSouth AmericanSouth American IndianSoviet UnionSpaniardSpanishSpanish AmericanSpanish American IndianSri LankanSubsaharan AfricanSudaneseSwedishSwissSyrianTaiwaneseThaiTlingit-HaidaTohono O'OdhamTonganTrinidadian and TobagonianTsimshianTurkishU.S. Virgin IslanderUgandanUkrainianUruguayanUteVenezuelanVietnameseWelshWest IndianYakamaYaquiYugoslavianYumanYup'ikZimbabwean
Immigrant Origin (Total)
AfghanistanAfricaAlbaniaArgentinaArmeniaAsiaAustraliaAustriaAzoresBahamasBangladeshBarbadosBelarusBelgiumBelizeBoliviaBosnia and HerzegovinaBrazilBulgariaBurma / MyanmarCabo VerdeCambodiaCameroonCanadaCaribbeanCentral AmericaChileChinaColombiaCongoCosta RicaCroatiaCubaCzechoslovakiaDenmarkDominicaDominican RepublicEastern AfricaEastern AsiaEastern EuropeEcuadorEgyptEl SalvadorEnglandEritreaEthiopiaEuropeFijiFranceGermanyGhanaGreeceGrenadaGuatemalaGuyanaHaitiHondurasHong KongHungaryIndiaIndonesiaIranIraqIrelandIsraelItalyJamaicaJapanJordanKazakhstanKenyaKoreaKuwaitLaosLatin AmericaLatviaLebanonLiberiaLithuaniaMalaysiaMexicoMicronesiaMiddle AfricaMoldovaMoroccoNepalNetherlandsNicaraguaNigeriaNorth MacedoniaNorthern AfricaNorthern EuropeNorwayOceaniaPakistanPanamaPeruPhilippinesPolandPortugalRomaniaRussiaSaudi ArabiaScotlandSenegalSerbiaSierra LeoneSingaporeSomaliaSouth AfricaSouth AmericaSouth Central AsiaSouth Eastern AsiaSouthern EuropeSpainSri LankaSt. Vincent and the GrenadinesSudanSwedenSwitzerlandSyriaTaiwanThailandTrinidad and TobagoTurkeyUgandaUkraineUruguayUzbekistanVenezuelaVietnamWest IndiesWestern AfricaWestern AsiaWestern EuropeYemenZaireZimbabwe
Immigrant Origin (Percentage)
AfghanistanAfricaAlbaniaArgentinaArmeniaAsiaAustraliaAustriaAzoresBahamasBangladeshBarbadosBelarusBelgiumBelizeBoliviaBosnia and HerzegovinaBrazilBulgariaBurma / MyanmarCabo VerdeCambodiaCameroonCanadaCaribbeanCentral AmericaChileChinaColombiaCongoCosta RicaCroatiaCubaCzechoslovakiaDenmarkDominicaDominican RepublicEastern AfricaEastern AsiaEastern EuropeEcuadorEgyptEl SalvadorEnglandEritreaEthiopiaEuropeFijiFranceGermanyGhanaGreeceGrenadaGuatemalaGuyanaHaitiHondurasHong KongHungaryIndiaIndonesiaIranIraqIrelandIsraelItalyJamaicaJapanJordanKazakhstanKenyaKoreaKuwaitLaosLatin AmericaLatviaLebanonLiberiaLithuaniaMalaysiaMexicoMicronesiaMiddle AfricaMoldovaMoroccoNepalNetherlandsNicaraguaNigeriaNorth MacedoniaNorthern AfricaNorthern EuropeNorwayOceaniaPakistanPanamaPeruPhilippinesPolandPortugalRomaniaRussiaSaudi ArabiaScotlandSenegalSerbiaSierra LeoneSingaporeSomaliaSouth AfricaSouth AmericaSouth Central AsiaSouth Eastern AsiaSouthern EuropeSpainSri LankaSt. Vincent and the GrenadinesSudanSwedenSwitzerlandSyriaTaiwanThailandTrinidad and TobagoTurkeyUgandaUkraineUruguayUzbekistanVenezuelaVietnamWest IndiesWestern AfricaWestern AsiaWestern EuropeYemenZaireZimbabwe
Income
Income (Families)
Income (Households)
Poverty
Poverty (Families)
Unemployment
Employment Occupations
Employment Industries
Employer Class
Commute Time
Commute Means
School Enrollment
Education by Degree Field
Occupancy
Finances
Physical Characteristics
Hawaii
Compare Zip Codes
Comparison Subject

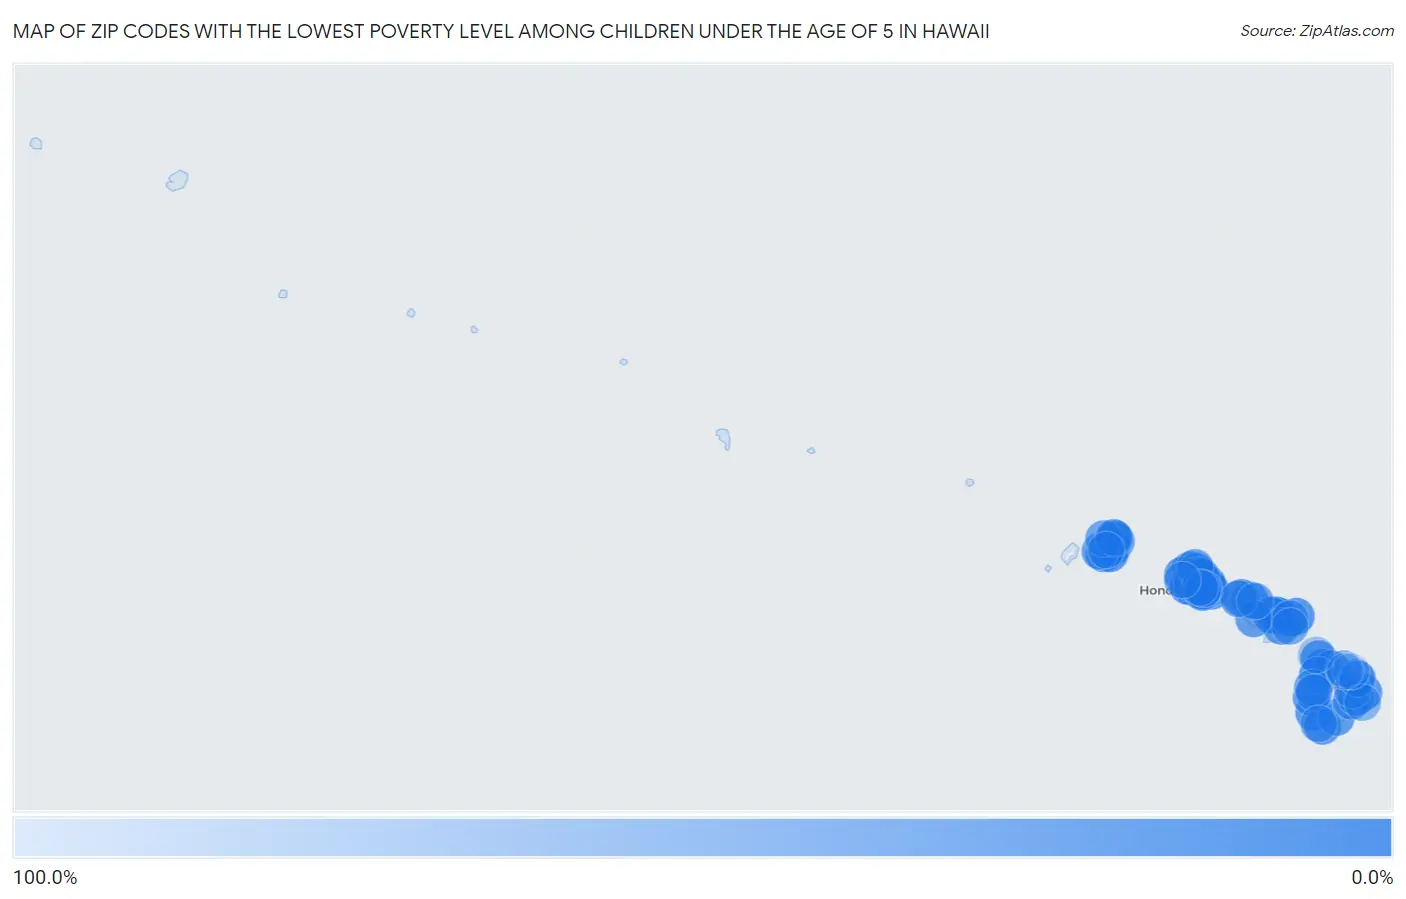
Map of Zip Codes with the Lowest Poverty Level Among Children Under the Age of 5 in Hawaii

100.0%
0.0%
Zip Codes with the Lowest Poverty Level Among Children Under the Age of 5 in Hawaii Map

Zip Codes with the Lowest Poverty Level Among Children Under the Age of 5 in Hawaii

Zip Code Child Poverty vs State vs National
1.967430.56%12.7%(-12.2)#118.1%(-17.5)#78
2.967081.1%12.7%(-11.6)#218.1%(-16.9)#343
3.968211.9%12.7%(-10.8)#318.1%(-16.2)#760
4.968142.2%12.7%(-10.5)#418.1%(-15.8)#991
5.967892.5%12.7%(-10.2)#518.1%(-15.6)#1,163
6.967122.5%12.7%(-10.2)#618.1%(-15.5)#1,184
7.967323.7%12.7%(-9.07)#718.1%(-14.4)#1,932
8.967044.0%12.7%(-8.77)#818.1%(-14.1)#2,141
9.967574.0%12.7%(-8.74)#918.1%(-14.1)#2,178
10.967504.7%12.7%(-8.08)#1018.1%(-13.4)#2,665
11.967464.7%12.7%(-8.05)#1118.1%(-13.4)#2,684
12.967664.7%12.7%(-7.99)#1218.1%(-13.3)#2,722
13.967295.0%12.7%(-7.74)#1318.1%(-13.1)#2,907
14.967015.6%12.7%(-7.09)#1418.1%(-12.4)#3,351
15.967495.9%12.7%(-6.89)#1518.1%(-12.2)#3,481
16.968185.9%12.7%(-6.86)#1618.1%(-12.2)#3,490
17.967445.9%12.7%(-6.83)#1718.1%(-12.2)#3,541
18.967935.9%12.7%(-6.79)#1818.1%(-12.1)#3,567
19.968256.0%12.7%(-6.74)#1918.1%(-12.1)#3,588
20.967056.8%12.7%(-5.89)#2018.1%(-11.2)#4,180
21.967956.9%12.7%(-5.87)#2118.1%(-11.2)#4,194
22.967827.0%12.7%(-5.72)#2218.1%(-11.1)#4,296
23.968167.2%12.7%(-5.58)#2318.1%(-10.9)#4,399
24.967347.2%12.7%(-5.51)#2418.1%(-10.8)#4,439
25.967617.7%12.7%(-5.08)#2518.1%(-10.4)#4,704
26.967567.8%12.7%(-4.97)#2618.1%(-10.3)#4,776
27.967728.2%12.7%(-4.56)#2718.1%(-9.89)#5,019
28.967558.5%12.7%(-4.25)#2818.1%(-9.57)#5,248
29.967068.5%12.7%(-4.19)#2918.1%(-9.52)#5,287
30.967038.6%12.7%(-4.18)#3018.1%(-9.50)#5,293
31.967919.1%12.7%(-3.60)#3118.1%(-8.93)#5,714
32.967279.6%12.7%(-3.17)#3218.1%(-8.50)#6,009
33.9676210.3%12.7%(-2.47)#3318.1%(-7.79)#6,419
34.9673810.5%12.7%(-2.24)#3418.1%(-7.57)#6,551
35.9678610.6%12.7%(-2.13)#3518.1%(-7.46)#6,620
36.9681310.9%12.7%(-1.81)#3618.1%(-7.14)#6,795
37.9675311.1%12.7%(-1.61)#3718.1%(-6.93)#6,934
38.9681512.2%12.7%(-0.547)#3818.1%(-5.87)#7,563
39.9677712.9%12.7%(+0.138)#3918.1%(-5.19)#7,972
40.9670713.1%12.7%(+0.412)#4018.1%(-4.91)#8,127
41.9679714.5%12.7%(+1.72)#4118.1%(-3.61)#8,920
42.9678515.1%12.7%(+2.35)#4218.1%(-2.98)#9,261
43.9676315.4%12.7%(+2.65)#4318.1%(-2.68)#9,420
44.9681715.7%12.7%(+3.01)#4418.1%(-2.32)#9,617
45.9676817.3%12.7%(+4.61)#4518.1%(-0.718)#10,411
46.9676917.6%12.7%(+4.91)#4618.1%(-0.416)#10,547
47.9671717.7%12.7%(+4.98)#4718.1%(-0.346)#10,577
48.9672817.9%12.7%(+5.12)#4818.1%(-0.206)#10,651
49.9671419.5%12.7%(+6.78)#4918.1%(+1.45)#11,414
50.9674019.7%12.7%(+7.01)#5018.1%(+1.69)#11,513
51.9672520.0%12.7%(+7.26)#5118.1%(+1.94)#11,594
52.9677120.4%12.7%(+7.71)#5218.1%(+2.39)#11,847
53.9677020.7%12.7%(+7.95)#5318.1%(+2.63)#11,946
54.9673021.5%12.7%(+8.78)#5418.1%(+3.46)#12,297
55.9673122.7%12.7%(+9.99)#5518.1%(+4.66)#12,798
56.9682623.1%12.7%(+10.3)#5618.1%(+5.00)#12,923
57.9682224.3%12.7%(+11.6)#5718.1%(+6.23)#13,423
58.9675426.5%12.7%(+13.8)#5818.1%(+8.47)#14,206
59.9672028.0%12.7%(+15.2)#5918.1%(+9.92)#14,705
60.9681928.5%12.7%(+15.8)#6018.1%(+10.5)#14,861
61.9679029.5%12.7%(+16.7)#6118.1%(+11.4)#15,159
62.9679229.7%12.7%(+16.9)#6218.1%(+11.6)#15,217
63.9674833.0%12.7%(+20.3)#6318.1%(+15.0)#16,088
64.9673733.7%12.7%(+21.0)#6418.1%(+15.7)#16,305
65.9677643.5%12.7%(+30.8)#6518.1%(+25.5)#18,268
66.9678348.5%12.7%(+35.8)#6618.1%(+30.5)#18,920
67.9674150.5%12.7%(+37.7)#6718.1%(+32.4)#19,190
68.9677850.6%12.7%(+37.9)#6818.1%(+32.5)#19,200
69.9671969.2%12.7%(+56.5)#6918.1%(+51.2)#20,487
70.96780100.0%12.7%(+87.3)#7018.1%(+81.9)#21,361
71.96774100.0%12.7%(+87.3)#7118.1%(+81.9)#21,446

Common Questions

What are the Top 10 Zip Codes with the Lowest Poverty Level Among Children Under the Age of 5 in Hawaii?
Top 10 Zip Codes with the Lowest Poverty Level Among Children Under the Age of 5 in Hawaii are:
#1
0.0%
#2
0.0%
#3
0.0%
#4
0.0%
#5
0.0%
#6
0.0%
#7
0.0%
#8
0.0%
#9
0.0%
#10
0.0%
What zip code has the Lowest Poverty Level Among Children Under the Age of 5 in Hawaii?
96743 has the Lowest Poverty Level Among Children Under the Age of 5 in Hawaii with 0.56%.
What is the Poverty Level Among Children Under the Age of 5 in the State of Hawaii?
Poverty Level Among Children Under the Age of 5 in Hawaii is 12.7%.
What is the Poverty Level Among Children Under the Age of 5 in the United States?
Poverty Level Among Children Under the Age of 5 in the United States is 18.1%.