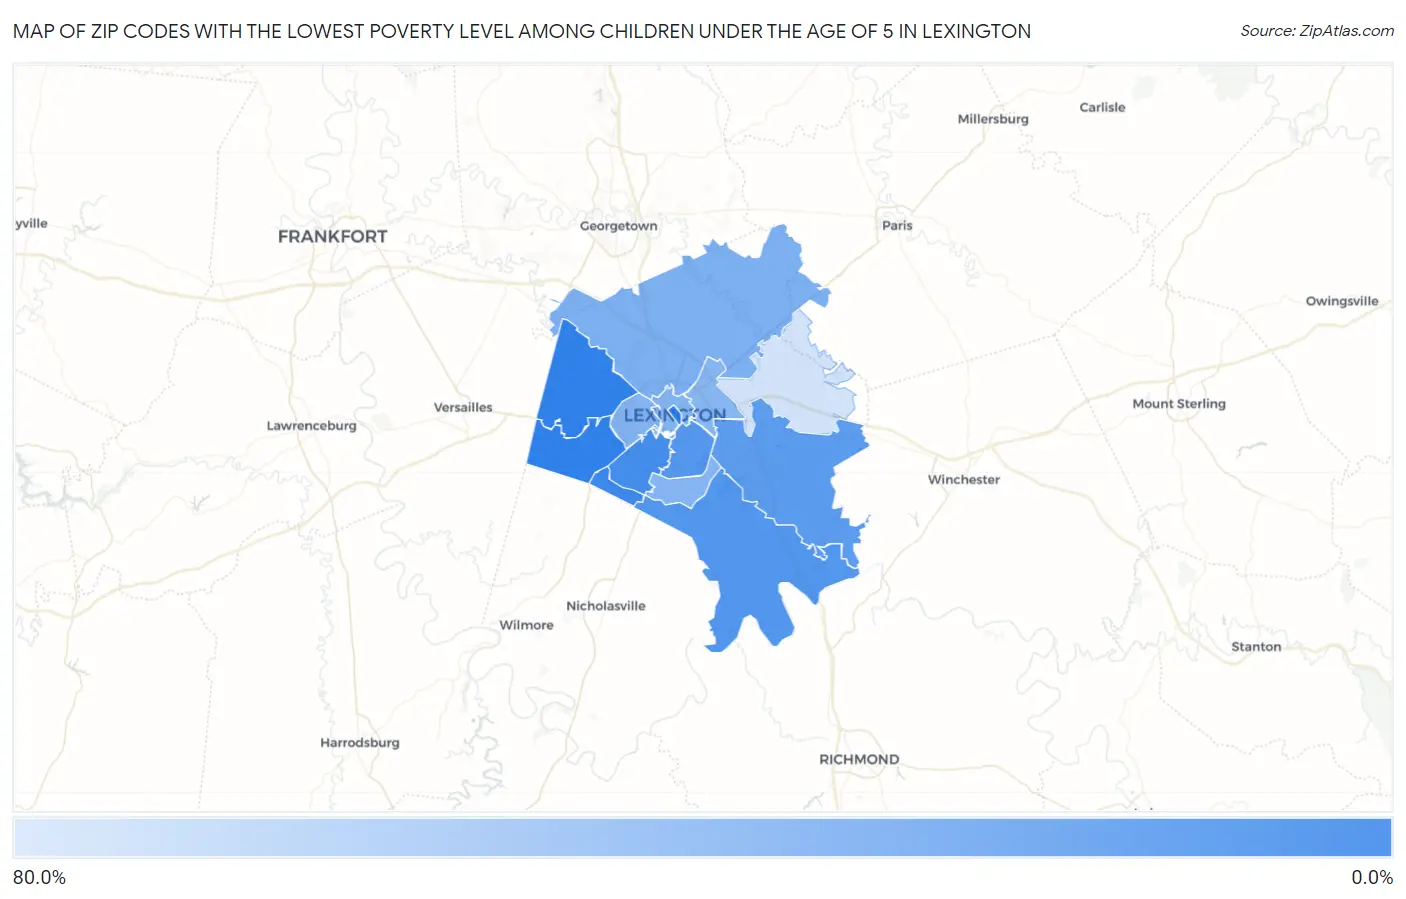
Zip Codes with the Lowest Poverty Level Among Children Under the Age of 5 in Lexington, KY
RELATED REPORTS & OPTIONS
Lowest Poverty | Child 0-5
Lexington
Compare Zip Codes
Map of Zip Codes with the Lowest Poverty Level Among Children Under the Age of 5 in Lexington
73.5%
3.6%
Zip Codes with the Lowest Poverty Level Among Children Under the Age of 5 in Lexington, KY
| Zip Code | Child Poverty | vs State | vs National | |
| 1. | 40514 | 3.6% | 23.3%(-19.7)#18 | 18.1%(-14.5)#1,878 |
| 2. | 40503 | 6.9% | 23.3%(-16.4)#49 | 18.1%(-11.1)#4,245 |
| 3. | 40515 | 11.8% | 23.3%(-11.5)#89 | 18.1%(-6.23)#7,354 |
| 4. | 40502 | 13.0% | 23.3%(-10.3)#105 | 18.1%(-5.02)#8,078 |
| 5. | 40509 | 15.8% | 23.3%(-7.57)#128 | 18.1%(-2.31)#9,622 |
| 6. | 40511 | 29.0% | 23.3%(+5.67)#240 | 18.1%(+10.9)#15,015 |
| 7. | 40508 | 32.1% | 23.3%(+8.77)#256 | 18.1%(+14.0)#15,851 |
| 8. | 40504 | 32.3% | 23.3%(+9.01)#259 | 18.1%(+14.3)#15,912 |
| 9. | 40517 | 33.2% | 23.3%(+9.89)#268 | 18.1%(+15.1)#16,126 |
| 10. | 40505 | 34.9% | 23.3%(+11.6)#277 | 18.1%(+16.8)#16,573 |
| 11. | 40516 | 73.5% | 23.3%(+50.2)#405 | 18.1%(+55.5)#20,644 |
1
Common Questions
What are the Top 10 Zip Codes with the Lowest Poverty Level Among Children Under the Age of 5 in Lexington, KY?
Top 10 Zip Codes with the Lowest Poverty Level Among Children Under the Age of 5 in Lexington, KY are:
What zip code has the Lowest Poverty Level Among Children Under the Age of 5 in Lexington, KY?
40514 has the Lowest Poverty Level Among Children Under the Age of 5 in Lexington, KY with 3.6%.
What is the Poverty Level Among Children Under the Age of 5 in Lexington, KY?
Poverty Level Among Children Under the Age of 5 in Lexington is 21.2%.
What is the Poverty Level Among Children Under the Age of 5 in Kentucky?
Poverty Level Among Children Under the Age of 5 in Kentucky is 23.3%.
What is the Poverty Level Among Children Under the Age of 5 in the United States?
Poverty Level Among Children Under the Age of 5 in the United States is 18.1%.