Zip Codes with the Lowest Poverty Level Among Children Under the Age of 5 in Florida
RELATED REPORTS & OPTIONS
Lowest Poverty | Child 0-5
Florida
Compare Zip Codes
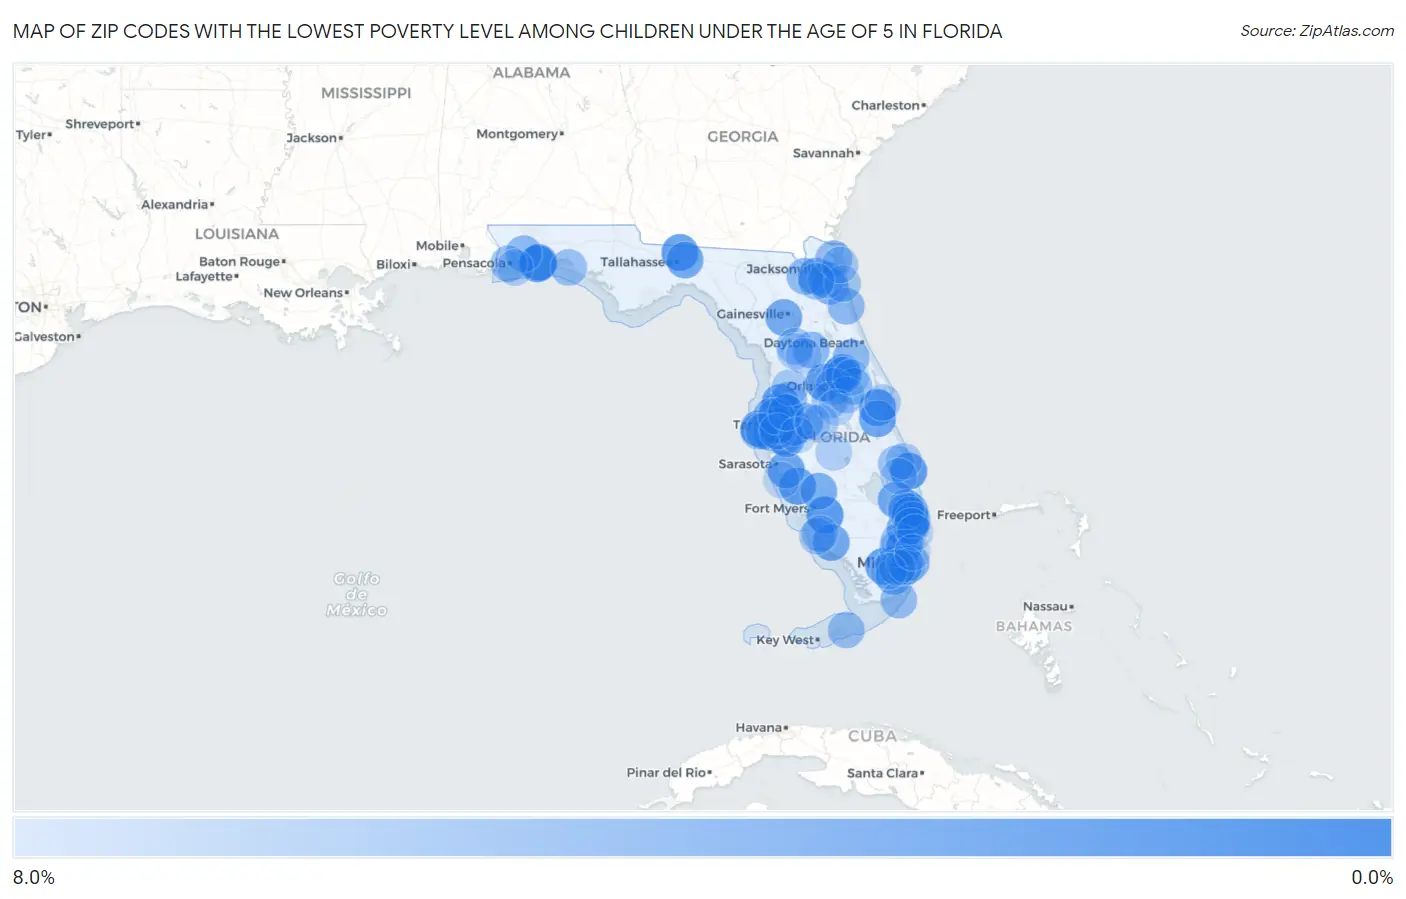
Map of Zip Codes with the Lowest Poverty Level Among Children Under the Age of 5 in Florida
8.0%
0.0%
Zip Codes with the Lowest Poverty Level Among Children Under the Age of 5 in Florida
| Zip Code | Child Poverty | vs State | vs National | |
| 1. | 32569 | 0.17% | 19.3%(-19.1)#1 | 18.1%(-17.9)#5 |
| 2. | 33913 | 0.46% | 19.3%(-18.8)#2 | 18.1%(-17.6)#48 |
| 3. | 34756 | 0.65% | 19.3%(-18.6)#3 | 18.1%(-17.4)#109 |
| 4. | 34996 | 0.70% | 19.3%(-18.6)#4 | 18.1%(-17.4)#130 |
| 5. | 33434 | 0.72% | 19.3%(-18.5)#5 | 18.1%(-17.3)#139 |
| 6. | 33558 | 0.80% | 19.3%(-18.5)#6 | 18.1%(-17.3)#171 |
| 7. | 32940 | 1.1% | 19.3%(-18.2)#7 | 18.1%(-17.0)#308 |
| 8. | 32312 | 1.1% | 19.3%(-18.2)#8 | 18.1%(-17.0)#310 |
| 9. | 33948 | 1.1% | 19.3%(-18.1)#9 | 18.1%(-16.9)#354 |
| 10. | 33194 | 1.1% | 19.3%(-18.1)#10 | 18.1%(-16.9)#356 |
| 11. | 33774 | 1.2% | 19.3%(-18.0)#11 | 18.1%(-16.9)#383 |
| 12. | 33549 | 1.2% | 19.3%(-18.0)#12 | 18.1%(-16.8)#394 |
| 13. | 34637 | 1.4% | 19.3%(-17.9)#13 | 18.1%(-16.7)#454 |
| 14. | 34241 | 1.4% | 19.3%(-17.8)#14 | 18.1%(-16.6)#483 |
| 15. | 33703 | 1.5% | 19.3%(-17.8)#15 | 18.1%(-16.6)#522 |
| 16. | 33185 | 1.6% | 19.3%(-17.7)#16 | 18.1%(-16.5)#571 |
| 17. | 32904 | 1.6% | 19.3%(-17.7)#17 | 18.1%(-16.5)#576 |
| 18. | 33572 | 1.6% | 19.3%(-17.6)#18 | 18.1%(-16.4)#614 |
| 19. | 34117 | 1.7% | 19.3%(-17.6)#19 | 18.1%(-16.4)#640 |
| 20. | 32746 | 1.7% | 19.3%(-17.5)#20 | 18.1%(-16.3)#656 |
| 21. | 33076 | 1.7% | 19.3%(-17.5)#21 | 18.1%(-16.3)#662 |
| 22. | 33470 | 1.7% | 19.3%(-17.5)#22 | 18.1%(-16.3)#665 |
| 23. | 32317 | 1.8% | 19.3%(-17.4)#23 | 18.1%(-16.2)#716 |
| 24. | 33606 | 1.8% | 19.3%(-17.4)#24 | 18.1%(-16.2)#729 |
| 25. | 32544 | 1.8% | 19.3%(-17.4)#25 | 18.1%(-16.2)#736 |
| 26. | 32608 | 1.9% | 19.3%(-17.3)#26 | 18.1%(-16.2)#771 |
| 27. | 33496 | 1.9% | 19.3%(-17.3)#27 | 18.1%(-16.1)#787 |
| 28. | 32779 | 2.0% | 19.3%(-17.3)#28 | 18.1%(-16.1)#815 |
| 29. | 33467 | 2.0% | 19.3%(-17.3)#29 | 18.1%(-16.1)#820 |
| 30. | 32222 | 2.0% | 19.3%(-17.3)#30 | 18.1%(-16.1)#832 |
| 31. | 33170 | 2.3% | 19.3%(-17.0)#31 | 18.1%(-15.8)#1,028 |
| 32. | 33982 | 2.3% | 19.3%(-16.9)#32 | 18.1%(-15.7)#1,043 |
| 33. | 33559 | 2.4% | 19.3%(-16.8)#33 | 18.1%(-15.6)#1,114 |
| 34. | 33573 | 2.4% | 19.3%(-16.8)#34 | 18.1%(-15.6)#1,135 |
| 35. | 32259 | 2.7% | 19.3%(-16.6)#35 | 18.1%(-15.4)#1,275 |
| 36. | 33414 | 2.7% | 19.3%(-16.6)#36 | 18.1%(-15.4)#1,286 |
| 37. | 33811 | 2.7% | 19.3%(-16.6)#37 | 18.1%(-15.4)#1,287 |
| 38. | 33596 | 2.8% | 19.3%(-16.4)#38 | 18.1%(-15.2)#1,393 |
| 39. | 33609 | 2.9% | 19.3%(-16.4)#39 | 18.1%(-15.2)#1,427 |
| 40. | 33629 | 2.9% | 19.3%(-16.3)#40 | 18.1%(-15.2)#1,446 |
| 41. | 33132 | 3.0% | 19.3%(-16.2)#41 | 18.1%(-15.0)#1,511 |
| 42. | 33472 | 3.0% | 19.3%(-16.2)#42 | 18.1%(-15.0)#1,533 |
| 43. | 32744 | 3.2% | 19.3%(-16.0)#43 | 18.1%(-14.8)#1,651 |
| 44. | 32179 | 3.3% | 19.3%(-15.9)#44 | 18.1%(-14.8)#1,706 |
| 45. | 33328 | 3.3% | 19.3%(-15.9)#45 | 18.1%(-14.7)#1,714 |
| 46. | 32086 | 3.4% | 19.3%(-15.9)#46 | 18.1%(-14.7)#1,734 |
| 47. | 33626 | 3.4% | 19.3%(-15.9)#47 | 18.1%(-14.7)#1,758 |
| 48. | 32583 | 3.4% | 19.3%(-15.8)#48 | 18.1%(-14.7)#1,765 |
| 49. | 32234 | 3.5% | 19.3%(-15.8)#49 | 18.1%(-14.6)#1,804 |
| 50. | 32828 | 3.5% | 19.3%(-15.8)#50 | 18.1%(-14.6)#1,811 |
| 51. | 32223 | 3.6% | 19.3%(-15.7)#51 | 18.1%(-14.5)#1,855 |
| 52. | 32226 | 3.6% | 19.3%(-15.6)#52 | 18.1%(-14.4)#1,916 |
| 53. | 33037 | 3.6% | 19.3%(-15.6)#53 | 18.1%(-14.4)#1,918 |
| 54. | 33143 | 3.7% | 19.3%(-15.6)#54 | 18.1%(-14.4)#1,920 |
| 55. | 33043 | 3.7% | 19.3%(-15.6)#55 | 18.1%(-14.4)#1,954 |
| 56. | 33576 | 3.8% | 19.3%(-15.4)#56 | 18.1%(-14.2)#2,058 |
| 57. | 33776 | 3.9% | 19.3%(-15.3)#57 | 18.1%(-14.1)#2,101 |
| 58. | 32502 | 3.9% | 19.3%(-15.3)#58 | 18.1%(-14.1)#2,126 |
| 59. | 32459 | 4.0% | 19.3%(-15.3)#59 | 18.1%(-14.1)#2,152 |
| 60. | 33029 | 4.1% | 19.3%(-15.1)#60 | 18.1%(-14.0)#2,255 |
| 61. | 34734 | 4.1% | 19.3%(-15.1)#61 | 18.1%(-13.9)#2,288 |
| 62. | 34986 | 4.2% | 19.3%(-15.1)#62 | 18.1%(-13.9)#2,324 |
| 63. | 34103 | 4.3% | 19.3%(-15.0)#63 | 18.1%(-13.8)#2,373 |
| 64. | 33777 | 4.3% | 19.3%(-15.0)#64 | 18.1%(-13.8)#2,399 |
| 65. | 34747 | 4.3% | 19.3%(-14.9)#65 | 18.1%(-13.8)#2,413 |
| 66. | 33326 | 4.4% | 19.3%(-14.8)#66 | 18.1%(-13.6)#2,503 |
| 67. | 32082 | 4.5% | 19.3%(-14.8)#67 | 18.1%(-13.6)#2,520 |
| 68. | 34474 | 4.5% | 19.3%(-14.8)#68 | 18.1%(-13.6)#2,524 |
| 69. | 32827 | 4.6% | 19.3%(-14.7)#69 | 18.1%(-13.5)#2,612 |
| 70. | 33026 | 4.6% | 19.3%(-14.7)#70 | 18.1%(-13.5)#2,623 |
| 71. | 33624 | 4.6% | 19.3%(-14.6)#71 | 18.1%(-13.4)#2,657 |
| 72. | 32227 | 4.6% | 19.3%(-14.6)#72 | 18.1%(-13.4)#2,658 |
| 73. | 34602 | 4.7% | 19.3%(-14.5)#73 | 18.1%(-13.4)#2,707 |
| 74. | 33484 | 4.7% | 19.3%(-14.5)#74 | 18.1%(-13.3)#2,712 |
| 75. | 34109 | 4.8% | 19.3%(-14.4)#75 | 18.1%(-13.2)#2,777 |
| 76. | 33134 | 4.8% | 19.3%(-14.4)#76 | 18.1%(-13.2)#2,781 |
| 77. | 34982 | 4.8% | 19.3%(-14.4)#77 | 18.1%(-13.2)#2,784 |
| 78. | 32065 | 4.9% | 19.3%(-14.4)#78 | 18.1%(-13.2)#2,802 |
| 79. | 32750 | 4.9% | 19.3%(-14.3)#79 | 18.1%(-13.1)#2,842 |
| 80. | 33839 | 5.0% | 19.3%(-14.3)#80 | 18.1%(-13.1)#2,876 |
| 81. | 32952 | 5.1% | 19.3%(-14.2)#81 | 18.1%(-13.0)#2,947 |
| 82. | 34476 | 5.2% | 19.3%(-14.1)#82 | 18.1%(-12.9)#3,014 |
| 83. | 32561 | 5.2% | 19.3%(-14.0)#83 | 18.1%(-12.8)#3,052 |
| 84. | 33872 | 5.2% | 19.3%(-14.0)#84 | 18.1%(-12.8)#3,058 |
| 85. | 34990 | 5.3% | 19.3%(-13.9)#85 | 18.1%(-12.7)#3,114 |
| 86. | 33449 | 5.4% | 19.3%(-13.8)#86 | 18.1%(-12.6)#3,188 |
| 87. | 33621 | 5.5% | 19.3%(-13.8)#87 | 18.1%(-12.6)#3,226 |
| 88. | 33133 | 5.5% | 19.3%(-13.7)#88 | 18.1%(-12.5)#3,260 |
| 89. | 33433 | 5.6% | 19.3%(-13.7)#89 | 18.1%(-12.5)#3,301 |
| 90. | 34758 | 5.7% | 19.3%(-13.6)#90 | 18.1%(-12.4)#3,359 |
| 91. | 33062 | 5.7% | 19.3%(-13.5)#91 | 18.1%(-12.3)#3,413 |
| 92. | 34491 | 5.7% | 19.3%(-13.5)#92 | 18.1%(-12.3)#3,416 |
| 93. | 32765 | 5.9% | 19.3%(-13.4)#93 | 18.1%(-12.2)#3,488 |
| 94. | 33547 | 5.9% | 19.3%(-13.4)#94 | 18.1%(-12.2)#3,530 |
| 95. | 33183 | 5.9% | 19.3%(-13.4)#95 | 18.1%(-12.2)#3,535 |
| 96. | 34285 | 5.9% | 19.3%(-13.3)#96 | 18.1%(-12.1)#3,562 |
| 97. | 33196 | 6.0% | 19.3%(-13.2)#97 | 18.1%(-12.0)#3,626 |
| 98. | 33160 | 6.1% | 19.3%(-13.2)#98 | 18.1%(-12.0)#3,656 |
| 99. | 33647 | 6.1% | 19.3%(-13.2)#99 | 18.1%(-12.0)#3,657 |
| 100. | 33812 | 6.1% | 19.3%(-13.1)#100 | 18.1%(-11.9)#3,686 |
Common Questions
What are the Top 10 Zip Codes with the Lowest Poverty Level Among Children Under the Age of 5 in Florida?
Top 10 Zip Codes with the Lowest Poverty Level Among Children Under the Age of 5 in Florida are:
What zip code has the Lowest Poverty Level Among Children Under the Age of 5 in Florida?
32569 has the Lowest Poverty Level Among Children Under the Age of 5 in Florida with 0.17%.
What is the Poverty Level Among Children Under the Age of 5 in the State of Florida?
Poverty Level Among Children Under the Age of 5 in Florida is 19.3%.
What is the Poverty Level Among Children Under the Age of 5 in the United States?
Poverty Level Among Children Under the Age of 5 in the United States is 18.1%.