Zip Codes with the Lowest Poverty Level Among Children Under the Age of 5 in North Carolina
RELATED REPORTS & OPTIONS
Lowest Poverty | Child 0-5
North Carolina
Compare Zip Codes
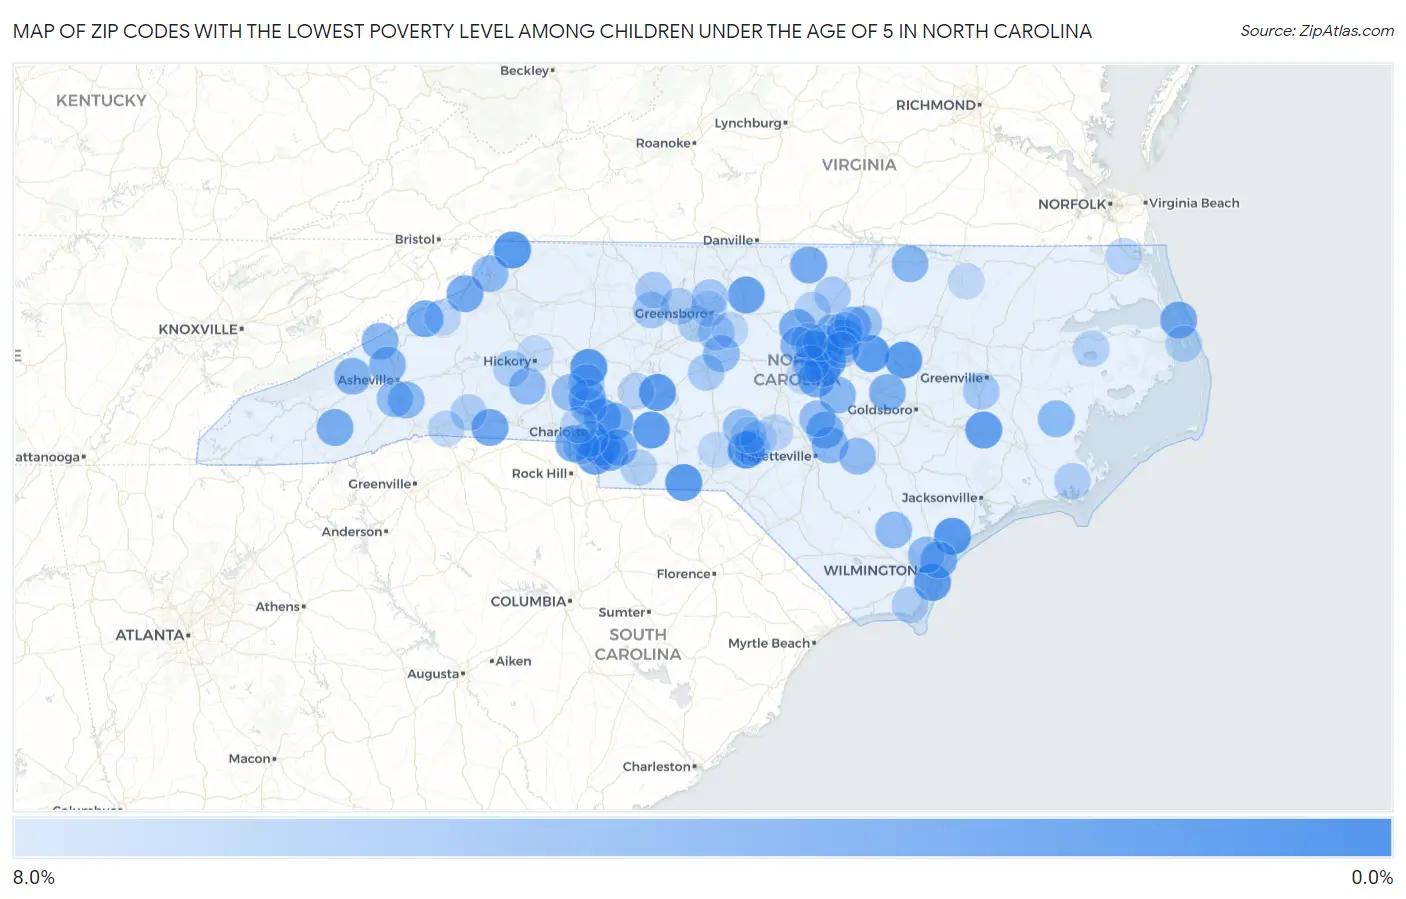
Map of Zip Codes with the Lowest Poverty Level Among Children Under the Age of 5 in North Carolina
8.0%
0.0%
Zip Codes with the Lowest Poverty Level Among Children Under the Age of 5 in North Carolina
| Zip Code | Child Poverty | vs State | vs National | |
| 1. | 28373 | 0.41% | 20.3%(-19.9)#1 | 18.1%(-17.7)#33 |
| 2. | 28443 | 0.49% | 20.3%(-19.8)#2 | 18.1%(-17.6)#58 |
| 3. | 28643 | 0.50% | 20.3%(-19.8)#3 | 18.1%(-17.6)#62 |
| 4. | 28166 | 0.63% | 20.3%(-19.7)#4 | 18.1%(-17.4)#103 |
| 5. | 27880 | 0.74% | 20.3%(-19.5)#5 | 18.1%(-17.3)#149 |
| 6. | 27591 | 0.77% | 20.3%(-19.5)#6 | 18.1%(-17.3)#160 |
| 7. | 28119 | 0.79% | 20.3%(-19.5)#7 | 18.1%(-17.3)#167 |
| 8. | 28129 | 0.96% | 20.3%(-19.3)#8 | 18.1%(-17.1)#258 |
| 9. | 28409 | 1.0% | 20.3%(-19.3)#9 | 18.1%(-17.0)#281 |
| 10. | 28137 | 1.1% | 20.3%(-19.2)#10 | 18.1%(-17.0)#313 |
| 11. | 27518 | 1.3% | 20.3%(-19.0)#11 | 18.1%(-16.7)#430 |
| 12. | 28526 | 1.4% | 20.3%(-18.9)#12 | 18.1%(-16.7)#474 |
| 13. | 27244 | 1.5% | 20.3%(-18.7)#13 | 18.1%(-16.5)#549 |
| 14. | 28277 | 1.7% | 20.3%(-18.6)#14 | 18.1%(-16.4)#644 |
| 15. | 28270 | 1.9% | 20.3%(-18.4)#15 | 18.1%(-16.2)#755 |
| 16. | 27540 | 2.2% | 20.3%(-18.1)#16 | 18.1%(-15.9)#937 |
| 17. | 28114 | 2.2% | 20.3%(-18.0)#17 | 18.1%(-15.8)#984 |
| 18. | 28622 | 2.3% | 20.3%(-18.0)#18 | 18.1%(-15.8)#1,018 |
| 19. | 28740 | 2.5% | 20.3%(-17.8)#19 | 18.1%(-15.6)#1,150 |
| 20. | 28278 | 2.6% | 20.3%(-17.7)#20 | 18.1%(-15.5)#1,213 |
| 21. | 27513 | 2.6% | 20.3%(-17.6)#21 | 18.1%(-15.4)#1,241 |
| 22. | 27948 | 2.7% | 20.3%(-17.6)#22 | 18.1%(-15.4)#1,280 |
| 23. | 28262 | 2.8% | 20.3%(-17.5)#23 | 18.1%(-15.3)#1,330 |
| 24. | 28104 | 2.8% | 20.3%(-17.5)#24 | 18.1%(-15.3)#1,359 |
| 25. | 28723 | 2.8% | 20.3%(-17.5)#25 | 18.1%(-15.3)#1,365 |
| 26. | 27574 | 2.8% | 20.3%(-17.4)#26 | 18.1%(-15.2)#1,401 |
| 27. | 28031 | 2.9% | 20.3%(-17.4)#27 | 18.1%(-15.1)#1,456 |
| 28. | 27514 | 3.0% | 20.3%(-17.3)#28 | 18.1%(-15.1)#1,503 |
| 29. | 27613 | 3.1% | 20.3%(-17.2)#29 | 18.1%(-15.0)#1,562 |
| 30. | 28075 | 3.1% | 20.3%(-17.2)#30 | 18.1%(-15.0)#1,573 |
| 31. | 28356 | 3.1% | 20.3%(-17.2)#31 | 18.1%(-14.9)#1,581 |
| 32. | 28411 | 3.2% | 20.3%(-17.1)#32 | 18.1%(-14.9)#1,642 |
| 33. | 27568 | 3.3% | 20.3%(-17.0)#33 | 18.1%(-14.8)#1,699 |
| 34. | 27615 | 3.3% | 20.3%(-16.9)#34 | 18.1%(-14.7)#1,730 |
| 35. | 27587 | 3.6% | 20.3%(-16.7)#35 | 18.1%(-14.5)#1,871 |
| 36. | 28753 | 3.6% | 20.3%(-16.7)#36 | 18.1%(-14.4)#1,902 |
| 37. | 28079 | 3.6% | 20.3%(-16.6)#37 | 18.1%(-14.4)#1,919 |
| 38. | 28721 | 3.7% | 20.3%(-16.6)#38 | 18.1%(-14.4)#1,951 |
| 39. | 28701 | 3.7% | 20.3%(-16.6)#39 | 18.1%(-14.4)#1,953 |
| 40. | 27517 | 3.8% | 20.3%(-16.4)#40 | 18.1%(-14.2)#2,050 |
| 41. | 27551 | 3.9% | 20.3%(-16.4)#41 | 18.1%(-14.1)#2,109 |
| 42. | 27501 | 4.0% | 20.3%(-16.3)#42 | 18.1%(-14.1)#2,157 |
| 43. | 27539 | 4.0% | 20.3%(-16.2)#43 | 18.1%(-14.0)#2,197 |
| 44. | 27806 | 4.1% | 20.3%(-16.2)#44 | 18.1%(-14.0)#2,227 |
| 45. | 28732 | 4.1% | 20.3%(-16.2)#45 | 18.1%(-14.0)#2,232 |
| 46. | 28395 | 4.1% | 20.3%(-16.1)#46 | 18.1%(-13.9)#2,287 |
| 47. | 28698 | 4.2% | 20.3%(-16.1)#47 | 18.1%(-13.9)#2,347 |
| 48. | 27519 | 4.2% | 20.3%(-16.1)#48 | 18.1%(-13.8)#2,357 |
| 49. | 27502 | 4.3% | 20.3%(-16.0)#49 | 18.1%(-13.8)#2,389 |
| 50. | 28168 | 4.4% | 20.3%(-15.8)#50 | 18.1%(-13.6)#2,498 |
| 51. | 28421 | 4.5% | 20.3%(-15.8)#51 | 18.1%(-13.5)#2,570 |
| 52. | 27248 | 4.5% | 20.3%(-15.8)#52 | 18.1%(-13.5)#2,574 |
| 53. | 28429 | 4.5% | 20.3%(-15.7)#53 | 18.1%(-13.5)#2,583 |
| 54. | 28385 | 4.5% | 20.3%(-15.7)#54 | 18.1%(-13.5)#2,589 |
| 55. | 28704 | 4.7% | 20.3%(-15.6)#55 | 18.1%(-13.4)#2,698 |
| 56. | 28078 | 4.7% | 20.3%(-15.5)#56 | 18.1%(-13.3)#2,721 |
| 57. | 28037 | 4.9% | 20.3%(-15.4)#57 | 18.1%(-13.2)#2,797 |
| 58. | 27376 | 4.9% | 20.3%(-15.4)#58 | 18.1%(-13.2)#2,806 |
| 59. | 28323 | 4.9% | 20.3%(-15.4)#59 | 18.1%(-13.1)#2,850 |
| 60. | 27596 | 5.3% | 20.3%(-15.0)#60 | 18.1%(-12.8)#3,100 |
| 61. | 28209 | 5.5% | 20.3%(-14.8)#61 | 18.1%(-12.6)#3,249 |
| 62. | 28590 | 5.8% | 20.3%(-14.4)#62 | 18.1%(-12.2)#3,475 |
| 63. | 27104 | 5.9% | 20.3%(-14.4)#63 | 18.1%(-12.2)#3,489 |
| 64. | 28117 | 5.9% | 20.3%(-14.4)#64 | 18.1%(-12.2)#3,492 |
| 65. | 27455 | 5.9% | 20.3%(-14.4)#65 | 18.1%(-12.2)#3,536 |
| 66. | 27313 | 6.2% | 20.3%(-14.1)#66 | 18.1%(-11.9)#3,735 |
| 67. | 27045 | 6.2% | 20.3%(-14.1)#67 | 18.1%(-11.8)#3,745 |
| 68. | 27581 | 6.2% | 20.3%(-14.1)#68 | 18.1%(-11.8)#3,748 |
| 69. | 28315 | 6.3% | 20.3%(-14.0)#69 | 18.1%(-11.8)#3,803 |
| 70. | 27205 | 6.4% | 20.3%(-13.9)#70 | 18.1%(-11.7)#3,853 |
| 71. | 27284 | 6.4% | 20.3%(-13.9)#71 | 18.1%(-11.7)#3,877 |
| 72. | 27282 | 6.5% | 20.3%(-13.8)#72 | 18.1%(-11.6)#3,914 |
| 73. | 28612 | 6.5% | 20.3%(-13.8)#73 | 18.1%(-11.6)#3,920 |
| 74. | 28516 | 6.5% | 20.3%(-13.8)#74 | 18.1%(-11.6)#3,926 |
| 75. | 28160 | 6.5% | 20.3%(-13.8)#75 | 18.1%(-11.5)#3,943 |
| 76. | 27560 | 6.5% | 20.3%(-13.7)#76 | 18.1%(-11.5)#3,956 |
| 77. | 28174 | 6.7% | 20.3%(-13.6)#77 | 18.1%(-11.4)#4,028 |
| 78. | 28461 | 6.7% | 20.3%(-13.6)#78 | 18.1%(-11.4)#4,083 |
| 79. | 27609 | 6.8% | 20.3%(-13.4)#79 | 18.1%(-11.2)#4,167 |
| 80. | 27981 | 6.9% | 20.3%(-13.4)#80 | 18.1%(-11.1)#4,242 |
| 81. | 27928 | 7.0% | 20.3%(-13.3)#81 | 18.1%(-11.1)#4,262 |
| 82. | 27712 | 7.1% | 20.3%(-13.2)#82 | 18.1%(-11.0)#4,326 |
| 83. | 28138 | 7.1% | 20.3%(-13.2)#83 | 18.1%(-11.0)#4,330 |
| 84. | 27614 | 7.1% | 20.3%(-13.2)#84 | 18.1%(-10.9)#4,355 |
| 85. | 27958 | 7.1% | 20.3%(-13.1)#85 | 18.1%(-10.9)#4,359 |
| 86. | 28722 | 7.1% | 20.3%(-13.1)#86 | 18.1%(-10.9)#4,361 |
| 87. | 28273 | 7.2% | 20.3%(-13.1)#87 | 18.1%(-10.9)#4,397 |
| 88. | 28214 | 7.2% | 20.3%(-13.0)#88 | 18.1%(-10.8)#4,441 |
| 89. | 27408 | 7.3% | 20.3%(-13.0)#89 | 18.1%(-10.8)#4,476 |
| 90. | 28705 | 7.3% | 20.3%(-12.9)#90 | 18.1%(-10.7)#4,506 |
| 91. | 27608 | 7.4% | 20.3%(-12.9)#91 | 18.1%(-10.7)#4,532 |
| 92. | 28394 | 7.4% | 20.3%(-12.9)#92 | 18.1%(-10.6)#4,559 |
| 93. | 28338 | 7.5% | 20.3%(-12.8)#93 | 18.1%(-10.6)#4,601 |
| 94. | 27283 | 7.6% | 20.3%(-12.7)#94 | 18.1%(-10.5)#4,672 |
| 95. | 27562 | 7.6% | 20.3%(-12.7)#95 | 18.1%(-10.4)#4,680 |
| 96. | 28387 | 7.6% | 20.3%(-12.6)#96 | 18.1%(-10.4)#4,690 |
| 97. | 28374 | 7.7% | 20.3%(-12.6)#97 | 18.1%(-10.4)#4,700 |
| 98. | 27713 | 7.8% | 20.3%(-12.5)#98 | 18.1%(-10.3)#4,769 |
| 99. | 28601 | 7.8% | 20.3%(-12.5)#99 | 18.1%(-10.2)#4,806 |
| 100. | 27839 | 7.8% | 20.3%(-12.4)#100 | 18.1%(-10.2)#4,812 |
Common Questions
What are the Top 10 Zip Codes with the Lowest Poverty Level Among Children Under the Age of 5 in North Carolina?
Top 10 Zip Codes with the Lowest Poverty Level Among Children Under the Age of 5 in North Carolina are:
What zip code has the Lowest Poverty Level Among Children Under the Age of 5 in North Carolina?
28373 has the Lowest Poverty Level Among Children Under the Age of 5 in North Carolina with 0.41%.
What is the Poverty Level Among Children Under the Age of 5 in the State of North Carolina?
Poverty Level Among Children Under the Age of 5 in North Carolina is 20.3%.
What is the Poverty Level Among Children Under the Age of 5 in the United States?
Poverty Level Among Children Under the Age of 5 in the United States is 18.1%.