Zip Codes with the Lowest Poverty Level Among Children Under the Age of 5 in Wyoming

RELATED REPORTS & OPTIONS

Lowest Poverty | Child 0-5
Population
Families and Households
Female Fertility
Female Fertility (Unmarried)
Race (Community Size)
Race (Percentage)
Ancestry (Community Size)
AfghanAfricanAlaska NativeAlaskan AthabascanAlbanianAleutAlsatianAmericanApacheArabArapahoArgentineanArmenianAssyrian / Chaldean / SyriacAustralianAustrianBahamianBangladeshiBarbadianBasqueBelgianBelizeanBermudanBhutaneseBlackfeetBolivianBrazilianBritishBritish West IndianBulgarianBurmeseCajunCambodianCanadianCape VerdeanCarpatho RusynCelticCentral AmericanCentral American IndianCherokeeCheyenneChickasawChileanChineseChippewaChoctawColombianColvilleComancheCosta RicanCreeCreekCroatianCrowCubanCypriotCzechCzechoslovakianDanishDelawareDominicanDutchDutch West IndianEastern EuropeanEcuadorianEgyptianEnglishEstonianEthiopianEuropeanFijianFilipinoFinnishFrenchFrench American IndianFrench CanadianGermanGerman RussianGhanaianGreekGuamanian / ChamorroGuatemalanGuyaneseHaitianHmongHonduranHopiHoumaHungarianIcelanderIndian (Asian)IndonesianInupiatIranianIraqiIrishIroquoisIsraeliItalianJamaicanJapaneseJordanianKenyanKiowaKoreanLaotianLatvianLebaneseLiberianLithuanianLumbeeLuxembourgerMacedonianMalaysianMalteseMarshalleseMenomineeMexicanMexican American IndianMongolianMoroccanNative HawaiianNavajoNepaleseNew ZealanderNicaraguanNigerianNorthern EuropeanNorwegianOkinawanOsageOttawaPaiutePakistaniPalestinianPanamanianParaguayanPennsylvania GermanPeruvianPimaPolishPortuguesePotawatomiPuebloPuerto RicanPuget Sound SalishRomanianRussianSalvadoranSamoanScandinavianScotch-IrishScottishSeminoleSenegaleseSerbianShoshoneSierra LeoneanSiouxSlavicSlovakSloveneSomaliSouth AfricanSouth AmericanSouth American IndianSoviet UnionSpaniardSpanishSpanish AmericanSpanish American IndianSri LankanSubsaharan AfricanSudaneseSwedishSwissSyrianTaiwaneseThaiTlingit-HaidaTohono O'OdhamTonganTrinidadian and TobagonianTsimshianTurkishU.S. Virgin IslanderUgandanUkrainianUruguayanUteVenezuelanVietnameseWelshWest IndianYakamaYaquiYugoslavianYumanYup'ikZimbabwean
Ancestry (Percentage)
AfghanAfricanAlaska NativeAlaskan AthabascanAlbanianAleutAlsatianAmericanApacheArabArapahoArgentineanArmenianAssyrian / Chaldean / SyriacAustralianAustrianBahamianBangladeshiBarbadianBasqueBelgianBelizeanBermudanBhutaneseBlackfeetBolivianBrazilianBritishBritish West IndianBulgarianBurmeseCajunCambodianCanadianCape VerdeanCarpatho RusynCelticCentral AmericanCentral American IndianCherokeeCheyenneChickasawChileanChineseChippewaChoctawColombianColvilleComancheCosta RicanCreeCreekCroatianCrowCubanCypriotCzechCzechoslovakianDanishDelawareDominicanDutchDutch West IndianEastern EuropeanEcuadorianEgyptianEnglishEstonianEthiopianEuropeanFijianFilipinoFinnishFrenchFrench American IndianFrench CanadianGermanGerman RussianGhanaianGreekGuamanian / ChamorroGuatemalanGuyaneseHaitianHmongHonduranHopiHoumaHungarianIcelanderIndian (Asian)IndonesianInupiatIranianIraqiIrishIroquoisIsraeliItalianJamaicanJapaneseJordanianKenyanKiowaKoreanLaotianLatvianLebaneseLiberianLithuanianLumbeeLuxembourgerMacedonianMalaysianMalteseMarshalleseMenomineeMexicanMexican American IndianMongolianMoroccanNative HawaiianNavajoNepaleseNew ZealanderNicaraguanNigerianNorthern EuropeanNorwegianOkinawanOsageOttawaPaiutePakistaniPalestinianPanamanianParaguayanPennsylvania GermanPeruvianPimaPolishPortuguesePotawatomiPuebloPuerto RicanPuget Sound SalishRomanianRussianSalvadoranSamoanScandinavianScotch-IrishScottishSeminoleSenegaleseSerbianShoshoneSierra LeoneanSiouxSlavicSlovakSloveneSomaliSouth AfricanSouth AmericanSouth American IndianSoviet UnionSpaniardSpanishSpanish AmericanSpanish American IndianSri LankanSubsaharan AfricanSudaneseSwedishSwissSyrianTaiwaneseThaiTlingit-HaidaTohono O'OdhamTonganTrinidadian and TobagonianTsimshianTurkishU.S. Virgin IslanderUgandanUkrainianUruguayanUteVenezuelanVietnameseWelshWest IndianYakamaYaquiYugoslavianYumanYup'ikZimbabwean
Immigrant Origin (Total)
AfghanistanAfricaAlbaniaArgentinaArmeniaAsiaAustraliaAustriaAzoresBahamasBangladeshBarbadosBelarusBelgiumBelizeBoliviaBosnia and HerzegovinaBrazilBulgariaBurma / MyanmarCabo VerdeCambodiaCameroonCanadaCaribbeanCentral AmericaChileChinaColombiaCongoCosta RicaCroatiaCubaCzechoslovakiaDenmarkDominicaDominican RepublicEastern AfricaEastern AsiaEastern EuropeEcuadorEgyptEl SalvadorEnglandEritreaEthiopiaEuropeFijiFranceGermanyGhanaGreeceGrenadaGuatemalaGuyanaHaitiHondurasHong KongHungaryIndiaIndonesiaIranIraqIrelandIsraelItalyJamaicaJapanJordanKazakhstanKenyaKoreaKuwaitLaosLatin AmericaLatviaLebanonLiberiaLithuaniaMalaysiaMexicoMicronesiaMiddle AfricaMoldovaMoroccoNepalNetherlandsNicaraguaNigeriaNorth MacedoniaNorthern AfricaNorthern EuropeNorwayOceaniaPakistanPanamaPeruPhilippinesPolandPortugalRomaniaRussiaSaudi ArabiaScotlandSenegalSerbiaSierra LeoneSingaporeSomaliaSouth AfricaSouth AmericaSouth Central AsiaSouth Eastern AsiaSouthern EuropeSpainSri LankaSt. Vincent and the GrenadinesSudanSwedenSwitzerlandSyriaTaiwanThailandTrinidad and TobagoTurkeyUgandaUkraineUruguayUzbekistanVenezuelaVietnamWest IndiesWestern AfricaWestern AsiaWestern EuropeYemenZaireZimbabwe
Immigrant Origin (Percentage)
AfghanistanAfricaAlbaniaArgentinaArmeniaAsiaAustraliaAustriaAzoresBahamasBangladeshBarbadosBelarusBelgiumBelizeBoliviaBosnia and HerzegovinaBrazilBulgariaBurma / MyanmarCabo VerdeCambodiaCameroonCanadaCaribbeanCentral AmericaChileChinaColombiaCongoCosta RicaCroatiaCubaCzechoslovakiaDenmarkDominicaDominican RepublicEastern AfricaEastern AsiaEastern EuropeEcuadorEgyptEl SalvadorEnglandEritreaEthiopiaEuropeFijiFranceGermanyGhanaGreeceGrenadaGuatemalaGuyanaHaitiHondurasHong KongHungaryIndiaIndonesiaIranIraqIrelandIsraelItalyJamaicaJapanJordanKazakhstanKenyaKoreaKuwaitLaosLatin AmericaLatviaLebanonLiberiaLithuaniaMalaysiaMexicoMicronesiaMiddle AfricaMoldovaMoroccoNepalNetherlandsNicaraguaNigeriaNorth MacedoniaNorthern AfricaNorthern EuropeNorwayOceaniaPakistanPanamaPeruPhilippinesPolandPortugalRomaniaRussiaSaudi ArabiaScotlandSenegalSerbiaSierra LeoneSingaporeSomaliaSouth AfricaSouth AmericaSouth Central AsiaSouth Eastern AsiaSouthern EuropeSpainSri LankaSt. Vincent and the GrenadinesSudanSwedenSwitzerlandSyriaTaiwanThailandTrinidad and TobagoTurkeyUgandaUkraineUruguayUzbekistanVenezuelaVietnamWest IndiesWestern AfricaWestern AsiaWestern EuropeYemenZaireZimbabwe
Income
Income (Families)
Income (Households)
Poverty
Poverty (Families)
Unemployment
Employment Occupations
Employment Industries
Employer Class
Commute Time
Commute Means
School Enrollment
Education by Degree Field
Occupancy
Finances
Physical Characteristics
Wyoming
Compare Zip Codes
Comparison Subject

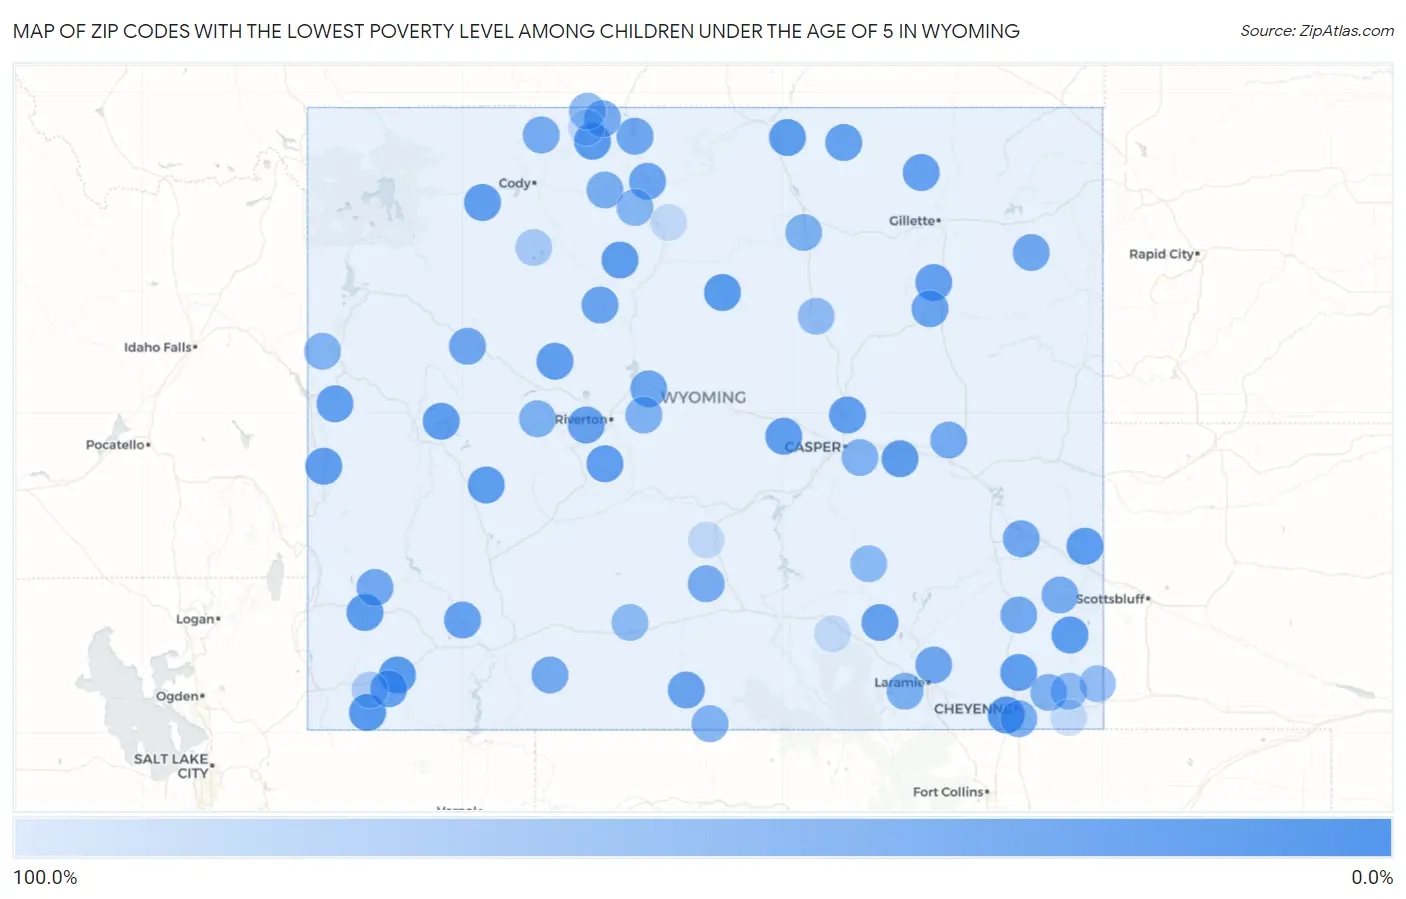
Map of Zip Codes with the Lowest Poverty Level Among Children Under the Age of 5 in Wyoming

100.0%
0.0%
Zip Codes with the Lowest Poverty Level Among Children Under the Age of 5 in Wyoming Map

Zip Codes with the Lowest Poverty Level Among Children Under the Age of 5 in Wyoming

Zip Code Child Poverty vs State vs National
1.829301.1%16.1%(-15.0)#118.1%(-16.9)#345
2.820011.9%16.1%(-14.2)#218.1%(-16.1)#781
3.824122.4%16.1%(-13.7)#318.1%(-15.6)#1,132
4.829372.8%16.1%(-13.3)#418.1%(-15.2)#1,395
5.824424.0%16.1%(-12.1)#518.1%(-14.1)#2,177
6.822404.4%16.1%(-11.7)#618.1%(-13.7)#2,477
7.822215.3%16.1%(-10.9)#718.1%(-12.8)#3,077
8.831165.6%16.1%(-10.6)#818.1%(-12.5)#3,294
9.826377.0%16.1%(-9.10)#918.1%(-11.0)#4,302
10.829237.0%16.1%(-9.07)#1018.1%(-11.0)#4,320
11.828017.3%16.1%(-8.86)#1118.1%(-10.8)#4,454
12.824017.5%16.1%(-8.62)#1218.1%(-10.6)#4,597
13.829417.7%16.1%(-8.40)#1318.1%(-10.3)#4,757
14.826048.8%16.1%(-7.31)#1418.1%(-9.26)#5,480
15.825209.0%16.1%(-7.09)#1518.1%(-9.04)#5,630
16.831109.0%16.1%(-7.07)#1618.1%(-9.02)#5,639
17.820099.6%16.1%(-6.53)#1718.1%(-8.48)#6,022
18.824149.7%16.1%(-6.38)#1818.1%(-8.33)#6,099
19.825239.8%16.1%(-6.36)#1918.1%(-8.31)#6,114
20.826019.8%16.1%(-6.35)#2018.1%(-8.29)#6,124
21.8312811.9%16.1%(-4.19)#2118.1%(-6.14)#7,408
22.8293512.4%16.1%(-3.72)#2218.1%(-5.67)#7,704
23.8293912.8%16.1%(-3.29)#2318.1%(-5.24)#7,936
24.8271813.1%16.1%(-3.02)#2418.1%(-4.97)#8,094
25.8271613.1%16.1%(-2.99)#2518.1%(-4.93)#8,120
26.8283515.1%16.1%(-1.02)#2618.1%(-2.97)#9,270
27.8208315.4%16.1%(-0.731)#2718.1%(-2.68)#9,454
28.8251015.9%16.1%(-0.262)#2818.1%(-2.21)#9,681
29.8232116.4%16.1%(+0.248)#2918.1%(-1.70)#9,960
30.8244317.4%16.1%(+1.32)#3018.1%(-0.632)#10,450
31.8273218.1%16.1%(+1.99)#3118.1%(+0.047)#10,763
32.8242619.1%16.1%(+3.00)#3218.1%(+1.05)#11,214
33.8264921.8%16.1%(+5.68)#3318.1%(+3.73)#12,406
34.8273022.5%16.1%(+6.38)#3418.1%(+4.44)#12,709
35.8207223.3%16.1%(+7.18)#3518.1%(+5.23)#13,023
36.8243123.4%16.1%(+7.33)#3618.1%(+5.39)#13,077
37.8251323.8%16.1%(+7.69)#3718.1%(+5.75)#13,236
38.8221424.1%16.1%(+7.96)#3818.1%(+6.01)#13,349
39.8310124.7%16.1%(+8.55)#3918.1%(+6.60)#13,546
40.8290127.1%16.1%(+10.9)#4018.1%(+8.99)#14,381
41.8221027.3%16.1%(+11.2)#4118.1%(+9.21)#14,460
42.8263328.8%16.1%(+12.7)#4218.1%(+10.8)#14,977
43.8243529.7%16.1%(+13.6)#4318.1%(+11.7)#15,240
44.8224430.0%16.1%(+13.9)#4418.1%(+11.9)#15,321
45.8230131.3%16.1%(+15.2)#4518.1%(+13.2)#15,670
46.8242031.4%16.1%(+15.3)#4618.1%(+13.4)#15,701
47.8241131.8%16.1%(+15.7)#4718.1%(+13.8)#15,796
48.8200733.8%16.1%(+17.7)#4818.1%(+15.7)#16,326
49.8283435.9%16.1%(+19.8)#4918.1%(+17.9)#16,834
50.8207036.8%16.1%(+20.6)#5018.1%(+18.7)#17,027
51.8251437.1%16.1%(+21.0)#5118.1%(+19.0)#17,095
52.8250138.5%16.1%(+22.4)#5218.1%(+20.5)#17,372
53.8232338.9%16.1%(+22.8)#5318.1%(+20.8)#17,444
54.8206038.9%16.1%(+22.8)#5418.1%(+20.9)#17,448
55.8301442.6%16.1%(+26.5)#5518.1%(+24.6)#18,124
56.8260942.9%16.1%(+26.8)#5618.1%(+24.8)#18,174
57.8241044.0%16.1%(+27.9)#5718.1%(+25.9)#18,334
58.8242347.6%16.1%(+31.5)#5818.1%(+29.6)#18,816
59.8232950.0%16.1%(+33.9)#5918.1%(+31.9)#19,110
60.8233650.0%16.1%(+33.9)#6018.1%(+31.9)#19,127
61.8205352.6%16.1%(+36.4)#6118.1%(+34.5)#19,380
62.8263955.2%16.1%(+39.1)#6218.1%(+37.1)#19,612
63.8208257.7%16.1%(+41.6)#6318.1%(+39.6)#19,822
64.8243374.2%16.1%(+58.1)#6418.1%(+56.1)#20,674
65.8293378.8%16.1%(+62.7)#6518.1%(+60.8)#20,826
66.82054100.0%16.1%(+83.9)#6618.1%(+81.9)#21,207
67.82421100.0%16.1%(+83.9)#6718.1%(+81.9)#21,447
68.82432100.0%16.1%(+83.9)#6818.1%(+81.9)#21,450
69.82322100.0%16.1%(+83.9)#7018.1%(+81.9)#21,562
70.82324100.0%16.1%(+83.9)#7118.1%(+81.9)#21,564

Common Questions

What are the Top 10 Zip Codes with the Lowest Poverty Level Among Children Under the Age of 5 in Wyoming?
Top 10 Zip Codes with the Lowest Poverty Level Among Children Under the Age of 5 in Wyoming are:
#1
0.0%
#2
0.0%
#3
0.0%
#4
0.0%
#5
0.0%
#6
0.0%
#7
0.0%
#8
0.0%
#9
0.0%
#10
0.0%
What zip code has the Lowest Poverty Level Among Children Under the Age of 5 in Wyoming?
82930 has the Lowest Poverty Level Among Children Under the Age of 5 in Wyoming with 1.1%.
What is the Poverty Level Among Children Under the Age of 5 in the State of Wyoming?
Poverty Level Among Children Under the Age of 5 in Wyoming is 16.1%.
What is the Poverty Level Among Children Under the Age of 5 in the United States?
Poverty Level Among Children Under the Age of 5 in the United States is 18.1%.