Zip Codes with the Lowest Poverty Level Among Children Under the Age of 5 in Kentucky
RELATED REPORTS & OPTIONS
Lowest Poverty | Child 0-5
Kentucky
Compare Zip Codes
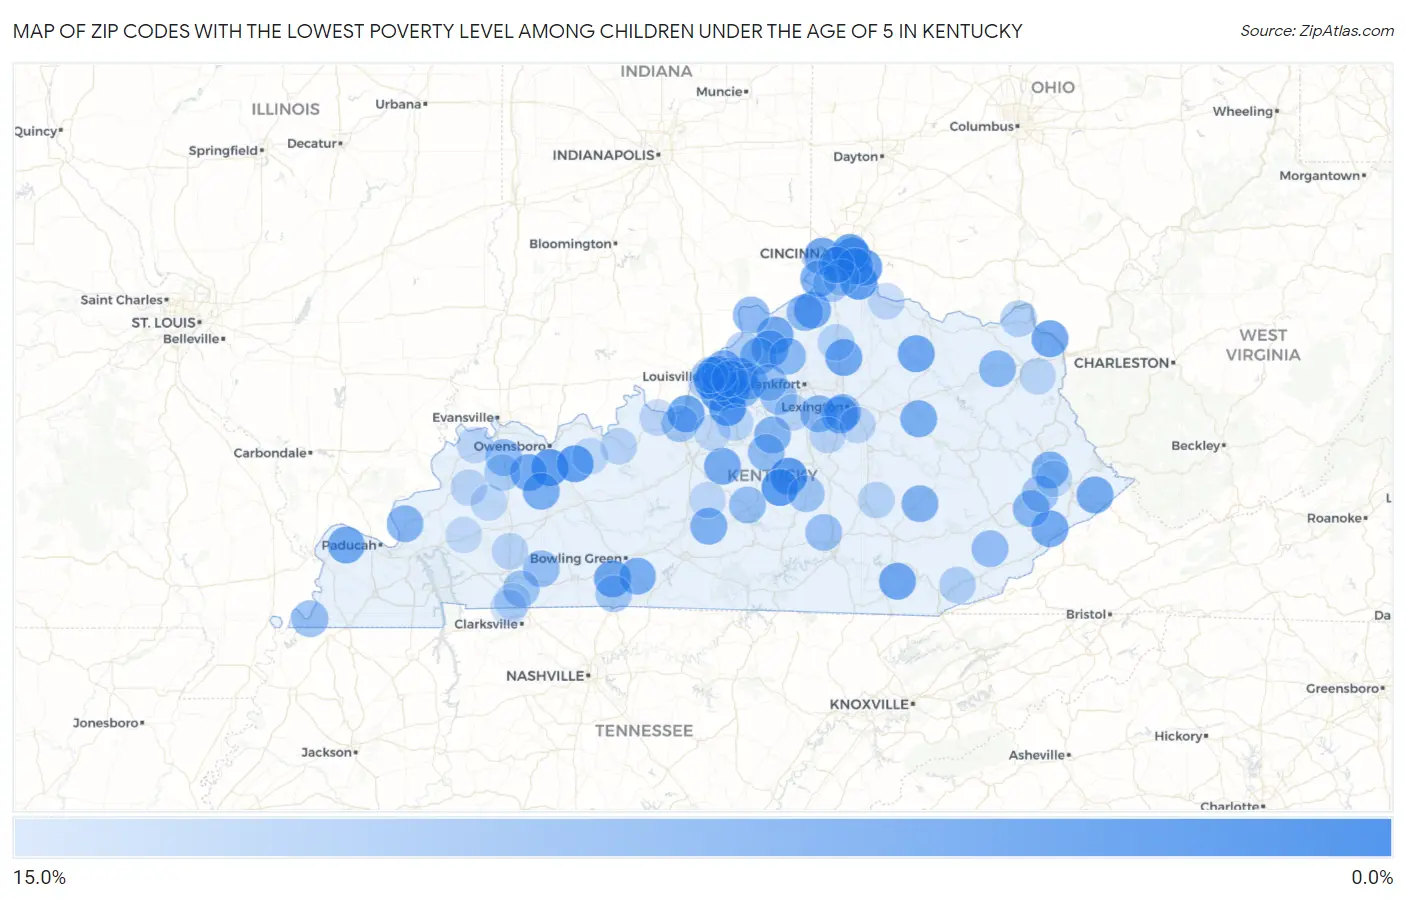
Map of Zip Codes with the Lowest Poverty Level Among Children Under the Age of 5 in Kentucky
15.0%
0.0%
Zip Codes with the Lowest Poverty Level Among Children Under the Age of 5 in Kentucky
| Zip Code | Child Poverty | vs State | vs National | |
| 1. | 40207 | 0.86% | 23.3%(-22.5)#1 | 18.1%(-17.2)#212 |
| 2. | 40328 | 1.4% | 23.3%(-21.9)#2 | 18.1%(-16.6)#501 |
| 3. | 40009 | 1.5% | 23.3%(-21.9)#3 | 18.1%(-16.6)#509 |
| 4. | 40228 | 1.6% | 23.3%(-21.7)#4 | 18.1%(-16.4)#605 |
| 5. | 42376 | 1.8% | 23.3%(-21.5)#5 | 18.1%(-16.3)#699 |
| 6. | 40047 | 1.9% | 23.3%(-21.5)#6 | 18.1%(-16.2)#747 |
| 7. | 41001 | 2.1% | 23.3%(-21.3)#7 | 18.1%(-16.0)#865 |
| 8. | 42378 | 2.2% | 23.3%(-21.1)#8 | 18.1%(-15.8)#976 |
| 9. | 40205 | 2.3% | 23.3%(-21.1)#9 | 18.1%(-15.8)#1,016 |
| 10. | 40245 | 2.4% | 23.3%(-20.9)#10 | 18.1%(-15.6)#1,136 |
| 11. | 41075 | 2.5% | 23.3%(-20.8)#11 | 18.1%(-15.6)#1,166 |
| 12. | 41059 | 2.6% | 23.3%(-20.7)#12 | 18.1%(-15.4)#1,243 |
| 13. | 42170 | 3.4% | 23.3%(-20.0)#13 | 18.1%(-14.7)#1,738 |
| 14. | 40177 | 3.4% | 23.3%(-19.9)#14 | 18.1%(-14.7)#1,753 |
| 15. | 41048 | 3.4% | 23.3%(-19.9)#15 | 18.1%(-14.6)#1,775 |
| 16. | 41017 | 3.5% | 23.3%(-19.8)#16 | 18.1%(-14.5)#1,844 |
| 17. | 41073 | 3.5% | 23.3%(-19.8)#17 | 18.1%(-14.5)#1,845 |
| 18. | 40514 | 3.6% | 23.3%(-19.7)#18 | 18.1%(-14.5)#1,878 |
| 19. | 41169 | 3.6% | 23.3%(-19.7)#19 | 18.1%(-14.4)#1,905 |
| 20. | 40370 | 3.6% | 23.3%(-19.7)#20 | 18.1%(-14.4)#1,907 |
| 21. | 40759 | 3.6% | 23.3%(-19.7)#21 | 18.1%(-14.4)#1,908 |
| 22. | 41039 | 3.7% | 23.3%(-19.7)#22 | 18.1%(-14.4)#1,931 |
| 23. | 41046 | 3.8% | 23.3%(-19.5)#23 | 18.1%(-14.2)#2,040 |
| 24. | 42053 | 4.0% | 23.3%(-19.3)#24 | 18.1%(-14.1)#2,155 |
| 25. | 42327 | 4.0% | 23.3%(-19.3)#25 | 18.1%(-14.0)#2,195 |
| 26. | 41840 | 4.0% | 23.3%(-19.3)#26 | 18.1%(-14.0)#2,201 |
| 27. | 40011 | 4.1% | 23.3%(-19.2)#27 | 18.1%(-13.9)#2,272 |
| 28. | 40050 | 4.3% | 23.3%(-19.0)#28 | 18.1%(-13.8)#2,410 |
| 29. | 41554 | 4.3% | 23.3%(-19.0)#29 | 18.1%(-13.7)#2,424 |
| 30. | 40051 | 4.3% | 23.3%(-19.0)#30 | 18.1%(-13.7)#2,432 |
| 31. | 40241 | 4.5% | 23.3%(-18.8)#31 | 18.1%(-13.6)#2,555 |
| 32. | 40223 | 4.6% | 23.3%(-18.7)#32 | 18.1%(-13.4)#2,659 |
| 33. | 41091 | 4.8% | 23.3%(-18.5)#33 | 18.1%(-13.3)#2,754 |
| 34. | 42122 | 4.8% | 23.3%(-18.5)#34 | 18.1%(-13.3)#2,763 |
| 35. | 40337 | 4.9% | 23.3%(-18.4)#35 | 18.1%(-13.2)#2,813 |
| 36. | 42350 | 4.9% | 23.3%(-18.4)#36 | 18.1%(-13.2)#2,821 |
| 37. | 40299 | 4.9% | 23.3%(-18.4)#37 | 18.1%(-13.1)#2,859 |
| 38. | 41601 | 5.1% | 23.3%(-18.2)#38 | 18.1%(-12.9)#2,994 |
| 39. | 42746 | 5.3% | 23.3%(-18.1)#39 | 18.1%(-12.8)#3,069 |
| 40. | 40486 | 5.5% | 23.3%(-17.8)#40 | 18.1%(-12.5)#3,262 |
| 41. | 40078 | 6.1% | 23.3%(-17.2)#41 | 18.1%(-12.0)#3,658 |
| 42. | 40383 | 6.2% | 23.3%(-17.1)#42 | 18.1%(-11.9)#3,734 |
| 43. | 41844 | 6.2% | 23.3%(-17.1)#43 | 18.1%(-11.8)#3,775 |
| 44. | 42081 | 6.3% | 23.3%(-17.0)#44 | 18.1%(-11.8)#3,813 |
| 45. | 41164 | 6.5% | 23.3%(-16.8)#45 | 18.1%(-11.5)#3,963 |
| 46. | 40068 | 6.6% | 23.3%(-16.8)#46 | 18.1%(-11.5)#3,977 |
| 47. | 40057 | 6.8% | 23.3%(-16.6)#47 | 18.1%(-11.3)#4,112 |
| 48. | 41086 | 6.9% | 23.3%(-16.4)#48 | 18.1%(-11.1)#4,236 |
| 49. | 40503 | 6.9% | 23.3%(-16.4)#49 | 18.1%(-11.1)#4,245 |
| 50. | 40023 | 7.0% | 23.3%(-16.3)#50 | 18.1%(-11.0)#4,309 |
| 51. | 40045 | 7.1% | 23.3%(-16.2)#51 | 18.1%(-10.9)#4,364 |
| 52. | 40069 | 7.3% | 23.3%(-16.0)#52 | 18.1%(-10.8)#4,477 |
| 53. | 40067 | 7.4% | 23.3%(-15.9)#53 | 18.1%(-10.7)#4,537 |
| 54. | 42452 | 7.6% | 23.3%(-15.7)#54 | 18.1%(-10.5)#4,666 |
| 55. | 41076 | 7.6% | 23.3%(-15.7)#55 | 18.1%(-10.4)#4,698 |
| 56. | 41777 | 7.7% | 23.3%(-15.6)#56 | 18.1%(-10.4)#4,730 |
| 57. | 42220 | 7.8% | 23.3%(-15.5)#57 | 18.1%(-10.3)#4,782 |
| 58. | 42050 | 7.9% | 23.3%(-15.4)#58 | 18.1%(-10.2)#4,843 |
| 59. | 42718 | 7.9% | 23.3%(-15.4)#59 | 18.1%(-10.1)#4,871 |
| 60. | 42553 | 8.1% | 23.3%(-15.3)#60 | 18.1%(-10.0)#4,961 |
| 61. | 40076 | 8.2% | 23.3%(-15.1)#61 | 18.1%(-9.82)#5,072 |
| 62. | 40065 | 8.3% | 23.3%(-15.0)#62 | 18.1%(-9.77)#5,095 |
| 63. | 40437 | 8.7% | 23.3%(-14.6)#63 | 18.1%(-9.34)#5,419 |
| 64. | 42266 | 8.7% | 23.3%(-14.6)#64 | 18.1%(-9.33)#5,428 |
| 65. | 41666 | 8.8% | 23.3%(-14.5)#65 | 18.1%(-9.29)#5,449 |
| 66. | 40121 | 8.9% | 23.3%(-14.4)#66 | 18.1%(-9.15)#5,545 |
| 67. | 42134 | 9.0% | 23.3%(-14.3)#67 | 18.1%(-9.09)#5,601 |
| 68. | 40220 | 9.3% | 23.3%(-14.0)#68 | 18.1%(-8.72)#5,847 |
| 69. | 40222 | 9.5% | 23.3%(-13.8)#69 | 18.1%(-8.59)#5,927 |
| 70. | 41094 | 9.5% | 23.3%(-13.8)#70 | 18.1%(-8.56)#5,946 |
| 71. | 42455 | 10.2% | 23.3%(-13.1)#71 | 18.1%(-7.88)#6,372 |
| 72. | 40031 | 10.3% | 23.3%(-13.0)#72 | 18.1%(-7.75)#6,456 |
| 73. | 41051 | 10.4% | 23.3%(-12.9)#73 | 18.1%(-7.63)#6,515 |
| 74. | 40845 | 10.5% | 23.3%(-12.8)#74 | 18.1%(-7.54)#6,575 |
| 75. | 41175 | 10.6% | 23.3%(-12.7)#75 | 18.1%(-7.42)#6,640 |
| 76. | 41010 | 11.0% | 23.3%(-12.3)#76 | 18.1%(-7.05)#6,851 |
| 77. | 40013 | 11.0% | 23.3%(-12.3)#77 | 18.1%(-7.01)#6,866 |
| 78. | 40460 | 11.1% | 23.3%(-12.2)#78 | 18.1%(-6.95)#6,905 |
| 79. | 41018 | 11.2% | 23.3%(-12.2)#79 | 18.1%(-6.91)#6,954 |
| 80. | 40143 | 11.3% | 23.3%(-12.0)#80 | 18.1%(-6.77)#7,024 |
| 81. | 40390 | 11.4% | 23.3%(-12.0)#81 | 18.1%(-6.69)#7,079 |
| 82. | 40342 | 11.5% | 23.3%(-11.9)#82 | 18.1%(-6.60)#7,127 |
| 83. | 42217 | 11.5% | 23.3%(-11.9)#83 | 18.1%(-6.59)#7,130 |
| 84. | 40217 | 11.5% | 23.3%(-11.8)#84 | 18.1%(-6.58)#7,138 |
| 85. | 42404 | 11.6% | 23.3%(-11.8)#85 | 18.1%(-6.50)#7,184 |
| 86. | 41132 | 11.7% | 23.3%(-11.7)#86 | 18.1%(-6.40)#7,249 |
| 87. | 40108 | 11.7% | 23.3%(-11.6)#87 | 18.1%(-6.34)#7,288 |
| 88. | 42406 | 11.8% | 23.3%(-11.6)#88 | 18.1%(-6.30)#7,306 |
| 89. | 40515 | 11.8% | 23.3%(-11.5)#89 | 18.1%(-6.23)#7,354 |
| 90. | 41043 | 11.9% | 23.3%(-11.4)#90 | 18.1%(-6.12)#7,423 |
| 91. | 42757 | 12.0% | 23.3%(-11.3)#91 | 18.1%(-6.04)#7,481 |
| 92. | 41615 | 12.0% | 23.3%(-11.3)#92 | 18.1%(-6.01)#7,496 |
| 93. | 42368 | 12.1% | 23.3%(-11.3)#93 | 18.1%(-5.99)#7,507 |
| 94. | 40206 | 12.1% | 23.3%(-11.2)#94 | 18.1%(-5.98)#7,510 |
| 95. | 42262 | 12.1% | 23.3%(-11.2)#95 | 18.1%(-5.96)#7,525 |
| 96. | 42441 | 12.3% | 23.3%(-11.0)#96 | 18.1%(-5.73)#7,652 |
| 97. | 40150 | 12.4% | 23.3%(-11.0)#97 | 18.1%(-5.71)#7,667 |
| 98. | 40243 | 12.4% | 23.3%(-11.0)#98 | 18.1%(-5.70)#7,680 |
| 99. | 42223 | 12.5% | 23.3%(-10.8)#99 | 18.1%(-5.57)#7,741 |
| 100. | 42445 | 12.5% | 23.3%(-10.8)#100 | 18.1%(-5.54)#7,794 |
Common Questions
What are the Top 10 Zip Codes with the Lowest Poverty Level Among Children Under the Age of 5 in Kentucky?
Top 10 Zip Codes with the Lowest Poverty Level Among Children Under the Age of 5 in Kentucky are:
What zip code has the Lowest Poverty Level Among Children Under the Age of 5 in Kentucky?
40207 has the Lowest Poverty Level Among Children Under the Age of 5 in Kentucky with 0.86%.
What is the Poverty Level Among Children Under the Age of 5 in the State of Kentucky?
Poverty Level Among Children Under the Age of 5 in Kentucky is 23.3%.
What is the Poverty Level Among Children Under the Age of 5 in the United States?
Poverty Level Among Children Under the Age of 5 in the United States is 18.1%.