Zip Codes with the Lowest Poverty Level Among Children Under the Age of 5 in Puerto Rico
RELATED REPORTS & OPTIONS
Lowest Poverty | Child 0-5
Puerto Rico
Compare Zip Codes
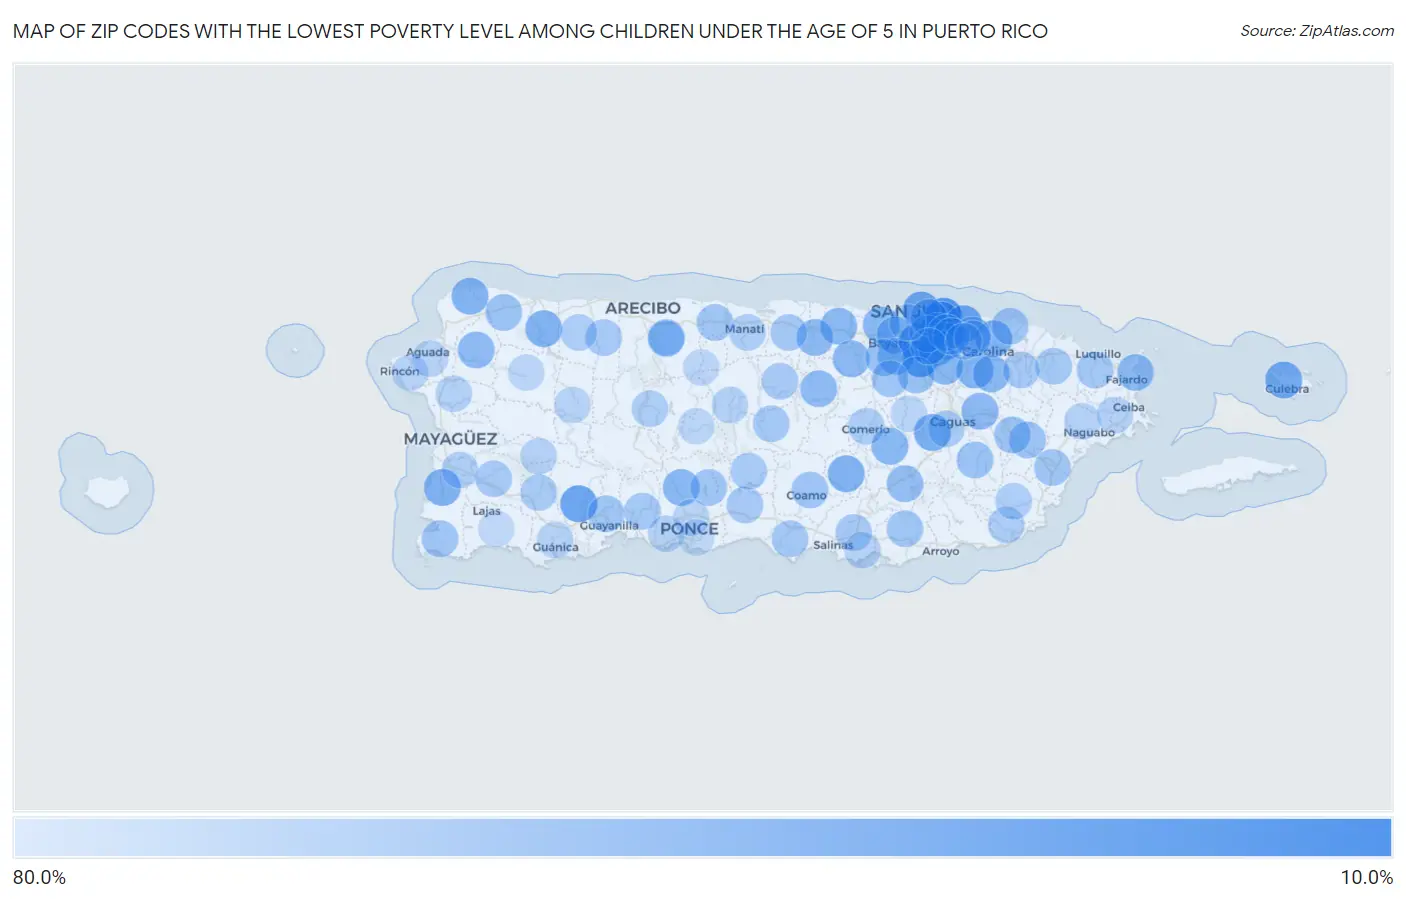
Map of Zip Codes with the Lowest Poverty Level Among Children Under the Age of 5 in Puerto Rico
80.0%
10.0%
Zip Codes with the Lowest Poverty Level Among Children Under the Age of 5 in Puerto Rico
| Zip Code | Child Poverty | vs State | vs National | |
| 1. | 00911 | 16.3% | 61.4%(-45.1)#1 | 18.1%(-1.81)#9,884 |
| 2. | 00966 | 21.0% | 61.4%(-40.4)#2 | 18.1%(+2.90)#12,057 |
| 3. | 00969 | 23.0% | 61.4%(-38.4)#3 | 18.1%(+4.89)#12,888 |
| 4. | 00912 | 25.3% | 61.4%(-36.1)#4 | 18.1%(+7.20)#13,775 |
| 5. | 00698 | 30.6% | 61.4%(-30.8)#5 | 18.1%(+12.5)#15,477 |
| 6. | 00901 | 30.9% | 61.4%(-30.5)#6 | 18.1%(+12.9)#15,560 |
| 7. | 00979 | 31.3% | 61.4%(-30.1)#7 | 18.1%(+13.3)#15,677 |
| 8. | 00918 | 32.3% | 61.4%(-29.1)#8 | 18.1%(+14.2)#15,898 |
| 9. | 00775 | 34.6% | 61.4%(-26.8)#9 | 18.1%(+16.6)#16,515 |
| 10. | 00727 | 37.7% | 61.4%(-23.7)#10 | 18.1%(+19.6)#17,210 |
| 11. | 00985 | 40.1% | 61.4%(-21.3)#11 | 18.1%(+22.1)#17,683 |
| 12. | 00705 | 40.8% | 61.4%(-20.6)#12 | 18.1%(+22.7)#17,794 |
| 13. | 00623 | 41.6% | 61.4%(-19.8)#13 | 18.1%(+23.5)#17,936 |
| 14. | 00925 | 42.1% | 61.4%(-19.3)#14 | 18.1%(+24.0)#18,025 |
| 15. | 00678 | 42.3% | 61.4%(-19.1)#15 | 18.1%(+24.2)#18,059 |
| 16. | 00690 | 44.1% | 61.4%(-17.3)#16 | 18.1%(+26.0)#18,347 |
| 17. | 00976 | 44.3% | 61.4%(-17.1)#17 | 18.1%(+26.2)#18,371 |
| 18. | 00927 | 45.9% | 61.4%(-15.5)#18 | 18.1%(+27.8)#18,602 |
| 19. | 00987 | 46.1% | 61.4%(-15.2)#19 | 18.1%(+28.1)#18,634 |
| 20. | 00926 | 46.2% | 61.4%(-15.2)#20 | 18.1%(+28.1)#18,650 |
| 21. | 00731 | 46.4% | 61.4%(-15.0)#21 | 18.1%(+28.3)#18,680 |
| 22. | 00739 | 46.5% | 61.4%(-14.8)#22 | 18.1%(+28.5)#18,697 |
| 23. | 00949 | 46.7% | 61.4%(-14.7)#23 | 18.1%(+28.7)#18,715 |
| 24. | 00646 | 47.5% | 61.4%(-13.9)#24 | 18.1%(+29.4)#18,800 |
| 25. | 00778 | 48.6% | 61.4%(-12.8)#25 | 18.1%(+30.6)#18,931 |
| 26. | 00953 | 48.9% | 61.4%(-12.5)#26 | 18.1%(+30.8)#18,966 |
| 27. | 00692 | 49.4% | 61.4%(-12.0)#27 | 18.1%(+31.3)#19,021 |
| 28. | 00676 | 49.9% | 61.4%(-11.5)#28 | 18.1%(+31.8)#19,052 |
| 29. | 00961 | 50.8% | 61.4%(-10.6)#29 | 18.1%(+32.7)#19,229 |
| 30. | 00783 | 51.1% | 61.4%(-10.3)#30 | 18.1%(+33.0)#19,255 |
| 31. | 00959 | 52.2% | 61.4%(-9.14)#31 | 18.1%(+34.2)#19,348 |
| 32. | 00920 | 52.4% | 61.4%(-9.03)#32 | 18.1%(+34.3)#19,357 |
| 33. | 00907 | 52.8% | 61.4%(-8.63)#33 | 18.1%(+34.7)#19,398 |
| 34. | 00736 | 54.2% | 61.4%(-7.23)#34 | 18.1%(+36.1)#19,543 |
| 35. | 00983 | 55.0% | 61.4%(-6.34)#35 | 18.1%(+37.0)#19,607 |
| 36. | 00957 | 56.0% | 61.4%(-5.42)#36 | 18.1%(+37.9)#19,681 |
| 37. | 00971 | 56.0% | 61.4%(-5.38)#37 | 18.1%(+37.9)#19,686 |
| 38. | 00616 | 56.2% | 61.4%(-5.19)#38 | 18.1%(+38.1)#19,699 |
| 39. | 00771 | 57.4% | 61.4%(-4.03)#39 | 18.1%(+39.3)#19,800 |
| 40. | 00662 | 58.0% | 61.4%(-3.40)#40 | 18.1%(+39.9)#19,844 |
| 41. | 00754 | 58.0% | 61.4%(-3.34)#41 | 18.1%(+40.0)#19,849 |
| 42. | 00777 | 59.2% | 61.4%(-2.21)#42 | 18.1%(+41.1)#19,918 |
| 43. | 00956 | 59.6% | 61.4%(-1.74)#43 | 18.1%(+41.6)#19,954 |
| 44. | 00769 | 59.9% | 61.4%(-1.49)#44 | 18.1%(+41.8)#19,963 |
| 45. | 00622 | 60.0% | 61.4%(-1.39)#45 | 18.1%(+41.9)#19,965 |
| 46. | 00772 | 60.7% | 61.4%(-0.679)#46 | 18.1%(+42.6)#20,030 |
| 47. | 00784 | 61.0% | 61.4%(-0.420)#47 | 18.1%(+42.9)#20,047 |
| 48. | 00656 | 61.4% | 61.4%(-0.021)#48 | 18.1%(+43.3)#20,067 |
| 49. | 00791 | 61.5% | 61.4%(+0.083)#49 | 18.1%(+43.4)#20,071 |
| 50. | 00617 | 61.6% | 61.4%(+0.218)#50 | 18.1%(+43.5)#20,088 |
| 51. | 00780 | 61.8% | 61.4%(+0.438)#51 | 18.1%(+43.8)#20,104 |
| 52. | 00757 | 62.9% | 61.4%(+1.48)#52 | 18.1%(+44.8)#20,167 |
| 53. | 00693 | 63.4% | 61.4%(+1.98)#53 | 18.1%(+45.3)#20,192 |
| 54. | 00917 | 63.8% | 61.4%(+2.42)#54 | 18.1%(+45.7)#20,211 |
| 55. | 00624 | 63.9% | 61.4%(+2.51)#55 | 18.1%(+45.8)#20,216 |
| 56. | 00745 | 64.3% | 61.4%(+2.87)#56 | 18.1%(+46.2)#20,238 |
| 57. | 00773 | 64.3% | 61.4%(+2.94)#57 | 18.1%(+46.3)#20,250 |
| 58. | 00720 | 64.3% | 61.4%(+2.95)#58 | 18.1%(+46.3)#20,251 |
| 59. | 00751 | 64.8% | 61.4%(+3.41)#59 | 18.1%(+46.7)#20,277 |
| 60. | 00729 | 64.9% | 61.4%(+3.52)#60 | 18.1%(+46.8)#20,283 |
| 61. | 00659 | 65.0% | 61.4%(+3.64)#61 | 18.1%(+47.0)#20,294 |
| 62. | 00795 | 65.1% | 61.4%(+3.71)#62 | 18.1%(+47.0)#20,297 |
| 63. | 00687 | 65.1% | 61.4%(+3.71)#63 | 18.1%(+47.0)#20,298 |
| 64. | 00683 | 65.6% | 61.4%(+4.18)#64 | 18.1%(+47.5)#20,312 |
| 65. | 00923 | 65.9% | 61.4%(+4.47)#65 | 18.1%(+47.8)#20,322 |
| 66. | 00766 | 65.9% | 61.4%(+4.55)#66 | 18.1%(+47.9)#20,327 |
| 67. | 00725 | 66.0% | 61.4%(+4.58)#67 | 18.1%(+47.9)#20,329 |
| 68. | 00921 | 66.4% | 61.4%(+4.98)#68 | 18.1%(+48.3)#20,347 |
| 69. | 00982 | 66.5% | 61.4%(+5.11)#69 | 18.1%(+48.4)#20,349 |
| 70. | 00637 | 67.0% | 61.4%(+5.62)#70 | 18.1%(+48.9)#20,402 |
| 71. | 00782 | 67.5% | 61.4%(+6.13)#71 | 18.1%(+49.5)#20,418 |
| 72. | 00707 | 67.7% | 61.4%(+6.30)#72 | 18.1%(+49.6)#20,430 |
| 73. | 00627 | 67.8% | 61.4%(+6.36)#73 | 18.1%(+49.7)#20,433 |
| 74. | 00641 | 67.8% | 61.4%(+6.41)#74 | 18.1%(+49.7)#20,437 |
| 75. | 00612 | 67.9% | 61.4%(+6.53)#75 | 18.1%(+49.9)#20,441 |
| 76. | 00674 | 68.3% | 61.4%(+6.95)#76 | 18.1%(+50.3)#20,453 |
| 77. | 00740 | 68.8% | 61.4%(+7.41)#77 | 18.1%(+50.7)#20,473 |
| 78. | 00767 | 69.5% | 61.4%(+8.15)#78 | 18.1%(+51.5)#20,501 |
| 79. | 00660 | 70.4% | 61.4%(+9.04)#79 | 18.1%(+52.4)#20,536 |
| 80. | 00610 | 72.0% | 61.4%(+10.6)#80 | 18.1%(+53.9)#20,585 |
| 81. | 00728 | 72.3% | 61.4%(+10.9)#81 | 18.1%(+54.2)#20,598 |
| 82. | 00718 | 72.3% | 61.4%(+10.9)#82 | 18.1%(+54.2)#20,600 |
| 83. | 00606 | 72.5% | 61.4%(+11.2)#83 | 18.1%(+54.5)#20,607 |
| 84. | 00735 | 73.1% | 61.4%(+11.7)#84 | 18.1%(+55.1)#20,626 |
| 85. | 00638 | 73.2% | 61.4%(+11.8)#85 | 18.1%(+55.2)#20,630 |
| 86. | 00704 | 73.4% | 61.4%(+12.0)#86 | 18.1%(+55.3)#20,638 |
| 87. | 00677 | 73.4% | 61.4%(+12.0)#87 | 18.1%(+55.3)#20,639 |
| 88. | 00924 | 73.7% | 61.4%(+12.3)#88 | 18.1%(+55.6)#20,647 |
| 89. | 00653 | 73.9% | 61.4%(+12.5)#89 | 18.1%(+55.9)#20,661 |
| 90. | 00669 | 74.1% | 61.4%(+12.8)#90 | 18.1%(+56.1)#20,671 |
| 91. | 00602 | 74.5% | 61.4%(+13.2)#91 | 18.1%(+56.5)#20,689 |
| 92. | 00730 | 75.8% | 61.4%(+14.4)#92 | 18.1%(+57.7)#20,736 |
| 93. | 00738 | 75.8% | 61.4%(+14.4)#93 | 18.1%(+57.7)#20,738 |
| 94. | 00962 | 75.9% | 61.4%(+14.5)#94 | 18.1%(+57.8)#20,741 |
| 95. | 00650 | 76.0% | 61.4%(+14.6)#95 | 18.1%(+57.9)#20,744 |
| 96. | 00664 | 76.3% | 61.4%(+14.9)#96 | 18.1%(+58.2)#20,751 |
| 97. | 00685 | 76.3% | 61.4%(+14.9)#97 | 18.1%(+58.3)#20,755 |
| 98. | 00703 | 76.9% | 61.4%(+15.5)#98 | 18.1%(+58.9)#20,771 |
| 99. | 00716 | 78.6% | 61.4%(+17.2)#99 | 18.1%(+60.5)#20,816 |
| 100. | 00667 | 79.0% | 61.4%(+17.6)#100 | 18.1%(+60.9)#20,828 |
1
2Common Questions
What are the Top 10 Zip Codes with the Lowest Poverty Level Among Children Under the Age of 5 in Puerto Rico?
Top 10 Zip Codes with the Lowest Poverty Level Among Children Under the Age of 5 in Puerto Rico are:
What zip code has the Lowest Poverty Level Among Children Under the Age of 5 in Puerto Rico?
00911 has the Lowest Poverty Level Among Children Under the Age of 5 in Puerto Rico with 16.3%.
What is the Poverty Level Among Children Under the Age of 5 in the State of Puerto Rico?
Poverty Level Among Children Under the Age of 5 in Puerto Rico is 61.4%.
What is the Poverty Level Among Children Under the Age of 5 in the United States?
Poverty Level Among Children Under the Age of 5 in the United States is 18.1%.