Zip Codes with the Lowest Poverty Level Among Children Under the Age of 5 in Alabama
RELATED REPORTS & OPTIONS
Lowest Poverty | Child 0-5
Alabama
Compare Zip Codes
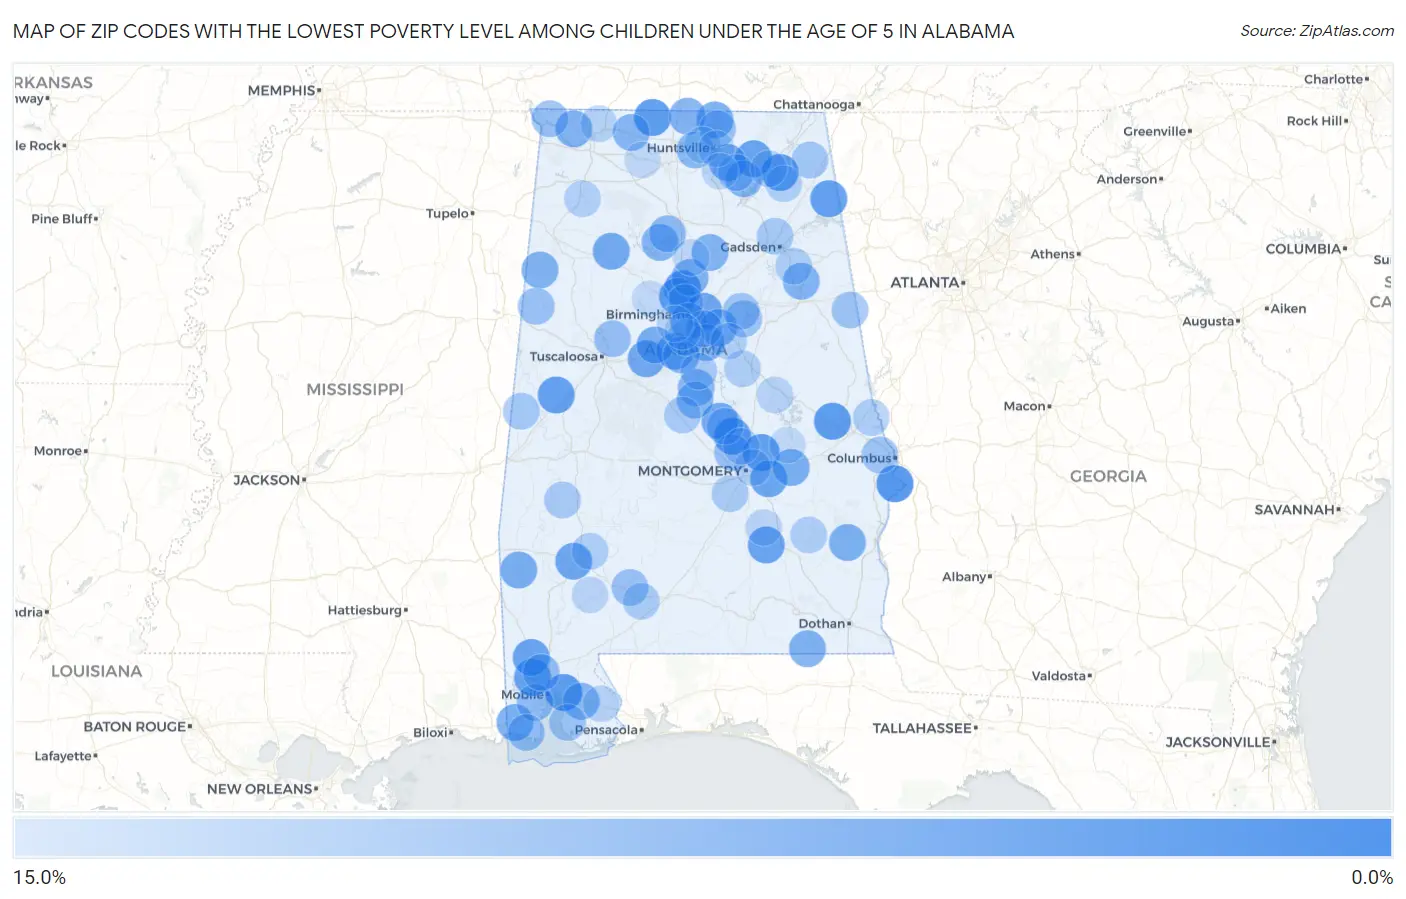
Map of Zip Codes with the Lowest Poverty Level Among Children Under the Age of 5 in Alabama
15.0%
0.0%
Zip Codes with the Lowest Poverty Level Among Children Under the Age of 5 in Alabama
| Zip Code | Child Poverty | vs State | vs National | |
| 1. | 36856 | 0.17% | 25.1%(-25.0)#1 | 18.1%(-17.9)#7 |
| 2. | 35071 | 0.66% | 25.1%(-24.5)#2 | 18.1%(-17.4)#113 |
| 3. | 35647 | 0.76% | 25.1%(-24.4)#3 | 18.1%(-17.3)#159 |
| 4. | 36879 | 0.79% | 25.1%(-24.3)#4 | 18.1%(-17.3)#166 |
| 5. | 36527 | 0.79% | 25.1%(-24.3)#5 | 18.1%(-17.3)#169 |
| 6. | 35771 | 0.87% | 25.1%(-24.3)#6 | 18.1%(-17.2)#218 |
| 7. | 36022 | 1.1% | 25.1%(-24.0)#7 | 18.1%(-17.0)#326 |
| 8. | 36093 | 1.3% | 25.1%(-23.8)#8 | 18.1%(-16.8)#418 |
| 9. | 35462 | 1.4% | 25.1%(-23.8)#9 | 18.1%(-16.7)#453 |
| 10. | 35973 | 1.4% | 25.1%(-23.7)#10 | 18.1%(-16.6)#488 |
| 11. | 36613 | 1.5% | 25.1%(-23.6)#11 | 18.1%(-16.5)#548 |
| 12. | 35117 | 1.8% | 25.1%(-23.3)#12 | 18.1%(-16.3)#708 |
| 13. | 36521 | 2.0% | 25.1%(-23.1)#13 | 18.1%(-16.0)#858 |
| 14. | 35776 | 2.1% | 25.1%(-23.0)#14 | 18.1%(-15.9)#912 |
| 15. | 36035 | 2.2% | 25.1%(-23.0)#15 | 18.1%(-15.9)#952 |
| 16. | 36064 | 2.3% | 25.1%(-22.9)#16 | 18.1%(-15.8)#1,017 |
| 17. | 35210 | 2.5% | 25.1%(-22.6)#17 | 18.1%(-15.6)#1,168 |
| 18. | 36451 | 2.5% | 25.1%(-22.6)#18 | 18.1%(-15.5)#1,193 |
| 19. | 35188 | 2.8% | 25.1%(-22.4)#19 | 18.1%(-15.3)#1,339 |
| 20. | 35578 | 2.9% | 25.1%(-22.2)#20 | 18.1%(-15.2)#1,435 |
| 21. | 36091 | 3.0% | 25.1%(-22.1)#21 | 18.1%(-15.1)#1,505 |
| 22. | 35763 | 3.1% | 25.1%(-22.0)#22 | 18.1%(-14.9)#1,583 |
| 23. | 35080 | 3.2% | 25.1%(-22.0)#23 | 18.1%(-14.9)#1,610 |
| 24. | 35750 | 3.3% | 25.1%(-21.8)#24 | 18.1%(-14.7)#1,717 |
| 25. | 35111 | 3.5% | 25.1%(-21.6)#25 | 18.1%(-14.6)#1,827 |
| 26. | 36558 | 3.5% | 25.1%(-21.6)#26 | 18.1%(-14.5)#1,851 |
| 27. | 36541 | 3.8% | 25.1%(-21.4)#27 | 18.1%(-14.3)#2,004 |
| 28. | 36075 | 3.9% | 25.1%(-21.2)#28 | 18.1%(-14.2)#2,091 |
| 29. | 35209 | 3.9% | 25.1%(-21.2)#29 | 18.1%(-14.1)#2,118 |
| 30. | 35147 | 4.0% | 25.1%(-21.1)#30 | 18.1%(-14.1)#2,165 |
| 31. | 36016 | 4.0% | 25.1%(-21.1)#31 | 18.1%(-14.1)#2,167 |
| 32. | 36314 | 4.2% | 25.1%(-21.0)#32 | 18.1%(-13.9)#2,315 |
| 33. | 35043 | 4.3% | 25.1%(-20.8)#33 | 18.1%(-13.7)#2,426 |
| 34. | 35739 | 4.4% | 25.1%(-20.7)#34 | 18.1%(-13.7)#2,470 |
| 35. | 35091 | 4.4% | 25.1%(-20.7)#35 | 18.1%(-13.7)#2,481 |
| 36. | 35586 | 4.4% | 25.1%(-20.7)#36 | 18.1%(-13.6)#2,495 |
| 37. | 35633 | 4.5% | 25.1%(-20.7)#37 | 18.1%(-13.6)#2,534 |
| 38. | 35049 | 4.6% | 25.1%(-20.5)#38 | 18.1%(-13.5)#2,616 |
| 39. | 36277 | 4.8% | 25.1%(-20.3)#39 | 18.1%(-13.3)#2,753 |
| 40. | 35747 | 4.9% | 25.1%(-20.2)#40 | 18.1%(-13.1)#2,843 |
| 41. | 35053 | 5.0% | 25.1%(-20.1)#41 | 18.1%(-13.1)#2,902 |
| 42. | 35652 | 5.1% | 25.1%(-20.0)#42 | 18.1%(-13.0)#2,974 |
| 43. | 35085 | 5.1% | 25.1%(-20.0)#43 | 18.1%(-12.9)#3,001 |
| 44. | 36551 | 5.2% | 25.1%(-20.0)#44 | 18.1%(-12.9)#3,012 |
| 45. | 35114 | 5.2% | 25.1%(-19.9)#45 | 18.1%(-12.8)#3,046 |
| 46. | 35171 | 5.2% | 25.1%(-19.9)#46 | 18.1%(-12.8)#3,055 |
| 47. | 35758 | 5.3% | 25.1%(-19.8)#47 | 18.1%(-12.7)#3,109 |
| 48. | 35057 | 5.8% | 25.1%(-19.4)#48 | 18.1%(-12.3)#3,432 |
| 49. | 36693 | 6.2% | 25.1%(-18.9)#49 | 18.1%(-11.9)#3,727 |
| 50. | 36571 | 6.3% | 25.1%(-18.9)#50 | 18.1%(-11.8)#3,794 |
| 51. | 36509 | 6.3% | 25.1%(-18.8)#51 | 18.1%(-11.7)#3,836 |
| 52. | 35406 | 6.5% | 25.1%(-18.6)#52 | 18.1%(-11.5)#3,962 |
| 53. | 36460 | 6.8% | 25.1%(-18.3)#53 | 18.1%(-11.2)#4,174 |
| 54. | 35242 | 6.9% | 25.1%(-18.2)#54 | 18.1%(-11.2)#4,202 |
| 55. | 35677 | 6.9% | 25.1%(-18.2)#55 | 18.1%(-11.2)#4,207 |
| 56. | 36066 | 6.9% | 25.1%(-18.2)#56 | 18.1%(-11.1)#4,234 |
| 57. | 35759 | 7.0% | 25.1%(-18.2)#57 | 18.1%(-11.1)#4,265 |
| 58. | 35576 | 7.0% | 25.1%(-18.1)#58 | 18.1%(-11.1)#4,287 |
| 59. | 35054 | 7.0% | 25.1%(-18.1)#59 | 18.1%(-11.1)#4,291 |
| 60. | 36532 | 7.3% | 25.1%(-17.8)#60 | 18.1%(-10.8)#4,478 |
| 61. | 36051 | 7.4% | 25.1%(-17.7)#61 | 18.1%(-10.7)#4,544 |
| 62. | 36870 | 7.5% | 25.1%(-17.7)#62 | 18.1%(-10.6)#4,578 |
| 63. | 36273 | 7.5% | 25.1%(-17.6)#63 | 18.1%(-10.5)#4,616 |
| 64. | 35128 | 7.7% | 25.1%(-17.4)#64 | 18.1%(-10.3)#4,752 |
| 65. | 35760 | 7.7% | 25.1%(-17.4)#65 | 18.1%(-10.3)#4,768 |
| 66. | 35978 | 7.9% | 25.1%(-17.2)#66 | 18.1%(-10.2)#4,851 |
| 67. | 35459 | 8.1% | 25.1%(-17.0)#67 | 18.1%(-9.95)#4,983 |
| 68. | 35954 | 8.3% | 25.1%(-16.8)#68 | 18.1%(-9.73)#5,110 |
| 69. | 35040 | 8.4% | 25.1%(-16.7)#69 | 18.1%(-9.62)#5,215 |
| 70. | 36750 | 8.6% | 25.1%(-16.5)#70 | 18.1%(-9.46)#5,329 |
| 71. | 36782 | 8.6% | 25.1%(-16.5)#71 | 18.1%(-9.44)#5,347 |
| 72. | 36475 | 8.7% | 25.1%(-16.4)#72 | 18.1%(-9.33)#5,429 |
| 73. | 36043 | 8.8% | 25.1%(-16.3)#73 | 18.1%(-9.28)#5,457 |
| 74. | 36005 | 8.9% | 25.1%(-16.2)#74 | 18.1%(-9.17)#5,533 |
| 75. | 36854 | 8.9% | 25.1%(-16.2)#75 | 18.1%(-9.13)#5,569 |
| 76. | 35151 | 8.9% | 25.1%(-16.2)#76 | 18.1%(-9.12)#5,571 |
| 77. | 36436 | 9.0% | 25.1%(-16.2)#77 | 18.1%(-9.11)#5,585 |
| 78. | 35068 | 9.0% | 25.1%(-16.2)#78 | 18.1%(-9.10)#5,594 |
| 79. | 36279 | 9.0% | 25.1%(-16.1)#79 | 18.1%(-9.04)#5,631 |
| 80. | 35971 | 9.1% | 25.1%(-16.0)#80 | 18.1%(-8.91)#5,719 |
| 81. | 35769 | 9.3% | 25.1%(-15.8)#81 | 18.1%(-8.77)#5,809 |
| 82. | 35581 | 9.4% | 25.1%(-15.8)#82 | 18.1%(-8.70)#5,858 |
| 83. | 35078 | 9.4% | 25.1%(-15.7)#83 | 18.1%(-8.63)#5,902 |
| 84. | 36109 | 9.5% | 25.1%(-15.6)#84 | 18.1%(-8.55)#5,950 |
| 85. | 35244 | 9.6% | 25.1%(-15.5)#85 | 18.1%(-8.48)#6,023 |
| 86. | 35634 | 9.7% | 25.1%(-15.4)#86 | 18.1%(-8.39)#6,061 |
| 87. | 35806 | 9.7% | 25.1%(-15.4)#87 | 18.1%(-8.34)#6,093 |
| 88. | 36567 | 9.8% | 25.1%(-15.4)#88 | 18.1%(-8.31)#6,108 |
| 89. | 35089 | 9.8% | 25.1%(-15.4)#89 | 18.1%(-8.31)#6,111 |
| 90. | 36025 | 10.1% | 25.1%(-15.1)#90 | 18.1%(-8.00)#6,302 |
| 91. | 35228 | 10.1% | 25.1%(-15.0)#91 | 18.1%(-7.96)#6,330 |
| 92. | 36540 | 10.2% | 25.1%(-14.9)#92 | 18.1%(-7.88)#6,371 |
| 93. | 36036 | 10.3% | 25.1%(-14.8)#93 | 18.1%(-7.72)#6,465 |
| 94. | 35801 | 10.4% | 25.1%(-14.7)#94 | 18.1%(-7.67)#6,502 |
| 95. | 35079 | 10.4% | 25.1%(-14.7)#95 | 18.1%(-7.63)#6,514 |
| 96. | 35803 | 10.7% | 25.1%(-14.4)#96 | 18.1%(-7.32)#6,697 |
| 97. | 35130 | 10.8% | 25.1%(-14.3)#97 | 18.1%(-7.25)#6,722 |
| 98. | 35226 | 10.8% | 25.1%(-14.3)#98 | 18.1%(-7.25)#6,728 |
| 99. | 36078 | 10.8% | 25.1%(-14.3)#99 | 18.1%(-7.22)#6,744 |
| 100. | 35643 | 10.9% | 25.1%(-14.2)#100 | 18.1%(-7.15)#6,780 |
Common Questions
What are the Top 10 Zip Codes with the Lowest Poverty Level Among Children Under the Age of 5 in Alabama?
Top 10 Zip Codes with the Lowest Poverty Level Among Children Under the Age of 5 in Alabama are:
What zip code has the Lowest Poverty Level Among Children Under the Age of 5 in Alabama?
36856 has the Lowest Poverty Level Among Children Under the Age of 5 in Alabama with 0.17%.
What is the Poverty Level Among Children Under the Age of 5 in the State of Alabama?
Poverty Level Among Children Under the Age of 5 in Alabama is 25.1%.
What is the Poverty Level Among Children Under the Age of 5 in the United States?
Poverty Level Among Children Under the Age of 5 in the United States is 18.1%.