Zip Codes with the Lowest Poverty Level Among Children Under the Age of 5 in California
RELATED REPORTS & OPTIONS
Lowest Poverty | Child 0-5
California
Compare Zip Codes
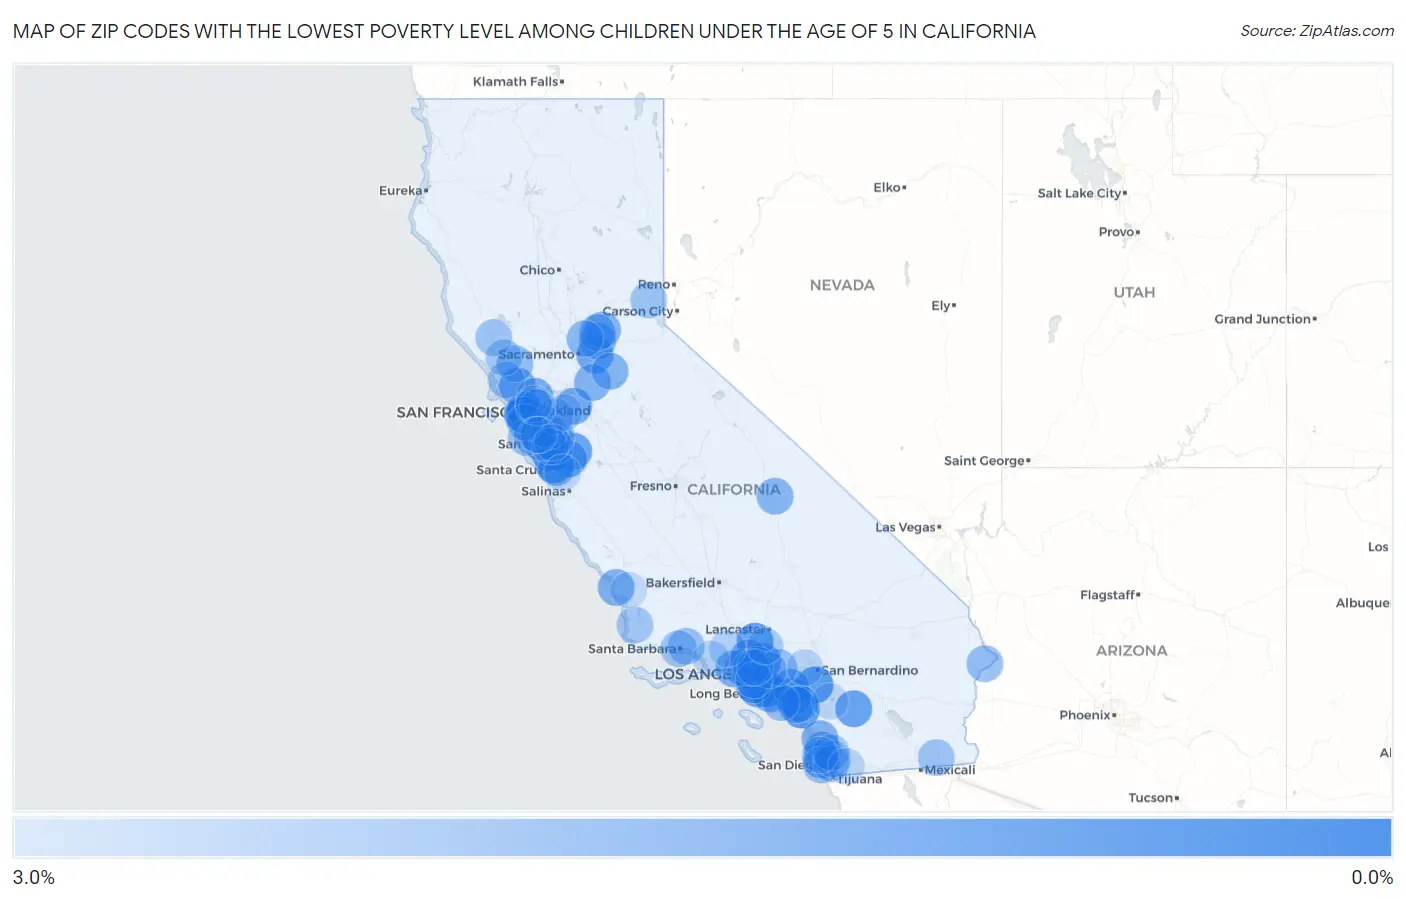
Map of Zip Codes with the Lowest Poverty Level Among Children Under the Age of 5 in California
3.0%
0.0%
Zip Codes with the Lowest Poverty Level Among Children Under the Age of 5 in California
| Zip Code | Child Poverty | vs State | vs National | |
| 1. | 95118 | 0.33% | 15.6%(-15.3)#1 | 18.1%(-17.7)#18 |
| 2. | 90248 | 0.34% | 15.6%(-15.3)#2 | 18.1%(-17.7)#19 |
| 3. | 94404 | 0.39% | 15.6%(-15.2)#3 | 18.1%(-17.7)#30 |
| 4. | 91214 | 0.42% | 15.6%(-15.2)#4 | 18.1%(-17.6)#38 |
| 5. | 94116 | 0.42% | 15.6%(-15.2)#5 | 18.1%(-17.6)#39 |
| 6. | 92694 | 0.46% | 15.6%(-15.2)#6 | 18.1%(-17.6)#49 |
| 7. | 92508 | 0.47% | 15.6%(-15.1)#7 | 18.1%(-17.6)#53 |
| 8. | 95073 | 0.60% | 15.6%(-15.0)#8 | 18.1%(-17.5)#93 |
| 9. | 94117 | 0.61% | 15.6%(-15.0)#9 | 18.1%(-17.5)#96 |
| 10. | 95014 | 0.63% | 15.6%(-15.0)#10 | 18.1%(-17.4)#102 |
| 11. | 94043 | 0.63% | 15.6%(-15.0)#11 | 18.1%(-17.4)#104 |
| 12. | 91390 | 0.67% | 15.6%(-14.9)#12 | 18.1%(-17.4)#122 |
| 13. | 90503 | 0.67% | 15.6%(-14.9)#13 | 18.1%(-17.4)#124 |
| 14. | 92539 | 0.73% | 15.6%(-14.9)#14 | 18.1%(-17.3)#141 |
| 15. | 95135 | 0.77% | 15.6%(-14.8)#15 | 18.1%(-17.3)#163 |
| 16. | 90807 | 0.79% | 15.6%(-14.8)#16 | 18.1%(-17.3)#168 |
| 17. | 95033 | 0.85% | 15.6%(-14.8)#17 | 18.1%(-17.2)#200 |
| 18. | 94945 | 0.85% | 15.6%(-14.8)#18 | 18.1%(-17.2)#201 |
| 19. | 90064 | 0.85% | 15.6%(-14.8)#19 | 18.1%(-17.2)#202 |
| 20. | 95037 | 0.86% | 15.6%(-14.8)#20 | 18.1%(-17.2)#209 |
| 21. | 95742 | 0.90% | 15.6%(-14.7)#21 | 18.1%(-17.2)#228 |
| 22. | 92109 | 0.90% | 15.6%(-14.7)#22 | 18.1%(-17.2)#230 |
| 23. | 92602 | 0.92% | 15.6%(-14.7)#23 | 18.1%(-17.1)#235 |
| 24. | 94122 | 0.92% | 15.6%(-14.7)#24 | 18.1%(-17.1)#239 |
| 25. | 90803 | 0.95% | 15.6%(-14.7)#25 | 18.1%(-17.1)#253 |
| 26. | 95051 | 0.96% | 15.6%(-14.6)#26 | 18.1%(-17.1)#255 |
| 27. | 94505 | 0.96% | 15.6%(-14.6)#27 | 18.1%(-17.1)#256 |
| 28. | 91344 | 1.0% | 15.6%(-14.6)#28 | 18.1%(-17.0)#284 |
| 29. | 92808 | 1.0% | 15.6%(-14.6)#29 | 18.1%(-17.0)#290 |
| 30. | 90049 | 1.0% | 15.6%(-14.6)#30 | 18.1%(-17.0)#291 |
| 31. | 90266 | 1.1% | 15.6%(-14.5)#31 | 18.1%(-17.0)#315 |
| 32. | 92688 | 1.1% | 15.6%(-14.5)#32 | 18.1%(-16.9)#341 |
| 33. | 94403 | 1.1% | 15.6%(-14.5)#33 | 18.1%(-16.9)#347 |
| 34. | 91301 | 1.1% | 15.6%(-14.5)#34 | 18.1%(-16.9)#351 |
| 35. | 92130 | 1.2% | 15.6%(-14.4)#35 | 18.1%(-16.9)#360 |
| 36. | 95746 | 1.3% | 15.6%(-14.4)#36 | 18.1%(-16.8)#401 |
| 37. | 93402 | 1.3% | 15.6%(-14.4)#37 | 18.1%(-16.8)#405 |
| 38. | 94564 | 1.3% | 15.6%(-14.3)#38 | 18.1%(-16.8)#406 |
| 39. | 92009 | 1.3% | 15.6%(-14.3)#39 | 18.1%(-16.8)#422 |
| 40. | 95603 | 1.3% | 15.6%(-14.3)#40 | 18.1%(-16.8)#426 |
| 41. | 95032 | 1.3% | 15.6%(-14.3)#41 | 18.1%(-16.7)#435 |
| 42. | 95131 | 1.3% | 15.6%(-14.3)#42 | 18.1%(-16.7)#441 |
| 43. | 95220 | 1.3% | 15.6%(-14.3)#43 | 18.1%(-16.7)#442 |
| 44. | 94123 | 1.4% | 15.6%(-14.2)#44 | 18.1%(-16.7)#460 |
| 45. | 95640 | 1.4% | 15.6%(-14.2)#45 | 18.1%(-16.7)#461 |
| 46. | 95658 | 1.4% | 15.6%(-14.2)#46 | 18.1%(-16.6)#487 |
| 47. | 93545 | 1.4% | 15.6%(-14.2)#47 | 18.1%(-16.6)#494 |
| 48. | 95035 | 1.5% | 15.6%(-14.1)#48 | 18.1%(-16.6)#515 |
| 49. | 91505 | 1.5% | 15.6%(-14.1)#49 | 18.1%(-16.6)#538 |
| 50. | 95747 | 1.6% | 15.6%(-14.1)#50 | 18.1%(-16.5)#564 |
| 51. | 92691 | 1.6% | 15.6%(-14.1)#51 | 18.1%(-16.5)#570 |
| 52. | 95003 | 1.6% | 15.6%(-14.0)#52 | 18.1%(-16.5)#575 |
| 53. | 91364 | 1.6% | 15.6%(-14.0)#53 | 18.1%(-16.5)#580 |
| 54. | 94062 | 1.6% | 15.6%(-14.0)#54 | 18.1%(-16.5)#592 |
| 55. | 95125 | 1.6% | 15.6%(-14.0)#55 | 18.1%(-16.4)#618 |
| 56. | 95409 | 1.7% | 15.6%(-14.0)#56 | 18.1%(-16.4)#619 |
| 57. | 92242 | 1.7% | 15.6%(-13.9)#57 | 18.1%(-16.4)#627 |
| 58. | 92663 | 1.7% | 15.6%(-13.9)#58 | 18.1%(-16.3)#651 |
| 59. | 91010 | 1.7% | 15.6%(-13.9)#59 | 18.1%(-16.3)#672 |
| 60. | 93108 | 1.8% | 15.6%(-13.8)#60 | 18.1%(-16.3)#688 |
| 61. | 94019 | 1.8% | 15.6%(-13.8)#61 | 18.1%(-16.3)#709 |
| 62. | 92106 | 1.8% | 15.6%(-13.8)#62 | 18.1%(-16.2)#725 |
| 63. | 94127 | 1.9% | 15.6%(-13.7)#63 | 18.1%(-16.2)#754 |
| 64. | 94022 | 1.9% | 15.6%(-13.7)#64 | 18.1%(-16.2)#757 |
| 65. | 93109 | 1.9% | 15.6%(-13.7)#65 | 18.1%(-16.2)#772 |
| 66. | 92250 | 1.9% | 15.6%(-13.7)#66 | 18.1%(-16.1)#782 |
| 67. | 95425 | 2.0% | 15.6%(-13.7)#67 | 18.1%(-16.1)#796 |
| 68. | 96161 | 2.0% | 15.6%(-13.7)#68 | 18.1%(-16.1)#798 |
| 69. | 94952 | 2.0% | 15.6%(-13.7)#69 | 18.1%(-16.1)#799 |
| 70. | 91945 | 2.0% | 15.6%(-13.6)#70 | 18.1%(-16.1)#822 |
| 71. | 91030 | 2.0% | 15.6%(-13.6)#71 | 18.1%(-16.1)#824 |
| 72. | 91403 | 2.0% | 15.6%(-13.6)#72 | 18.1%(-16.1)#831 |
| 73. | 93437 | 2.0% | 15.6%(-13.6)#73 | 18.1%(-16.1)#835 |
| 74. | 94087 | 2.0% | 15.6%(-13.6)#74 | 18.1%(-16.0)#851 |
| 75. | 94560 | 2.0% | 15.6%(-13.6)#75 | 18.1%(-16.0)#853 |
| 76. | 95492 | 2.0% | 15.6%(-13.6)#76 | 18.1%(-16.0)#862 |
| 77. | 90045 | 2.1% | 15.6%(-13.5)#77 | 18.1%(-16.0)#900 |
| 78. | 91604 | 2.2% | 15.6%(-13.5)#78 | 18.1%(-15.9)#942 |
| 79. | 92119 | 2.2% | 15.6%(-13.4)#79 | 18.1%(-15.9)#959 |
| 80. | 92131 | 2.2% | 15.6%(-13.4)#80 | 18.1%(-15.9)#961 |
| 81. | 94555 | 2.2% | 15.6%(-13.4)#81 | 18.1%(-15.9)#962 |
| 82. | 94703 | 2.2% | 15.6%(-13.4)#82 | 18.1%(-15.9)#970 |
| 83. | 94568 | 2.2% | 15.6%(-13.4)#83 | 18.1%(-15.8)#981 |
| 84. | 93510 | 2.2% | 15.6%(-13.4)#84 | 18.1%(-15.8)#996 |
| 85. | 94551 | 2.3% | 15.6%(-13.3)#85 | 18.1%(-15.7)#1,050 |
| 86. | 94066 | 2.3% | 15.6%(-13.3)#86 | 18.1%(-15.7)#1,054 |
| 87. | 93015 | 2.4% | 15.6%(-13.2)#87 | 18.1%(-15.7)#1,067 |
| 88. | 94611 | 2.4% | 15.6%(-13.2)#88 | 18.1%(-15.7)#1,102 |
| 89. | 94707 | 2.4% | 15.6%(-13.2)#89 | 18.1%(-15.7)#1,105 |
| 90. | 91739 | 2.5% | 15.6%(-13.1)#90 | 18.1%(-15.6)#1,146 |
| 91. | 94061 | 2.5% | 15.6%(-13.1)#91 | 18.1%(-15.6)#1,164 |
| 92. | 93004 | 2.5% | 15.6%(-13.1)#92 | 18.1%(-15.6)#1,179 |
| 93. | 91935 | 2.5% | 15.6%(-13.1)#93 | 18.1%(-15.5)#1,185 |
| 94. | 95129 | 2.5% | 15.6%(-13.1)#94 | 18.1%(-15.5)#1,191 |
| 95. | 92037 | 2.5% | 15.6%(-13.1)#95 | 18.1%(-15.5)#1,195 |
| 96. | 95050 | 2.6% | 15.6%(-13.0)#96 | 18.1%(-15.4)#1,249 |
| 97. | 95019 | 2.6% | 15.6%(-13.0)#97 | 18.1%(-15.4)#1,253 |
| 98. | 94025 | 2.7% | 15.6%(-13.0)#98 | 18.1%(-15.4)#1,263 |
| 99. | 92596 | 2.7% | 15.6%(-12.9)#99 | 18.1%(-15.4)#1,279 |
| 100. | 93401 | 2.7% | 15.6%(-12.9)#100 | 18.1%(-15.3)#1,313 |
Common Questions
What are the Top 10 Zip Codes with the Lowest Poverty Level Among Children Under the Age of 5 in California?
Top 10 Zip Codes with the Lowest Poverty Level Among Children Under the Age of 5 in California are:
What zip code has the Lowest Poverty Level Among Children Under the Age of 5 in California?
95118 has the Lowest Poverty Level Among Children Under the Age of 5 in California with 0.33%.
What is the Poverty Level Among Children Under the Age of 5 in the State of California?
Poverty Level Among Children Under the Age of 5 in California is 15.6%.
What is the Poverty Level Among Children Under the Age of 5 in the United States?
Poverty Level Among Children Under the Age of 5 in the United States is 18.1%.