Zip Codes with the Lowest Poverty Level Among Children Under the Age of 5 in Louisiana
RELATED REPORTS & OPTIONS
Lowest Poverty | Child 0-5
Louisiana
Compare Zip Codes
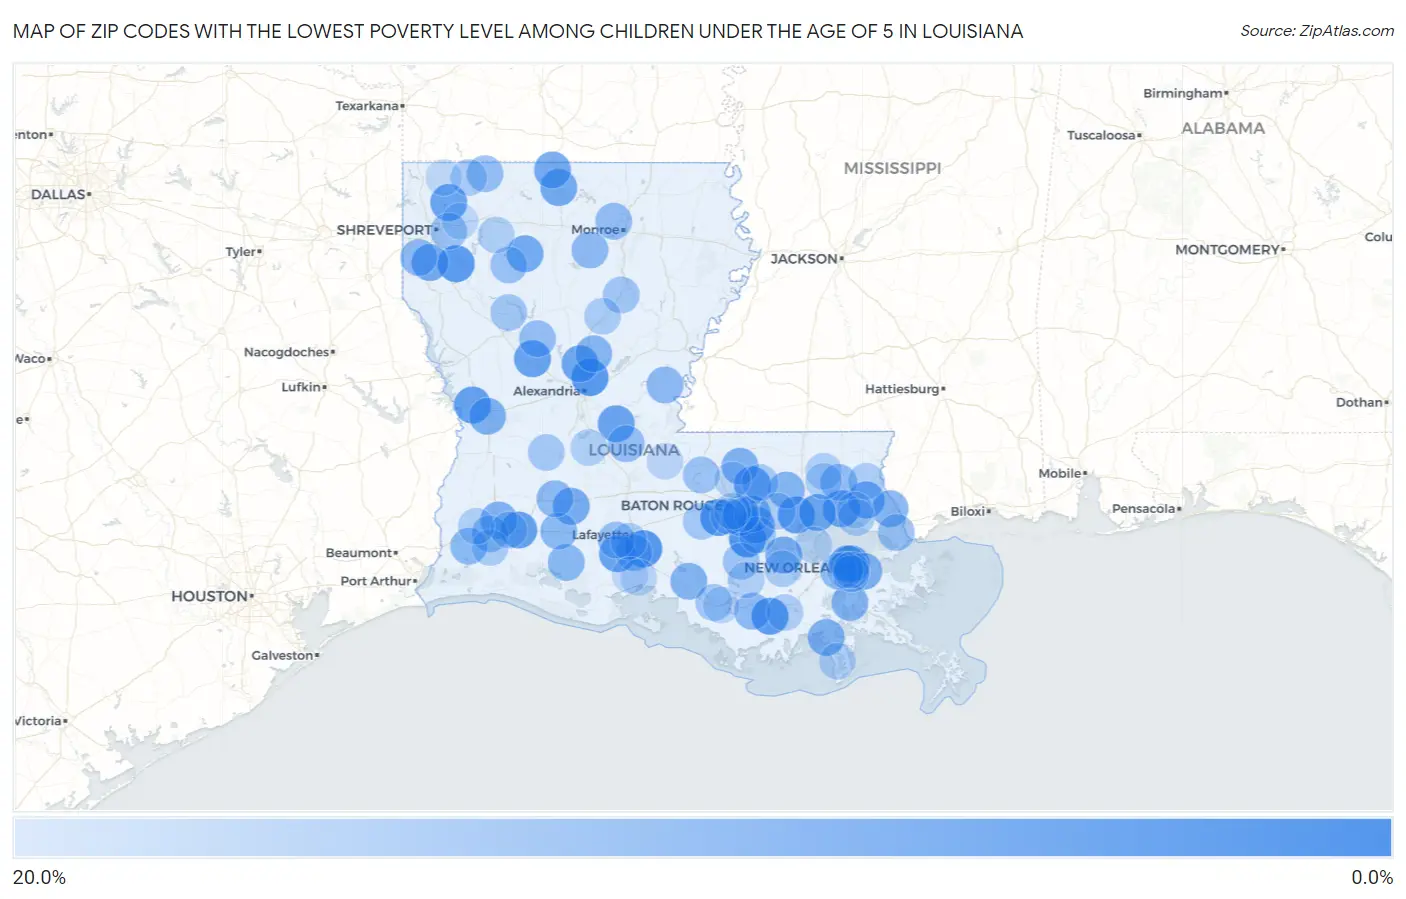
Map of Zip Codes with the Lowest Poverty Level Among Children Under the Age of 5 in Louisiana
20.0%
0.0%
Zip Codes with the Lowest Poverty Level Among Children Under the Age of 5 in Louisiana
| Zip Code | Child Poverty | vs State | vs National | |
| 1. | 70734 | 1.4% | 28.4%(-27.0)#1 | 18.1%(-16.6)#486 |
| 2. | 70518 | 1.5% | 28.4%(-26.9)#2 | 18.1%(-16.6)#523 |
| 3. | 70710 | 1.7% | 28.4%(-26.7)#3 | 18.1%(-16.3)#669 |
| 4. | 71405 | 1.8% | 28.4%(-26.6)#4 | 18.1%(-16.2)#723 |
| 5. | 70360 | 1.9% | 28.4%(-26.5)#5 | 18.1%(-16.1)#791 |
| 6. | 71115 | 2.0% | 28.4%(-26.4)#6 | 18.1%(-16.1)#812 |
| 7. | 70462 | 3.3% | 28.4%(-25.1)#7 | 18.1%(-14.8)#1,696 |
| 8. | 70739 | 3.7% | 28.4%(-24.7)#8 | 18.1%(-14.3)#1,983 |
| 9. | 70647 | 3.8% | 28.4%(-24.6)#9 | 18.1%(-14.3)#2,025 |
| 10. | 71403 | 3.8% | 28.4%(-24.6)#10 | 18.1%(-14.2)#2,060 |
| 11. | 70447 | 3.9% | 28.4%(-24.5)#11 | 18.1%(-14.2)#2,079 |
| 12. | 71416 | 4.0% | 28.4%(-24.4)#12 | 18.1%(-14.1)#2,156 |
| 13. | 70555 | 4.1% | 28.4%(-24.3)#13 | 18.1%(-14.0)#2,251 |
| 14. | 71006 | 4.2% | 28.4%(-24.2)#14 | 18.1%(-13.8)#2,362 |
| 15. | 71341 | 4.2% | 28.4%(-24.2)#15 | 18.1%(-13.8)#2,363 |
| 16. | 70124 | 4.4% | 28.4%(-24.1)#16 | 18.1%(-13.7)#2,458 |
| 17. | 70454 | 4.6% | 28.4%(-23.8)#17 | 18.1%(-13.5)#2,628 |
| 18. | 71407 | 4.9% | 28.4%(-23.5)#18 | 18.1%(-13.1)#2,846 |
| 19. | 70769 | 5.3% | 28.4%(-23.1)#19 | 18.1%(-12.7)#3,104 |
| 20. | 71078 | 5.7% | 28.4%(-22.8)#20 | 18.1%(-12.4)#3,356 |
| 21. | 71222 | 5.7% | 28.4%(-22.8)#21 | 18.1%(-12.4)#3,364 |
| 22. | 71008 | 5.9% | 28.4%(-22.5)#22 | 18.1%(-12.2)#3,521 |
| 23. | 71256 | 6.1% | 28.4%(-22.4)#23 | 18.1%(-12.0)#3,644 |
| 24. | 70420 | 6.1% | 28.4%(-22.3)#24 | 18.1%(-11.9)#3,673 |
| 25. | 70515 | 6.3% | 28.4%(-22.1)#25 | 18.1%(-11.8)#3,831 |
| 26. | 70005 | 6.4% | 28.4%(-22.0)#26 | 18.1%(-11.7)#3,870 |
| 27. | 70052 | 6.7% | 28.4%(-21.7)#27 | 18.1%(-11.4)#4,034 |
| 28. | 71461 | 7.4% | 28.4%(-21.0)#28 | 18.1%(-10.6)#4,569 |
| 29. | 70032 | 7.6% | 28.4%(-20.8)#29 | 18.1%(-10.4)#4,687 |
| 30. | 70354 | 7.7% | 28.4%(-20.7)#30 | 18.1%(-10.4)#4,724 |
| 31. | 70777 | 8.0% | 28.4%(-20.4)#31 | 18.1%(-10.1)#4,913 |
| 32. | 70611 | 8.1% | 28.4%(-20.4)#32 | 18.1%(-10.0)#4,956 |
| 33. | 70810 | 8.1% | 28.4%(-20.3)#33 | 18.1%(-9.96)#4,977 |
| 34. | 70452 | 8.5% | 28.4%(-19.9)#34 | 18.1%(-9.57)#5,254 |
| 35. | 70744 | 8.5% | 28.4%(-19.9)#35 | 18.1%(-9.55)#5,263 |
| 36. | 70067 | 8.6% | 28.4%(-19.8)#36 | 18.1%(-9.48)#5,317 |
| 37. | 70523 | 8.7% | 28.4%(-19.7)#37 | 18.1%(-9.37)#5,408 |
| 38. | 70817 | 8.7% | 28.4%(-19.7)#38 | 18.1%(-9.32)#5,436 |
| 39. | 71467 | 9.0% | 28.4%(-19.4)#39 | 18.1%(-9.07)#5,612 |
| 40. | 70542 | 9.3% | 28.4%(-19.1)#40 | 18.1%(-8.73)#5,838 |
| 41. | 70546 | 9.5% | 28.4%(-18.9)#41 | 18.1%(-8.59)#5,928 |
| 42. | 70665 | 9.7% | 28.4%(-18.8)#42 | 18.1%(-8.41)#6,053 |
| 43. | 71354 | 9.7% | 28.4%(-18.7)#43 | 18.1%(-8.33)#6,102 |
| 44. | 71238 | 9.8% | 28.4%(-18.6)#44 | 18.1%(-8.26)#6,134 |
| 45. | 70356 | 9.9% | 28.4%(-18.5)#45 | 18.1%(-8.19)#6,176 |
| 46. | 71047 | 9.9% | 28.4%(-18.5)#46 | 18.1%(-8.14)#6,197 |
| 47. | 70532 | 9.9% | 28.4%(-18.5)#47 | 18.1%(-8.13)#6,204 |
| 48. | 70437 | 10.3% | 28.4%(-18.1)#48 | 18.1%(-7.78)#6,428 |
| 49. | 70123 | 10.5% | 28.4%(-18.0)#49 | 18.1%(-7.60)#6,529 |
| 50. | 70592 | 10.7% | 28.4%(-17.7)#50 | 18.1%(-7.34)#6,687 |
| 51. | 71291 | 10.8% | 28.4%(-17.7)#51 | 18.1%(-7.31)#6,699 |
| 52. | 71333 | 10.9% | 28.4%(-17.5)#52 | 18.1%(-7.19)#6,760 |
| 53. | 71454 | 11.0% | 28.4%(-17.4)#53 | 18.1%(-7.06)#6,836 |
| 54. | 70461 | 11.0% | 28.4%(-17.4)#54 | 18.1%(-7.04)#6,853 |
| 55. | 71072 | 11.1% | 28.4%(-17.3)#55 | 18.1%(-6.95)#6,902 |
| 56. | 70115 | 11.2% | 28.4%(-17.2)#56 | 18.1%(-6.84)#6,989 |
| 57. | 70669 | 11.3% | 28.4%(-17.1)#57 | 18.1%(-6.76)#7,027 |
| 58. | 70529 | 11.5% | 28.4%(-16.9)#58 | 18.1%(-6.56)#7,142 |
| 59. | 71110 | 11.9% | 28.4%(-16.6)#59 | 18.1%(-6.20)#7,376 |
| 60. | 71016 | 12.0% | 28.4%(-16.5)#60 | 18.1%(-6.11)#7,431 |
| 61. | 70341 | 12.1% | 28.4%(-16.3)#61 | 18.1%(-5.97)#7,517 |
| 62. | 70783 | 12.1% | 28.4%(-16.3)#62 | 18.1%(-5.94)#7,532 |
| 63. | 70737 | 12.3% | 28.4%(-16.1)#63 | 18.1%(-5.73)#7,655 |
| 64. | 71435 | 12.8% | 28.4%(-15.6)#64 | 18.1%(-5.30)#7,901 |
| 65. | 70809 | 12.9% | 28.4%(-15.5)#65 | 18.1%(-5.19)#7,969 |
| 66. | 70392 | 13.0% | 28.4%(-15.4)#66 | 18.1%(-5.06)#8,046 |
| 67. | 71411 | 13.0% | 28.4%(-15.4)#67 | 18.1%(-5.02)#8,068 |
| 68. | 70740 | 13.3% | 28.4%(-15.1)#68 | 18.1%(-4.73)#8,245 |
| 69. | 70638 | 13.5% | 28.4%(-15.0)#69 | 18.1%(-4.60)#8,324 |
| 70. | 70706 | 13.9% | 28.4%(-14.6)#70 | 18.1%(-4.21)#8,550 |
| 71. | 71480 | 14.3% | 28.4%(-14.1)#71 | 18.1%(-3.78)#8,816 |
| 72. | 70090 | 14.4% | 28.4%(-14.0)#72 | 18.1%(-3.67)#8,889 |
| 73. | 70605 | 14.5% | 28.4%(-13.9)#73 | 18.1%(-3.57)#8,938 |
| 74. | 70615 | 14.5% | 28.4%(-13.9)#74 | 18.1%(-3.57)#8,943 |
| 75. | 71071 | 14.6% | 28.4%(-13.8)#75 | 18.1%(-3.48)#8,981 |
| 76. | 70364 | 14.7% | 28.4%(-13.7)#76 | 18.1%(-3.32)#9,061 |
| 77. | 70754 | 14.8% | 28.4%(-13.6)#77 | 18.1%(-3.24)#9,108 |
| 78. | 70448 | 14.9% | 28.4%(-13.5)#78 | 18.1%(-3.18)#9,134 |
| 79. | 70431 | 14.9% | 28.4%(-13.5)#79 | 18.1%(-3.17)#9,141 |
| 80. | 70808 | 14.9% | 28.4%(-13.5)#80 | 18.1%(-3.14)#9,159 |
| 81. | 70585 | 15.0% | 28.4%(-13.4)#81 | 18.1%(-3.06)#9,218 |
| 82. | 70663 | 15.0% | 28.4%(-13.4)#82 | 18.1%(-3.05)#9,223 |
| 83. | 70442 | 15.1% | 28.4%(-13.3)#83 | 18.1%(-2.97)#9,271 |
| 84. | 70357 | 15.1% | 28.4%(-13.3)#84 | 18.1%(-2.95)#9,278 |
| 85. | 71024 | 15.2% | 28.4%(-13.2)#85 | 18.1%(-2.88)#9,312 |
| 86. | 70503 | 15.2% | 28.4%(-13.2)#86 | 18.1%(-2.83)#9,343 |
| 87. | 70390 | 15.3% | 28.4%(-13.1)#87 | 18.1%(-2.73)#9,393 |
| 88. | 70446 | 15.4% | 28.4%(-13.1)#88 | 18.1%(-2.71)#9,401 |
| 89. | 70068 | 15.9% | 28.4%(-12.5)#89 | 18.1%(-2.13)#9,724 |
| 90. | 70528 | 16.5% | 28.4%(-11.9)#90 | 18.1%(-1.52)#10,054 |
| 91. | 70753 | 16.6% | 28.4%(-11.9)#91 | 18.1%(-1.50)#10,060 |
| 92. | 70791 | 16.7% | 28.4%(-11.7)#92 | 18.1%(-1.35)#10,152 |
| 93. | 70342 | 16.8% | 28.4%(-11.7)#93 | 18.1%(-1.30)#10,165 |
| 94. | 70471 | 16.9% | 28.4%(-11.5)#94 | 18.1%(-1.14)#10,213 |
| 95. | 70820 | 17.1% | 28.4%(-11.3)#95 | 18.1%(-0.968)#10,288 |
| 96. | 71037 | 17.1% | 28.4%(-11.3)#96 | 18.1%(-0.956)#10,294 |
| 97. | 70121 | 17.1% | 28.4%(-11.3)#97 | 18.1%(-0.931)#10,304 |
| 98. | 70125 | 17.1% | 28.4%(-11.3)#98 | 18.1%(-0.923)#10,308 |
| 99. | 70533 | 17.5% | 28.4%(-10.9)#99 | 18.1%(-0.524)#10,484 |
| 100. | 71064 | 17.7% | 28.4%(-10.7)#100 | 18.1%(-0.380)#10,558 |
Common Questions
What are the Top 10 Zip Codes with the Lowest Poverty Level Among Children Under the Age of 5 in Louisiana?
Top 10 Zip Codes with the Lowest Poverty Level Among Children Under the Age of 5 in Louisiana are:
What zip code has the Lowest Poverty Level Among Children Under the Age of 5 in Louisiana?
70734 has the Lowest Poverty Level Among Children Under the Age of 5 in Louisiana with 1.4%.
What is the Poverty Level Among Children Under the Age of 5 in the State of Louisiana?
Poverty Level Among Children Under the Age of 5 in Louisiana is 28.4%.
What is the Poverty Level Among Children Under the Age of 5 in the United States?
Poverty Level Among Children Under the Age of 5 in the United States is 18.1%.