Zip Codes with the Lowest Poverty Level Among Children Under the Age of 5 in Arizona
RELATED REPORTS & OPTIONS
Lowest Poverty | Child 0-5
Arizona
Compare Zip Codes
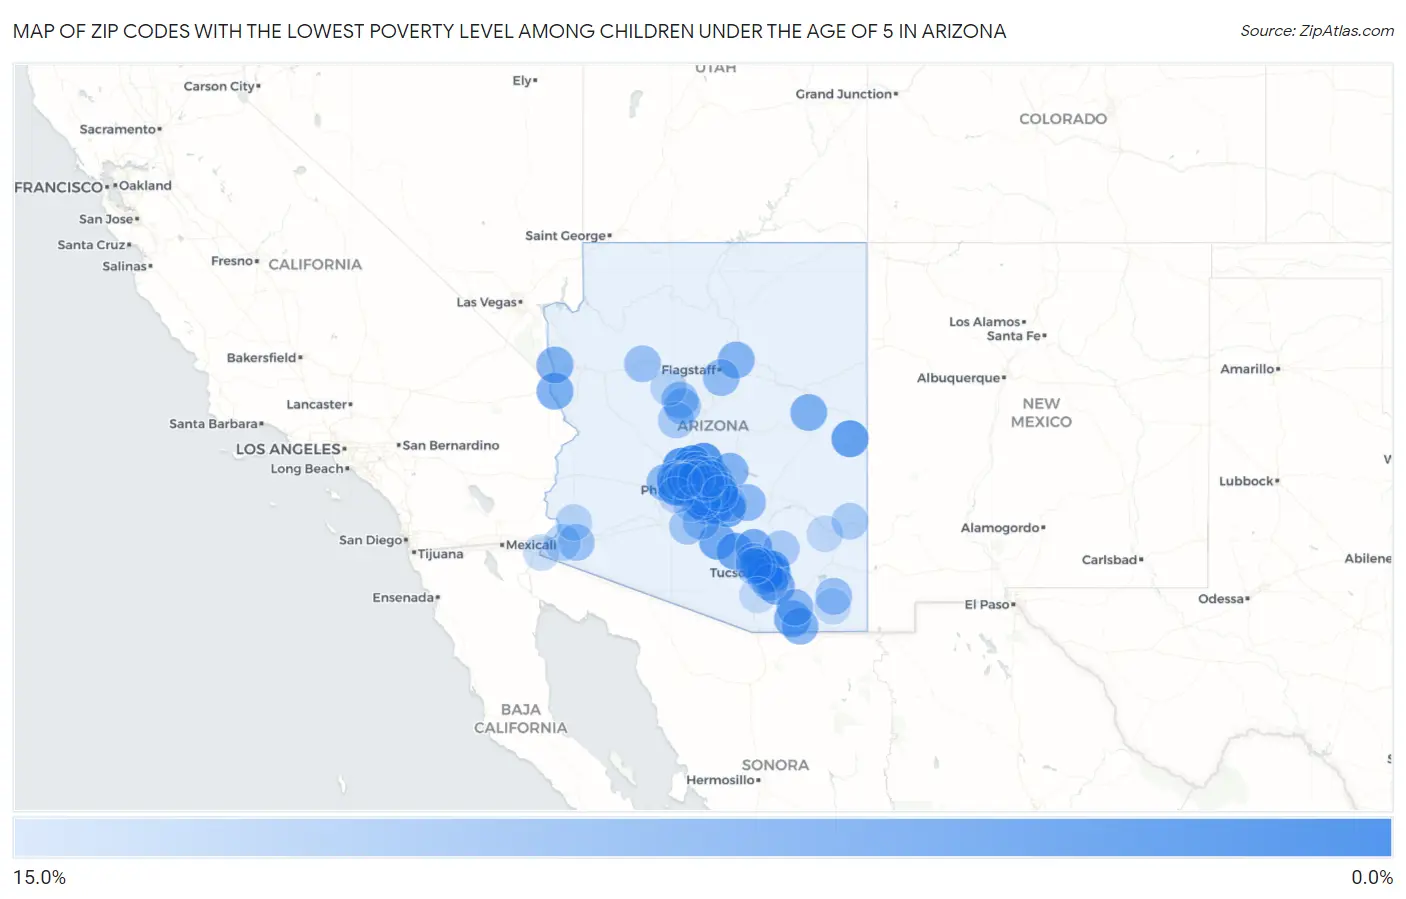
Map of Zip Codes with the Lowest Poverty Level Among Children Under the Age of 5 in Arizona
15.0%
0.0%
Zip Codes with the Lowest Poverty Level Among Children Under the Age of 5 in Arizona
| Zip Code | Child Poverty | vs State | vs National | |
| 1. | 85331 | 0.37% | 19.3%(-18.9)#1 | 18.1%(-17.7)#27 |
| 2. | 85028 | 0.65% | 19.3%(-18.7)#2 | 18.1%(-17.4)#111 |
| 3. | 85383 | 0.71% | 19.3%(-18.6)#3 | 18.1%(-17.4)#135 |
| 4. | 85086 | 0.95% | 19.3%(-18.4)#4 | 18.1%(-17.1)#254 |
| 5. | 85249 | 1.2% | 19.3%(-18.1)#5 | 18.1%(-16.8)#387 |
| 6. | 85718 | 1.5% | 19.3%(-17.8)#6 | 18.1%(-16.6)#512 |
| 7. | 85715 | 1.7% | 19.3%(-17.6)#7 | 18.1%(-16.4)#633 |
| 8. | 85260 | 1.9% | 19.3%(-17.4)#8 | 18.1%(-16.2)#767 |
| 9. | 85305 | 2.0% | 19.3%(-17.3)#9 | 18.1%(-16.0)#843 |
| 10. | 85212 | 2.0% | 19.3%(-17.3)#10 | 18.1%(-16.0)#852 |
| 11. | 85938 | 2.2% | 19.3%(-17.1)#11 | 18.1%(-15.8)#995 |
| 12. | 85254 | 2.6% | 19.3%(-16.7)#12 | 18.1%(-15.4)#1,257 |
| 13. | 85083 | 2.7% | 19.3%(-16.6)#13 | 18.1%(-15.4)#1,270 |
| 14. | 85123 | 3.3% | 19.3%(-16.0)#14 | 18.1%(-14.7)#1,709 |
| 15. | 85748 | 3.4% | 19.3%(-15.9)#15 | 18.1%(-14.6)#1,769 |
| 16. | 85143 | 3.5% | 19.3%(-15.8)#16 | 18.1%(-14.6)#1,814 |
| 17. | 85295 | 3.5% | 19.3%(-15.8)#17 | 18.1%(-14.5)#1,843 |
| 18. | 85145 | 3.6% | 19.3%(-15.7)#18 | 18.1%(-14.5)#1,870 |
| 19. | 85750 | 3.6% | 19.3%(-15.7)#19 | 18.1%(-14.4)#1,886 |
| 20. | 85085 | 3.7% | 19.3%(-15.6)#20 | 18.1%(-14.3)#1,984 |
| 21. | 85739 | 4.0% | 19.3%(-15.3)#21 | 18.1%(-14.0)#2,191 |
| 22. | 85248 | 4.1% | 19.3%(-15.2)#22 | 18.1%(-14.0)#2,212 |
| 23. | 85298 | 4.1% | 19.3%(-15.2)#23 | 18.1%(-14.0)#2,242 |
| 24. | 85257 | 4.1% | 19.3%(-15.2)#24 | 18.1%(-13.9)#2,277 |
| 25. | 85749 | 4.4% | 19.3%(-14.9)#25 | 18.1%(-13.7)#2,474 |
| 26. | 85641 | 4.5% | 19.3%(-14.8)#26 | 18.1%(-13.6)#2,541 |
| 27. | 86440 | 4.6% | 19.3%(-14.7)#27 | 18.1%(-13.5)#2,604 |
| 28. | 85286 | 4.6% | 19.3%(-14.7)#28 | 18.1%(-13.5)#2,624 |
| 29. | 85048 | 4.6% | 19.3%(-14.7)#29 | 18.1%(-13.5)#2,625 |
| 30. | 85268 | 4.7% | 19.3%(-14.6)#30 | 18.1%(-13.3)#2,710 |
| 31. | 85613 | 4.9% | 19.3%(-14.4)#31 | 18.1%(-13.2)#2,826 |
| 32. | 85296 | 4.9% | 19.3%(-14.4)#32 | 18.1%(-13.1)#2,863 |
| 33. | 85937 | 5.0% | 19.3%(-14.3)#33 | 18.1%(-13.0)#2,926 |
| 34. | 85253 | 5.1% | 19.3%(-14.2)#34 | 18.1%(-12.9)#3,007 |
| 35. | 85388 | 5.2% | 19.3%(-14.1)#35 | 18.1%(-12.8)#3,059 |
| 36. | 85209 | 5.3% | 19.3%(-14.0)#36 | 18.1%(-12.8)#3,088 |
| 37. | 86429 | 5.4% | 19.3%(-13.9)#37 | 18.1%(-12.6)#3,181 |
| 38. | 85018 | 5.4% | 19.3%(-13.9)#38 | 18.1%(-12.6)#3,189 |
| 39. | 85255 | 5.7% | 19.3%(-13.6)#39 | 18.1%(-12.4)#3,371 |
| 40. | 85264 | 5.8% | 19.3%(-13.5)#40 | 18.1%(-12.3)#3,434 |
| 41. | 85054 | 5.8% | 19.3%(-13.5)#41 | 18.1%(-12.3)#3,439 |
| 42. | 85392 | 5.8% | 19.3%(-13.5)#42 | 18.1%(-12.2)#3,476 |
| 43. | 85297 | 5.9% | 19.3%(-13.4)#43 | 18.1%(-12.2)#3,485 |
| 44. | 85615 | 5.9% | 19.3%(-13.4)#44 | 18.1%(-12.1)#3,544 |
| 45. | 86004 | 6.0% | 19.3%(-13.3)#45 | 18.1%(-12.0)#3,621 |
| 46. | 85234 | 6.7% | 19.3%(-12.6)#46 | 18.1%(-11.4)#4,026 |
| 47. | 85282 | 6.7% | 19.3%(-12.6)#47 | 18.1%(-11.4)#4,064 |
| 48. | 85142 | 6.7% | 19.3%(-12.6)#48 | 18.1%(-11.3)#4,103 |
| 49. | 85396 | 6.8% | 19.3%(-12.5)#49 | 18.1%(-11.3)#4,125 |
| 50. | 85616 | 7.0% | 19.3%(-12.3)#50 | 18.1%(-11.1)#4,290 |
| 51. | 85173 | 7.0% | 19.3%(-12.3)#51 | 18.1%(-11.0)#4,303 |
| 52. | 85340 | 7.2% | 19.3%(-12.1)#52 | 18.1%(-10.9)#4,406 |
| 53. | 85251 | 7.3% | 19.3%(-12.0)#53 | 18.1%(-10.7)#4,504 |
| 54. | 85379 | 7.4% | 19.3%(-11.9)#54 | 18.1%(-10.6)#4,564 |
| 55. | 86005 | 7.5% | 19.3%(-11.8)#55 | 18.1%(-10.6)#4,596 |
| 56. | 85013 | 7.7% | 19.3%(-11.6)#56 | 18.1%(-10.4)#4,709 |
| 57. | 86323 | 7.8% | 19.3%(-11.5)#57 | 18.1%(-10.2)#4,819 |
| 58. | 85625 | 8.1% | 19.3%(-11.2)#58 | 18.1%(-10.00)#4,964 |
| 59. | 85381 | 8.2% | 19.3%(-11.1)#59 | 18.1%(-9.87)#5,025 |
| 60. | 85207 | 8.2% | 19.3%(-11.1)#60 | 18.1%(-9.84)#5,057 |
| 61. | 85395 | 8.4% | 19.3%(-10.9)#61 | 18.1%(-9.71)#5,152 |
| 62. | 86337 | 8.4% | 19.3%(-10.9)#62 | 18.1%(-9.65)#5,188 |
| 63. | 85138 | 8.7% | 19.3%(-10.6)#63 | 18.1%(-9.41)#5,369 |
| 64. | 85224 | 8.7% | 19.3%(-10.6)#64 | 18.1%(-9.39)#5,381 |
| 65. | 85356 | 8.7% | 19.3%(-10.6)#65 | 18.1%(-9.37)#5,393 |
| 66. | 86315 | 8.7% | 19.3%(-10.6)#66 | 18.1%(-9.33)#5,430 |
| 67. | 85708 | 8.8% | 19.3%(-10.5)#67 | 18.1%(-9.29)#5,443 |
| 68. | 85742 | 8.8% | 19.3%(-10.5)#68 | 18.1%(-9.26)#5,481 |
| 69. | 85304 | 9.0% | 19.3%(-10.3)#69 | 18.1%(-9.11)#5,581 |
| 70. | 85355 | 9.1% | 19.3%(-10.2)#70 | 18.1%(-9.00)#5,653 |
| 71. | 85023 | 9.2% | 19.3%(-10.1)#71 | 18.1%(-8.90)#5,726 |
| 72. | 85306 | 9.2% | 19.3%(-10.1)#72 | 18.1%(-8.90)#5,729 |
| 73. | 85139 | 9.4% | 19.3%(-9.89)#73 | 18.1%(-8.65)#5,885 |
| 74. | 85024 | 9.8% | 19.3%(-9.49)#74 | 18.1%(-8.26)#6,141 |
| 75. | 85631 | 10.0% | 19.3%(-9.30)#75 | 18.1%(-8.06)#6,242 |
| 76. | 85747 | 10.1% | 19.3%(-9.23)#76 | 18.1%(-7.99)#6,308 |
| 77. | 85704 | 10.2% | 19.3%(-9.14)#77 | 18.1%(-7.90)#6,354 |
| 78. | 85741 | 10.2% | 19.3%(-9.06)#78 | 18.1%(-7.82)#6,402 |
| 79. | 85540 | 10.3% | 19.3%(-9.02)#79 | 18.1%(-7.78)#6,434 |
| 80. | 86303 | 10.4% | 19.3%(-8.93)#80 | 18.1%(-7.69)#6,491 |
| 81. | 85213 | 10.7% | 19.3%(-8.59)#81 | 18.1%(-7.35)#6,674 |
| 82. | 85140 | 10.8% | 19.3%(-8.53)#82 | 18.1%(-7.29)#6,707 |
| 83. | 85284 | 11.1% | 19.3%(-8.24)#83 | 18.1%(-7.00)#6,872 |
| 84. | 85367 | 11.1% | 19.3%(-8.21)#84 | 18.1%(-6.97)#6,883 |
| 85. | 85226 | 11.2% | 19.3%(-8.15)#85 | 18.1%(-6.91)#6,951 |
| 86. | 86334 | 11.3% | 19.3%(-8.04)#86 | 18.1%(-6.80)#7,007 |
| 87. | 85363 | 11.3% | 19.3%(-7.95)#87 | 18.1%(-6.72)#7,060 |
| 88. | 85365 | 11.4% | 19.3%(-7.93)#88 | 18.1%(-6.70)#7,078 |
| 89. | 85250 | 11.7% | 19.3%(-7.64)#89 | 18.1%(-6.40)#7,240 |
| 90. | 85339 | 11.8% | 19.3%(-7.51)#90 | 18.1%(-6.27)#7,332 |
| 91. | 85338 | 12.0% | 19.3%(-7.32)#91 | 18.1%(-6.08)#7,444 |
| 92. | 85022 | 12.1% | 19.3%(-7.21)#92 | 18.1%(-5.97)#7,521 |
| 93. | 85258 | 12.5% | 19.3%(-6.83)#93 | 18.1%(-5.59)#7,735 |
| 94. | 85336 | 12.5% | 19.3%(-6.81)#94 | 18.1%(-5.58)#7,740 |
| 95. | 85259 | 12.5% | 19.3%(-6.80)#95 | 18.1%(-5.56)#7,744 |
| 96. | 85610 | 12.5% | 19.3%(-6.80)#96 | 18.1%(-5.56)#7,770 |
| 97. | 85345 | 12.6% | 19.3%(-6.72)#97 | 18.1%(-5.49)#7,808 |
| 98. | 85552 | 12.6% | 19.3%(-6.72)#98 | 18.1%(-5.48)#7,814 |
| 99. | 85629 | 12.9% | 19.3%(-6.44)#99 | 18.1%(-5.21)#7,960 |
| 100. | 85208 | 12.9% | 19.3%(-6.43)#100 | 18.1%(-5.19)#7,964 |
Common Questions
What are the Top 10 Zip Codes with the Lowest Poverty Level Among Children Under the Age of 5 in Arizona?
Top 10 Zip Codes with the Lowest Poverty Level Among Children Under the Age of 5 in Arizona are:
What zip code has the Lowest Poverty Level Among Children Under the Age of 5 in Arizona?
85331 has the Lowest Poverty Level Among Children Under the Age of 5 in Arizona with 0.37%.
What is the Poverty Level Among Children Under the Age of 5 in the State of Arizona?
Poverty Level Among Children Under the Age of 5 in Arizona is 19.3%.
What is the Poverty Level Among Children Under the Age of 5 in the United States?
Poverty Level Among Children Under the Age of 5 in the United States is 18.1%.