Zip Codes with the Highest Percentage of Population Employed in Cleaning & Maintenance in Topeka, KS
RELATED REPORTS & OPTIONS
Cleaning & Maintenance
Topeka
Compare Zip Codes
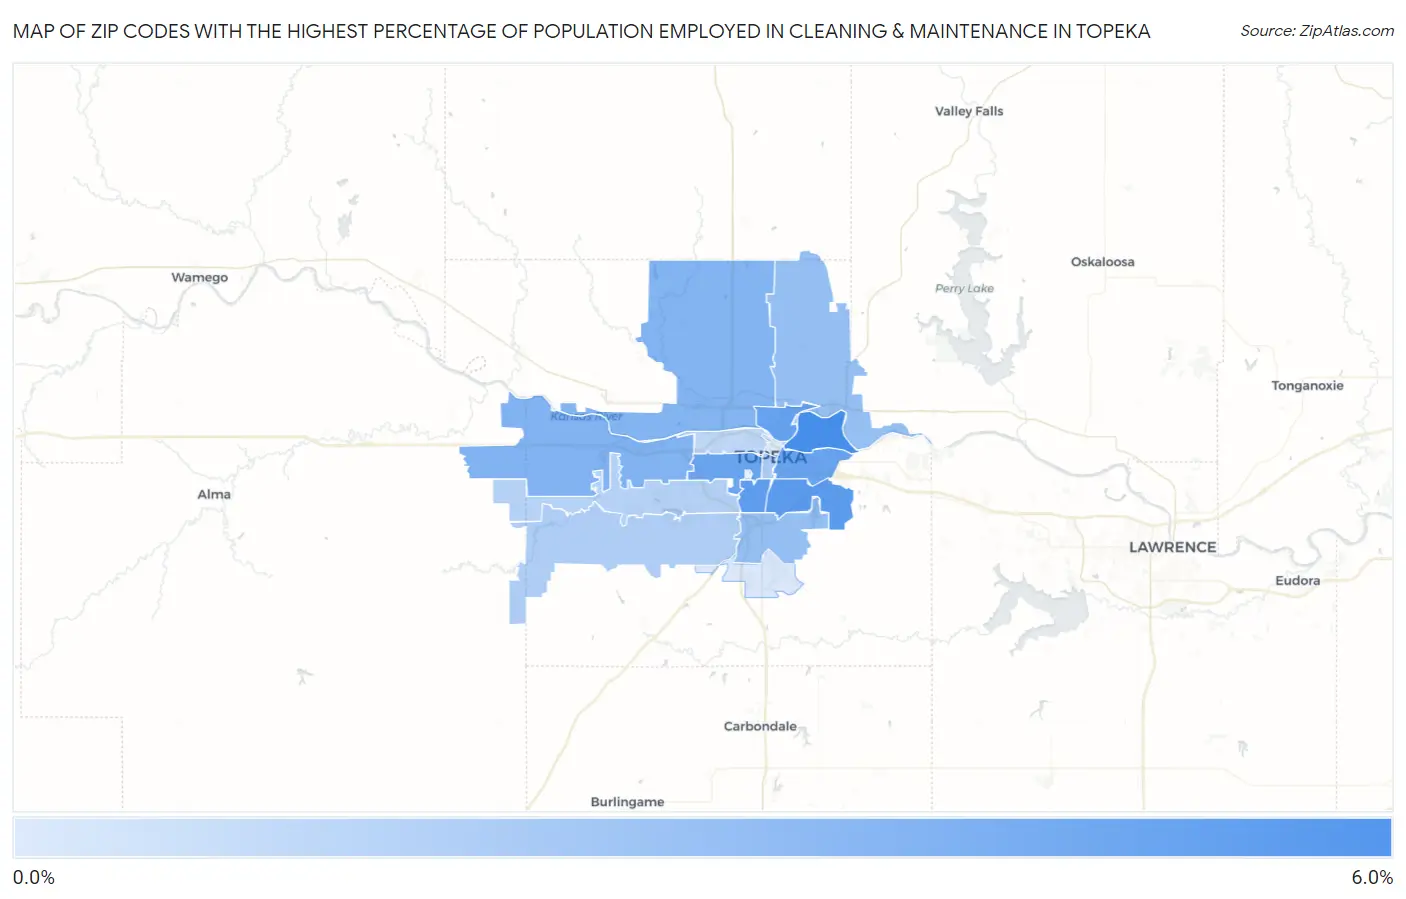
Map of Zip Codes with the Highest Percentage of Population Employed in Cleaning & Maintenance in Topeka
0.47%
5.8%
Zip Codes with the Highest Percentage of Population Employed in Cleaning & Maintenance in Topeka, KS
| Zip Code | % Employed | vs State | vs National | |
| 1. | 66616 | 5.8% | 3.3%(+2.53)#115 | 3.5%(+2.31)#6,069 |
| 2. | 66605 | 5.1% | 3.3%(+1.88)#156 | 3.5%(+1.66)#7,551 |
| 3. | 66611 | 4.9% | 3.3%(+1.59)#180 | 3.5%(+1.37)#8,366 |
| 4. | 66608 | 4.7% | 3.3%(+1.41)#192 | 3.5%(+1.19)#8,902 |
| 5. | 66607 | 4.5% | 3.3%(+1.27)#204 | 3.5%(+1.05)#9,409 |
| 6. | 66604 | 4.5% | 3.3%(+1.21)#210 | 3.5%(+0.991)#9,586 |
| 7. | 66615 | 3.7% | 3.3%(+0.450)#273 | 3.5%(+0.228)#12,500 |
| 8. | 66618 | 3.7% | 3.3%(+0.397)#276 | 3.5%(+0.176)#12,723 |
| 9. | 66617 | 3.0% | 3.3%(-0.271)#326 | 3.5%(-0.492)#15,918 |
| 10. | 66609 | 3.0% | 3.3%(-0.296)#329 | 3.5%(-0.518)#16,058 |
| 11. | 66612 | 2.2% | 3.3%(-1.10)#412 | 3.5%(-1.32)#20,275 |
| 12. | 66610 | 2.1% | 3.3%(-1.18)#422 | 3.5%(-1.40)#20,679 |
| 13. | 66614 | 1.9% | 3.3%(-1.40)#441 | 3.5%(-1.62)#21,731 |
| 14. | 66606 | 1.5% | 3.3%(-1.76)#486 | 3.5%(-1.99)#23,504 |
| 15. | 66619 | 0.57% | 3.3%(-2.69)#567 | 3.5%(-2.91)#26,798 |
| 16. | 66603 | 0.47% | 3.3%(-2.79)#572 | 3.5%(-3.01)#27,046 |
1
Common Questions
What are the Top 10 Zip Codes with the Highest Percentage of Population Employed in Cleaning & Maintenance in Topeka, KS?
Top 10 Zip Codes with the Highest Percentage of Population Employed in Cleaning & Maintenance in Topeka, KS are:
What zip code has the Highest Percentage of Population Employed in Cleaning & Maintenance in Topeka, KS?
66616 has the Highest Percentage of Population Employed in Cleaning & Maintenance in Topeka, KS with 5.8%.
What is the Percentage of Population Employed in Cleaning & Maintenance in Topeka, KS?
Percentage of Population Employed in Cleaning & Maintenance in Topeka is 3.7%.
What is the Percentage of Population Employed in Cleaning & Maintenance in Kansas?
Percentage of Population Employed in Cleaning & Maintenance in Kansas is 3.3%.
What is the Percentage of Population Employed in Cleaning & Maintenance in the United States?
Percentage of Population Employed in Cleaning & Maintenance in the United States is 3.5%.