Samsula Spruce Creek, FL Map & Demographics
Samsula Spruce Creek Map
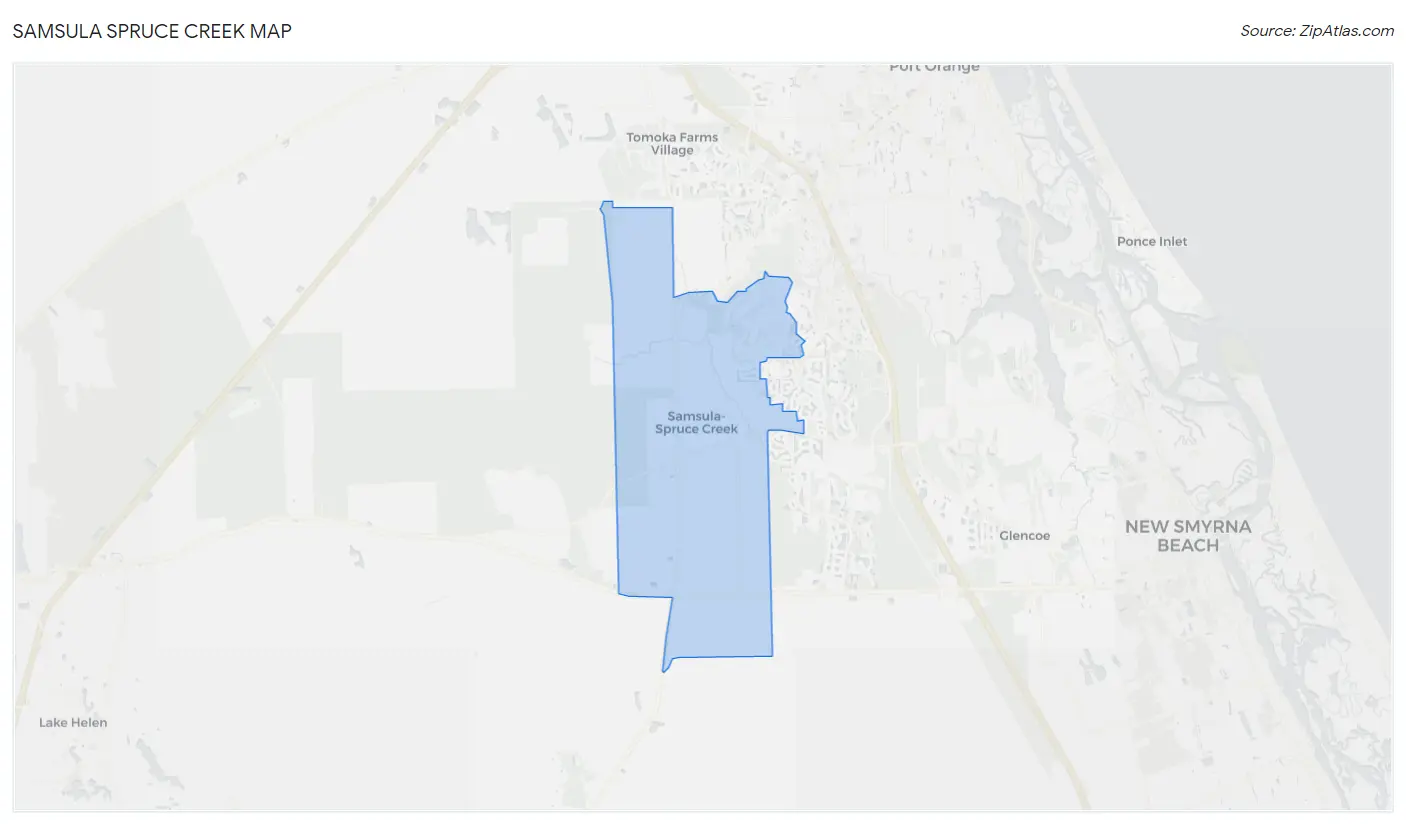
Samsula Spruce Creek Overview
$44,282
PER CAPITA INCOME
$100,441
AVG FAMILY INCOME
$81,484
AVG HOUSEHOLD INCOME
58.2%
WAGE / INCOME GAP [ % ]
41.8¢/ $1
WAGE / INCOME GAP [ $ ]
0.38
INEQUALITY / GINI INDEX
5,137
TOTAL POPULATION
2,342
MALE POPULATION
2,795
FEMALE POPULATION
83.79
MALES / 100 FEMALES
119.34
FEMALES / 100 MALES
60.4
MEDIAN AGE
2.6
AVG FAMILY SIZE
2.4
AVG HOUSEHOLD SIZE
2,160
LABOR FORCE [ PEOPLE ]
44.5%
PERCENT IN LABOR FORCE
1.3%
UNEMPLOYMENT RATE
Income in Samsula Spruce Creek
Income Overview in Samsula Spruce Creek
Per Capita Income in Samsula Spruce Creek is $44,282, while median incomes of families and households are $100,441 and $81,484 respectively.
| Characteristic | Number | Measure |
| Per Capita Income | 5,137 | $44,282 |
| Median Family Income | 1,708 | $100,441 |
| Mean Family Income | 1,708 | $113,071 |
| Median Household Income | 2,165 | $81,484 |
| Mean Household Income | 2,165 | $101,713 |
| Income Deficit | 1,708 | $0 |
| Wage / Income Gap (%) | 5,137 | 58.20% |
| Wage / Income Gap ($) | 5,137 | 41.80¢ per $1 |
| Gini / Inequality Index | 5,137 | 0.38 |
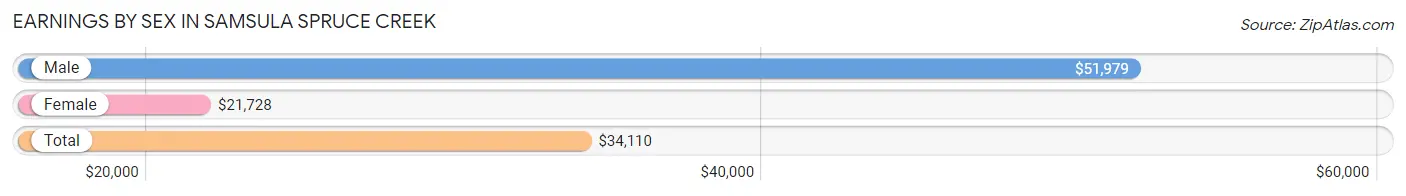
Earnings by Sex in Samsula Spruce Creek
Average Earnings in Samsula Spruce Creek are $34,110, $51,979 for men and $21,728 for women, a difference of 58.2%.
| Sex | Number | Average Earnings |
| Male | 1,438 (58.9%) | $51,979 |
| Female | 1,004 (41.1%) | $21,728 |
| Total | 2,442 (100.0%) | $34,110 |
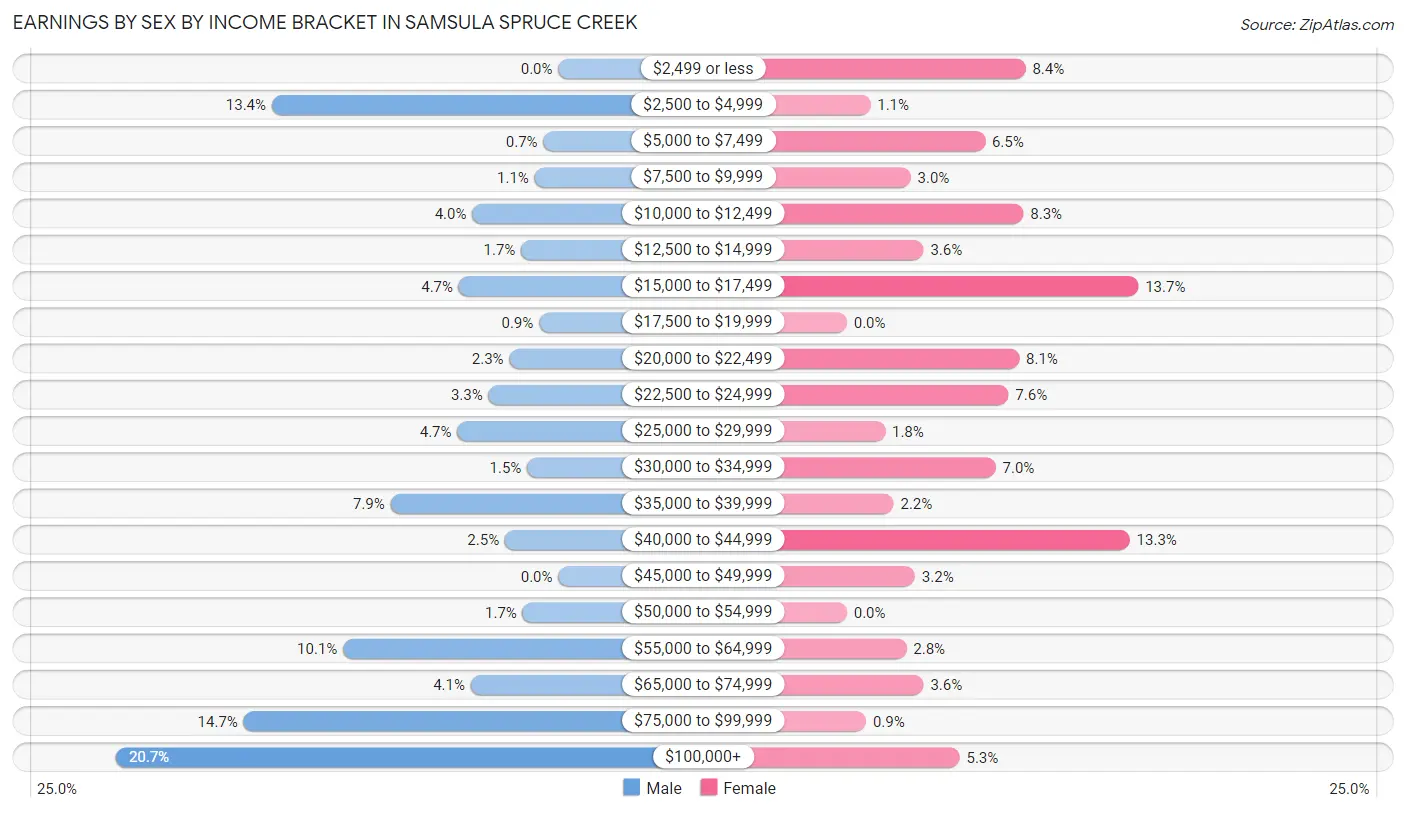
Earnings by Sex by Income Bracket in Samsula Spruce Creek
The most common earnings brackets in Samsula Spruce Creek are $100,000+ for men (298 | 20.7%) and $15,000 to $17,499 for women (137 | 13.7%).
| Income | Male | Female |
| $2,499 or less | 0 (0.0%) | 84 (8.4%) |
| $2,500 to $4,999 | 193 (13.4%) | 11 (1.1%) |
| $5,000 to $7,499 | 10 (0.7%) | 65 (6.5%) |
| $7,500 to $9,999 | 16 (1.1%) | 30 (3.0%) |
| $10,000 to $12,499 | 58 (4.0%) | 83 (8.3%) |
| $12,500 to $14,999 | 25 (1.7%) | 36 (3.6%) |
| $15,000 to $17,499 | 67 (4.7%) | 137 (13.7%) |
| $17,500 to $19,999 | 13 (0.9%) | 0 (0.0%) |
| $20,000 to $22,499 | 33 (2.3%) | 81 (8.1%) |
| $22,500 to $24,999 | 47 (3.3%) | 76 (7.6%) |
| $25,000 to $29,999 | 68 (4.7%) | 18 (1.8%) |
| $30,000 to $34,999 | 21 (1.5%) | 70 (7.0%) |
| $35,000 to $39,999 | 113 (7.9%) | 22 (2.2%) |
| $40,000 to $44,999 | 36 (2.5%) | 133 (13.3%) |
| $45,000 to $49,999 | 0 (0.0%) | 32 (3.2%) |
| $50,000 to $54,999 | 24 (1.7%) | 0 (0.0%) |
| $55,000 to $64,999 | 145 (10.1%) | 28 (2.8%) |
| $65,000 to $74,999 | 59 (4.1%) | 36 (3.6%) |
| $75,000 to $99,999 | 212 (14.7%) | 9 (0.9%) |
| $100,000+ | 298 (20.7%) | 53 (5.3%) |
| Total | 1,438 (100.0%) | 1,004 (100.0%) |
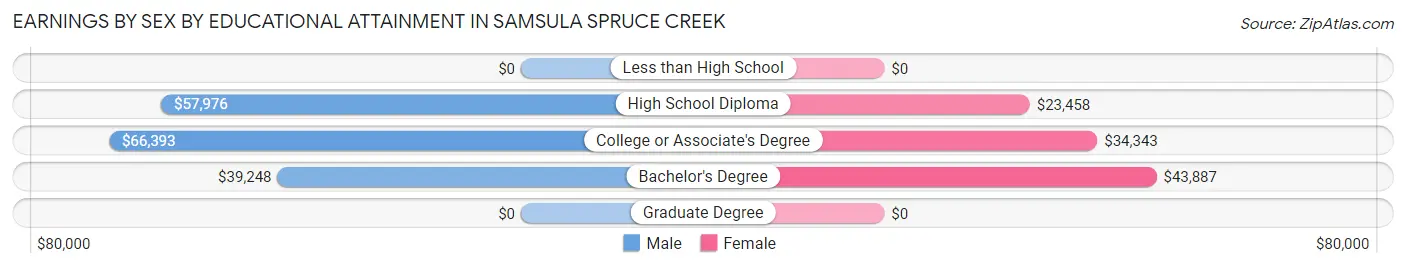
Earnings by Sex by Educational Attainment in Samsula Spruce Creek
Average earnings in Samsula Spruce Creek are $58,931 for men and $24,293 for women, a difference of 58.8%. Men with an educational attainment of college or associate's degree enjoy the highest average annual earnings of $66,393, while those with bachelor's degree education earn the least with $39,248. Women with an educational attainment of bachelor's degree earn the most with the average annual earnings of $43,887, while those with high school diploma education have the smallest earnings of $23,458.
| Educational Attainment | Male Income | Female Income |
| Less than High School | - | - |
| High School Diploma | $57,976 | $23,458 |
| College or Associate's Degree | $66,393 | $34,343 |
| Bachelor's Degree | $39,248 | $43,887 |
| Graduate Degree | - | - |
| Total | $58,931 | $24,293 |
Family Income in Samsula Spruce Creek
Family Income Brackets in Samsula Spruce Creek
According to the Samsula Spruce Creek family income data, there are 529 families falling into the $100,000 to $149,999 income range, which is the most common income bracket and makes up 31.0% of all families. Conversely, the $15,000 to $24,999 income bracket is the least frequent group with only 19 families (1.1%) belonging to this category.
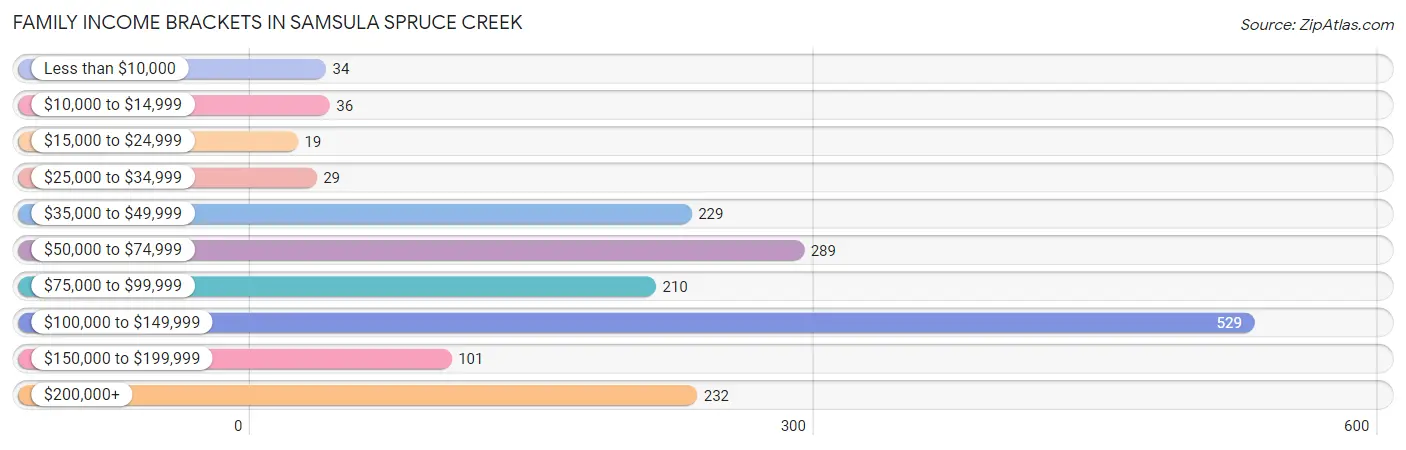
| Income Bracket | # Families | % Families |
| Less than $10,000 | 34 | 2.0% |
| $10,000 to $14,999 | 36 | 2.1% |
| $15,000 to $24,999 | 19 | 1.1% |
| $25,000 to $34,999 | 29 | 1.7% |
| $35,000 to $49,999 | 229 | 13.4% |
| $50,000 to $74,999 | 289 | 16.9% |
| $75,000 to $99,999 | 210 | 12.3% |
| $100,000 to $149,999 | 529 | 31.0% |
| $150,000 to $199,999 | 101 | 5.9% |
| $200,000+ | 232 | 13.6% |
Family Income by Famaliy Size in Samsula Spruce Creek
4-person families (129 | 7.5%) account for the highest median family income in Samsula Spruce Creek with $110,604 per family, while 2-person families (1,208 | 70.7%) have the highest median income of $50,686 per family member.
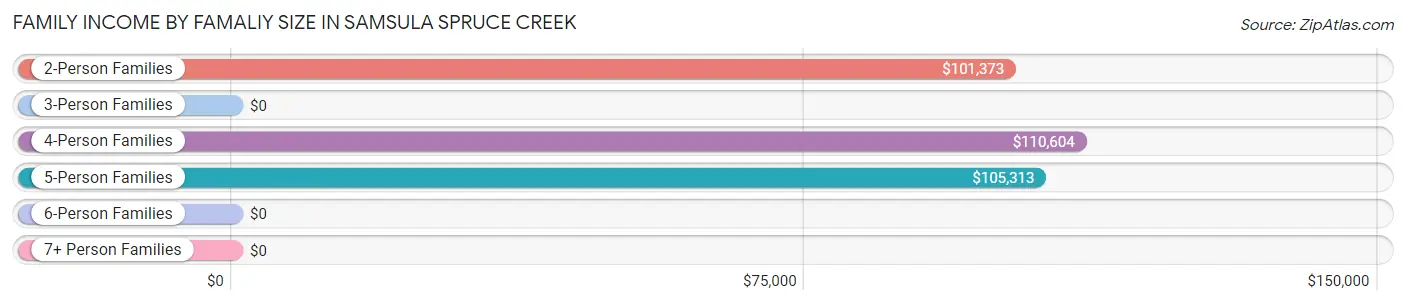
| Income Bracket | # Families | Median Income |
| 2-Person Families | 1,208 (70.7%) | $101,373 |
| 3-Person Families | 280 (16.4%) | $0 |
| 4-Person Families | 129 (7.5%) | $110,604 |
| 5-Person Families | 91 (5.3%) | $105,313 |
| 6-Person Families | 0 (0.0%) | $0 |
| 7+ Person Families | 0 (0.0%) | $0 |
| Total | 1,708 (100.0%) | $100,441 |
Family Income by Number of Earners in Samsula Spruce Creek
The median family income in Samsula Spruce Creek is $100,441, with families comprising 1 earner (565) having the highest median family income of $113,472, while families with no earners (487) have the lowest median family income of $68,229, accounting for 33.1% and 28.5% of families, respectively.
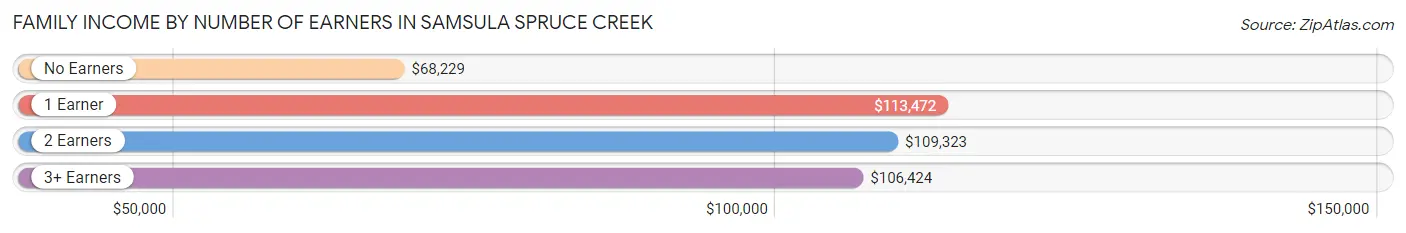
| Number of Earners | # Families | Median Income |
| No Earners | 487 (28.5%) | $68,229 |
| 1 Earner | 565 (33.1%) | $113,472 |
| 2 Earners | 515 (30.1%) | $109,323 |
| 3+ Earners | 141 (8.3%) | $106,424 |
| Total | 1,708 (100.0%) | $100,441 |
Household Income in Samsula Spruce Creek
Household Income Brackets in Samsula Spruce Creek
With 565 households falling in the category, the $100,000 to $149,999 income range is the most frequent in Samsula Spruce Creek, accounting for 26.1% of all households. In contrast, only 41 households (1.9%) fall into the $10,000 to $14,999 income bracket, making it the least populous group.
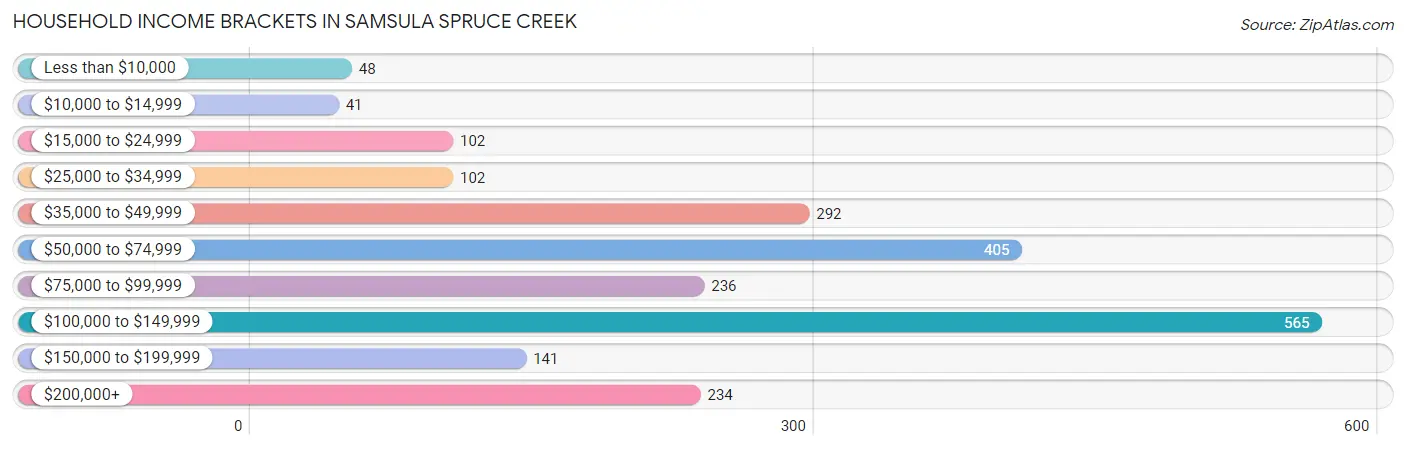
| Income Bracket | # Households | % Households |
| Less than $10,000 | 48 | 2.2% |
| $10,000 to $14,999 | 41 | 1.9% |
| $15,000 to $24,999 | 102 | 4.7% |
| $25,000 to $34,999 | 102 | 4.7% |
| $35,000 to $49,999 | 292 | 13.5% |
| $50,000 to $74,999 | 405 | 18.7% |
| $75,000 to $99,999 | 236 | 10.9% |
| $100,000 to $149,999 | 565 | 26.1% |
| $150,000 to $199,999 | 141 | 6.5% |
| $200,000+ | 234 | 10.8% |
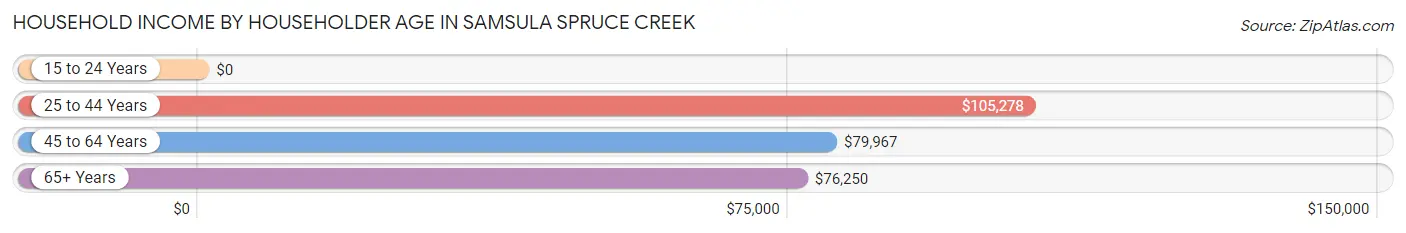
Household Income by Householder Age in Samsula Spruce Creek
The median household income in Samsula Spruce Creek is $81,484, with the highest median household income of $105,278 found in the 25 to 44 years age bracket for the primary householder. A total of 108 households (5.0%) fall into this category.
| Income Bracket | # Households | Median Income |
| 15 to 24 Years | 0 (0.0%) | $0 |
| 25 to 44 Years | 108 (5.0%) | $105,278 |
| 45 to 64 Years | 1,019 (47.1%) | $79,967 |
| 65+ Years | 1,038 (47.9%) | $76,250 |
| Total | 2,165 (100.0%) | $81,484 |
Poverty in Samsula Spruce Creek
Income Below Poverty by Sex and Age in Samsula Spruce Creek
With 3.5% poverty level for males and 9.3% for females among the residents of Samsula Spruce Creek, 25 to 34 year old males and 16 and 17 year old females are the most vulnerable to poverty, with 3 males (12.5%) and 59 females (59.0%) in their respective age groups living below the poverty level.
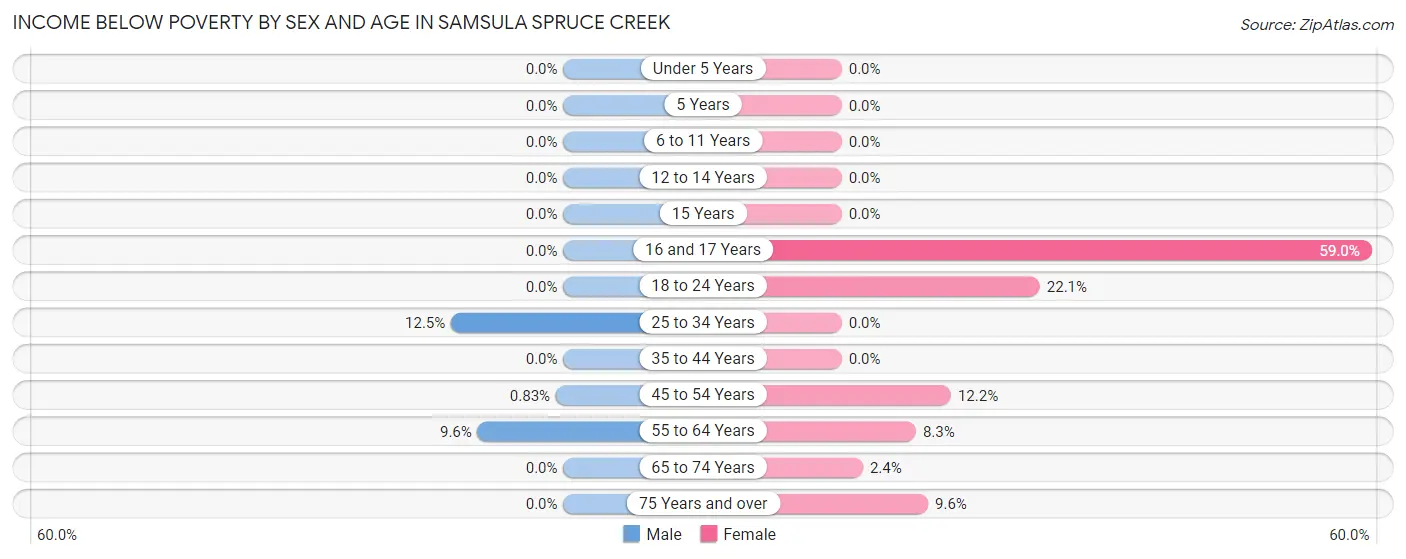
| Age Bracket | Male | Female |
| Under 5 Years | 0 (0.0%) | 0 (0.0%) |
| 5 Years | 0 (0.0%) | 0 (0.0%) |
| 6 to 11 Years | 0 (0.0%) | 0 (0.0%) |
| 12 to 14 Years | 0 (0.0%) | 0 (0.0%) |
| 15 Years | 0 (0.0%) | 0 (0.0%) |
| 16 and 17 Years | 0 (0.0%) | 59 (59.0%) |
| 18 to 24 Years | 0 (0.0%) | 45 (22.1%) |
| 25 to 34 Years | 3 (12.5%) | 0 (0.0%) |
| 35 to 44 Years | 0 (0.0%) | 0 (0.0%) |
| 45 to 54 Years | 2 (0.8%) | 36 (12.2%) |
| 55 to 64 Years | 78 (9.6%) | 64 (8.3%) |
| 65 to 74 Years | 0 (0.0%) | 14 (2.4%) |
| 75 Years and over | 0 (0.0%) | 42 (9.6%) |
| Total | 83 (3.5%) | 260 (9.3%) |
Income Above Poverty by Sex and Age in Samsula Spruce Creek
According to the poverty statistics in Samsula Spruce Creek, males aged 12 to 14 years and females aged under 5 years are the age groups that are most secure financially, with 100.0% of males and 100.0% of females in these age groups living above the poverty line.
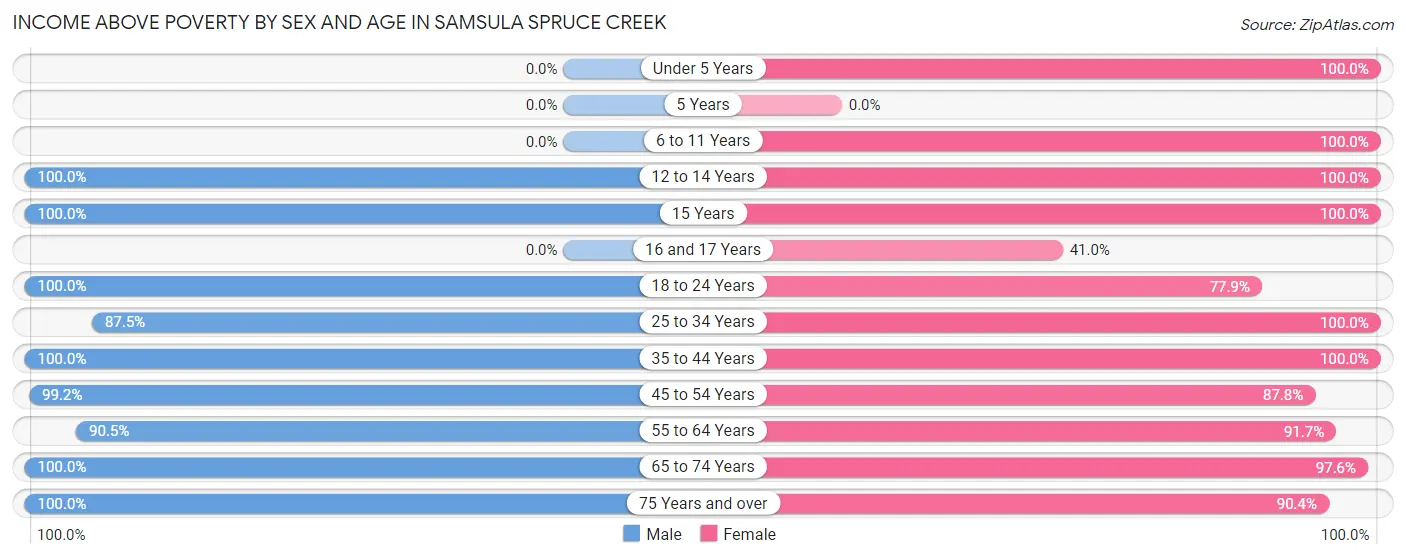
| Age Bracket | Male | Female |
| Under 5 Years | 0 (0.0%) | 42 (100.0%) |
| 5 Years | 0 (0.0%) | 0 (0.0%) |
| 6 to 11 Years | 0 (0.0%) | 40 (100.0%) |
| 12 to 14 Years | 85 (100.0%) | 25 (100.0%) |
| 15 Years | 33 (100.0%) | 59 (100.0%) |
| 16 and 17 Years | 0 (0.0%) | 41 (41.0%) |
| 18 to 24 Years | 187 (100.0%) | 159 (77.9%) |
| 25 to 34 Years | 21 (87.5%) | 136 (100.0%) |
| 35 to 44 Years | 36 (100.0%) | 89 (100.0%) |
| 45 to 54 Years | 238 (99.2%) | 260 (87.8%) |
| 55 to 64 Years | 739 (90.4%) | 711 (91.7%) |
| 65 to 74 Years | 531 (100.0%) | 578 (97.6%) |
| 75 Years and over | 389 (100.0%) | 395 (90.4%) |
| Total | 2,259 (96.5%) | 2,535 (90.7%) |
Income Below Poverty Among Married-Couple Families in Samsula Spruce Creek
The poverty statistics for married-couple families in Samsula Spruce Creek show that 2.2% or 34 of the total 1,519 families live below the poverty line. Families with no children have the highest poverty rate of 2.4%, comprising of 34 families. On the other hand, families with 1 or 2 children have the lowest poverty rate of 0.0%, which includes 0 families.
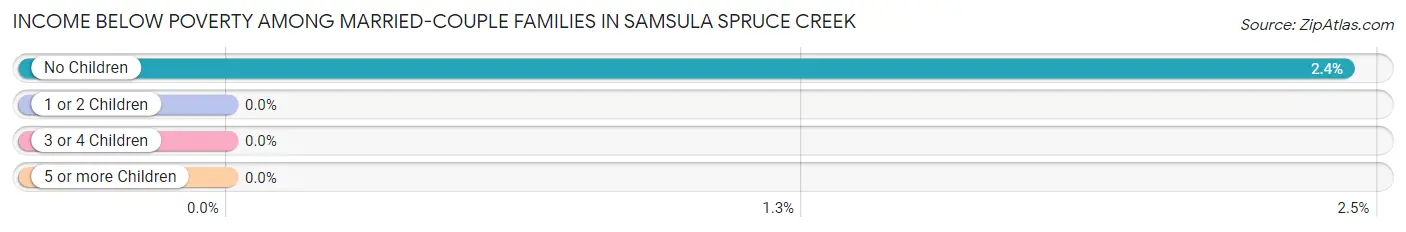
| Children | Above Poverty | Below Poverty |
| No Children | 1,363 (97.6%) | 34 (2.4%) |
| 1 or 2 Children | 106 (100.0%) | 0 (0.0%) |
| 3 or 4 Children | 16 (100.0%) | 0 (0.0%) |
| 5 or more Children | 0 (0.0%) | 0 (0.0%) |
| Total | 1,485 (97.8%) | 34 (2.2%) |
Income Below Poverty Among Single-Parent Households in Samsula Spruce Creek
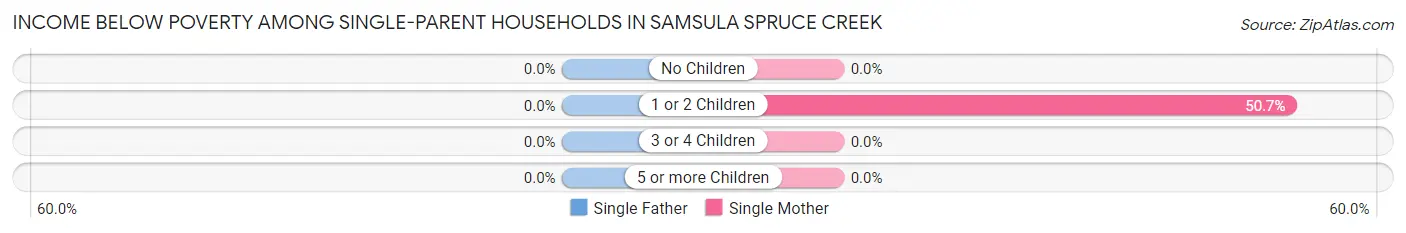
| Children | Single Father | Single Mother |
| No Children | 0 (0.0%) | 0 (0.0%) |
| 1 or 2 Children | 0 (0.0%) | 36 (50.7%) |
| 3 or 4 Children | 0 (0.0%) | 0 (0.0%) |
| 5 or more Children | 0 (0.0%) | 0 (0.0%) |
| Total | 0 (0.0%) | 36 (40.5%) |
Income Below Poverty Among Married-Couple vs Single-Parent Households in Samsula Spruce Creek
The poverty data for Samsula Spruce Creek shows that 34 of the married-couple family households (2.2%) and 36 of the single-parent households (19.1%) are living below the poverty level. Within the married-couple family households, those with no children have the highest poverty rate, with 34 households (2.4%) falling below the poverty line. Among the single-parent households, those with 1 or 2 children have the highest poverty rate, with 36 household (33.6%) living below poverty.
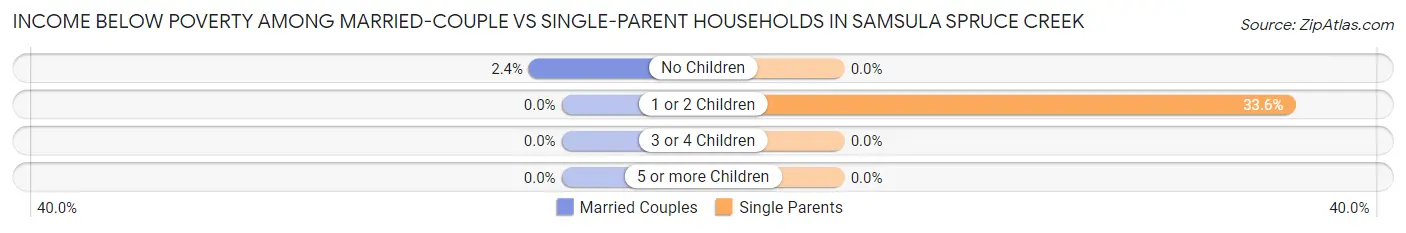
| Children | Married-Couple Families | Single-Parent Households |
| No Children | 34 (2.4%) | 0 (0.0%) |
| 1 or 2 Children | 0 (0.0%) | 36 (33.6%) |
| 3 or 4 Children | 0 (0.0%) | 0 (0.0%) |
| 5 or more Children | 0 (0.0%) | 0 (0.0%) |
| Total | 34 (2.2%) | 36 (19.1%) |
Race in Samsula Spruce Creek
The most populous races in Samsula Spruce Creek are White / Caucasian (4,977 | 96.9%), Hispanic or Latino (140 | 2.7%), and Two or more Races (139 | 2.7%).
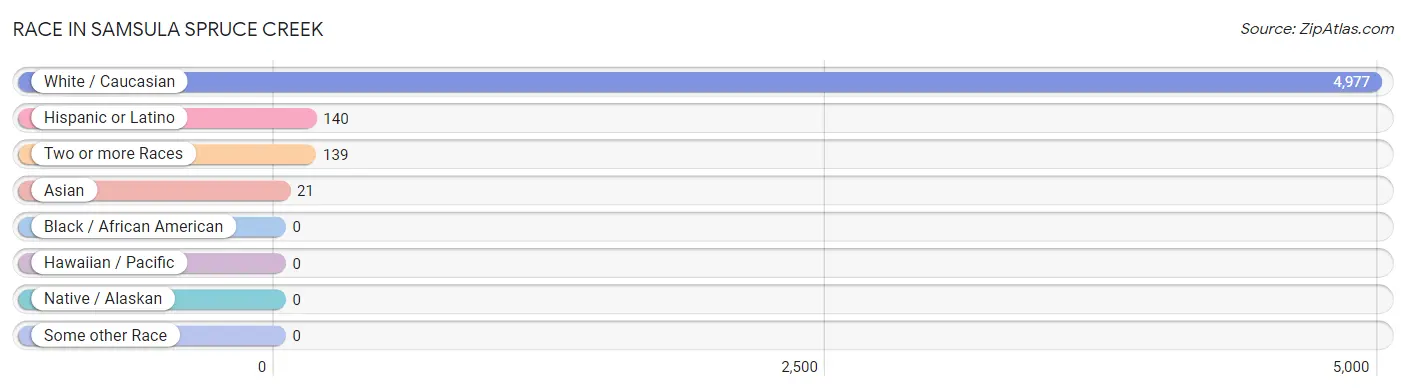
| Race | # Population | % Population |
| Asian | 21 | 0.4% |
| Black / African American | 0 | 0.0% |
| Hawaiian / Pacific | 0 | 0.0% |
| Hispanic or Latino | 140 | 2.7% |
| Native / Alaskan | 0 | 0.0% |
| White / Caucasian | 4,977 | 96.9% |
| Two or more Races | 139 | 2.7% |
| Some other Race | 0 | 0.0% |
| Total | 5,137 | 100.0% |
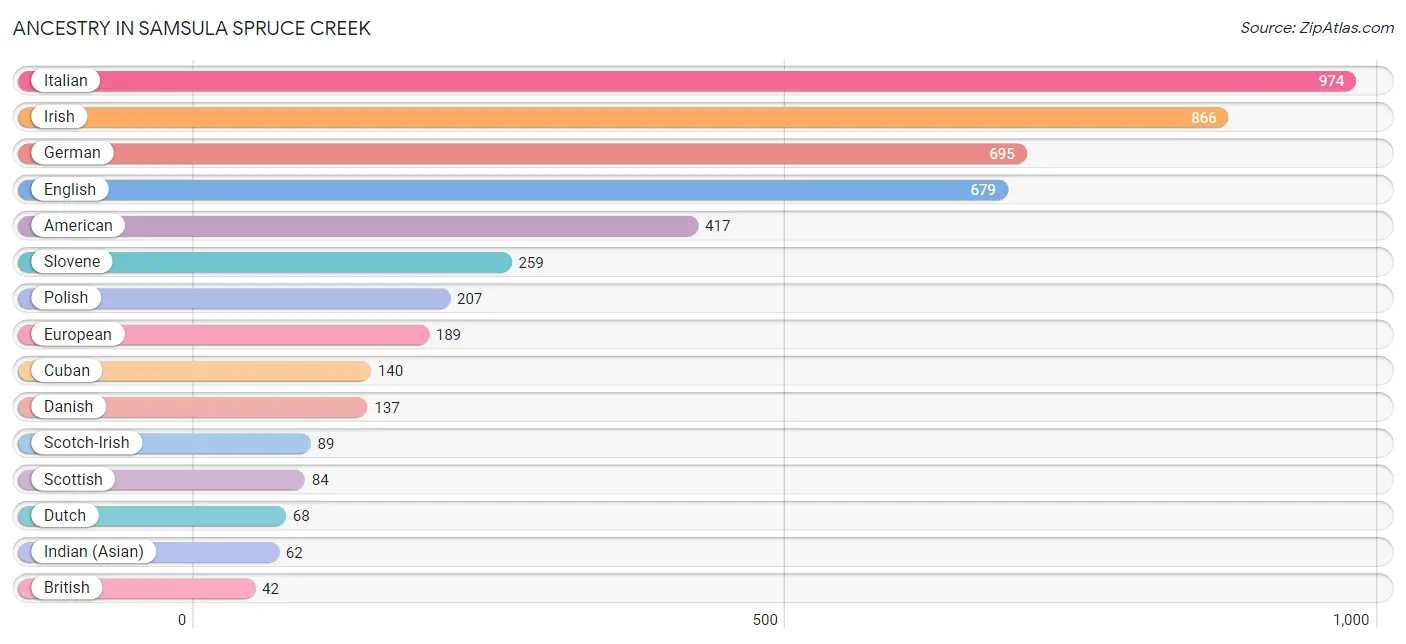
Ancestry in Samsula Spruce Creek
The most populous ancestries reported in Samsula Spruce Creek are Italian (974 | 19.0%), Irish (866 | 16.9%), German (695 | 13.5%), English (679 | 13.2%), and American (417 | 8.1%), together accounting for 70.7% of all Samsula Spruce Creek residents.
| Ancestry | # Population | % Population |
| American | 417 | 8.1% |
| British | 42 | 0.8% |
| Canadian | 41 | 0.8% |
| Cuban | 140 | 2.7% |
| Czechoslovakian | 27 | 0.5% |
| Danish | 137 | 2.7% |
| Dutch | 68 | 1.3% |
| Eastern European | 27 | 0.5% |
| English | 679 | 13.2% |
| European | 189 | 3.7% |
| French | 28 | 0.5% |
| French Canadian | 9 | 0.2% |
| German | 695 | 13.5% |
| Hungarian | 32 | 0.6% |
| Indian (Asian) | 62 | 1.2% |
| Irish | 866 | 16.9% |
| Iroquois | 17 | 0.3% |
| Italian | 974 | 19.0% |
| Lithuanian | 10 | 0.2% |
| New Zealander | 31 | 0.6% |
| Norwegian | 39 | 0.8% |
| Polish | 207 | 4.0% |
| Russian | 35 | 0.7% |
| Scotch-Irish | 89 | 1.7% |
| Scottish | 84 | 1.6% |
| Slavic | 11 | 0.2% |
| Slovene | 259 | 5.0% |
| Swedish | 31 | 0.6% |
| Swiss | 34 | 0.7% |
| Welsh | 26 | 0.5% | View All 30 Rows |
Immigrants in Samsula Spruce Creek
The most numerous immigrant groups reported in Samsula Spruce Creek came from Europe (194 | 3.8%), Canada (184 | 3.6%), Italy (82 | 1.6%), Southern Europe (82 | 1.6%), and Western Europe (79 | 1.5%), together accounting for 12.1% of all Samsula Spruce Creek residents.
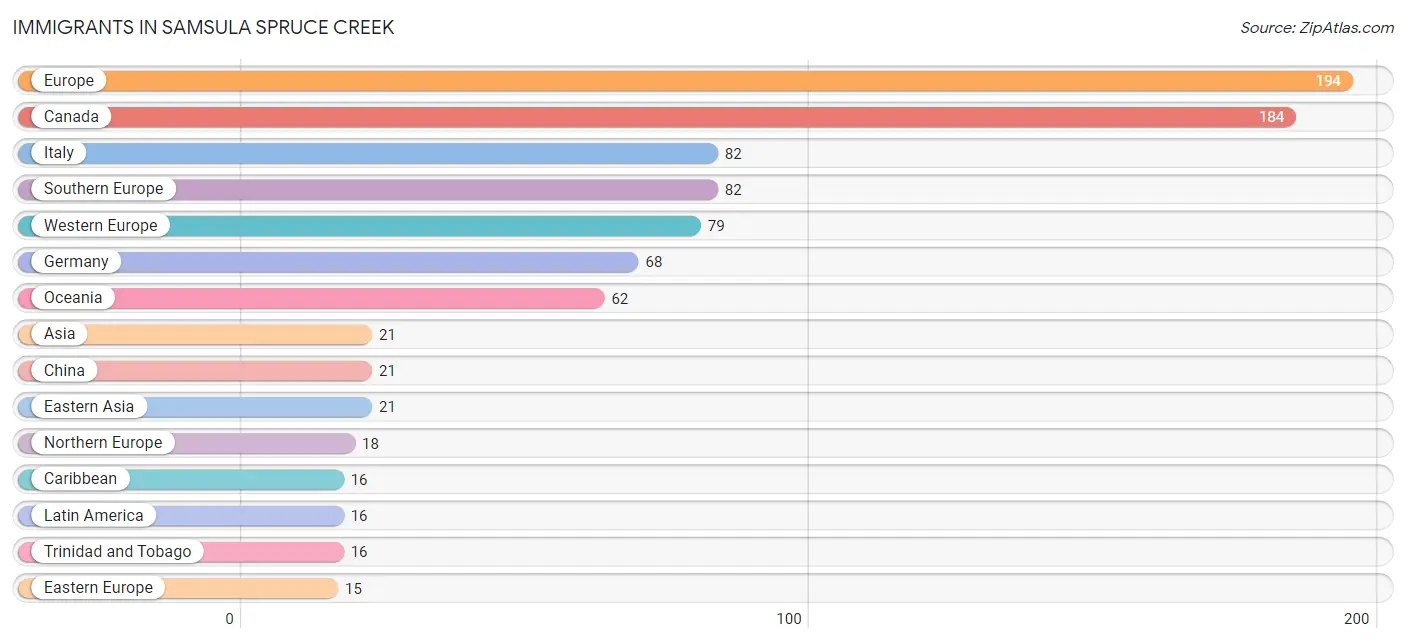
| Immigration Origin | # Population | % Population |
| Africa | 14 | 0.3% |
| Asia | 21 | 0.4% |
| Canada | 184 | 3.6% |
| Caribbean | 16 | 0.3% |
| China | 21 | 0.4% |
| Eastern Asia | 21 | 0.4% |
| Eastern Europe | 15 | 0.3% |
| Europe | 194 | 3.8% |
| Germany | 68 | 1.3% |
| Italy | 82 | 1.6% |
| Latin America | 16 | 0.3% |
| Northern Europe | 18 | 0.4% |
| Oceania | 62 | 1.2% |
| Russia | 15 | 0.3% |
| South Africa | 14 | 0.3% |
| Southern Europe | 82 | 1.6% |
| Switzerland | 11 | 0.2% |
| Trinidad and Tobago | 16 | 0.3% |
| Western Europe | 79 | 1.5% | View All 19 Rows |
Sex and Age in Samsula Spruce Creek
Sex and Age in Samsula Spruce Creek
The most populous age groups in Samsula Spruce Creek are 55 to 59 Years (466 | 19.9%) for men and 65 to 69 Years (414 | 14.8%) for women.
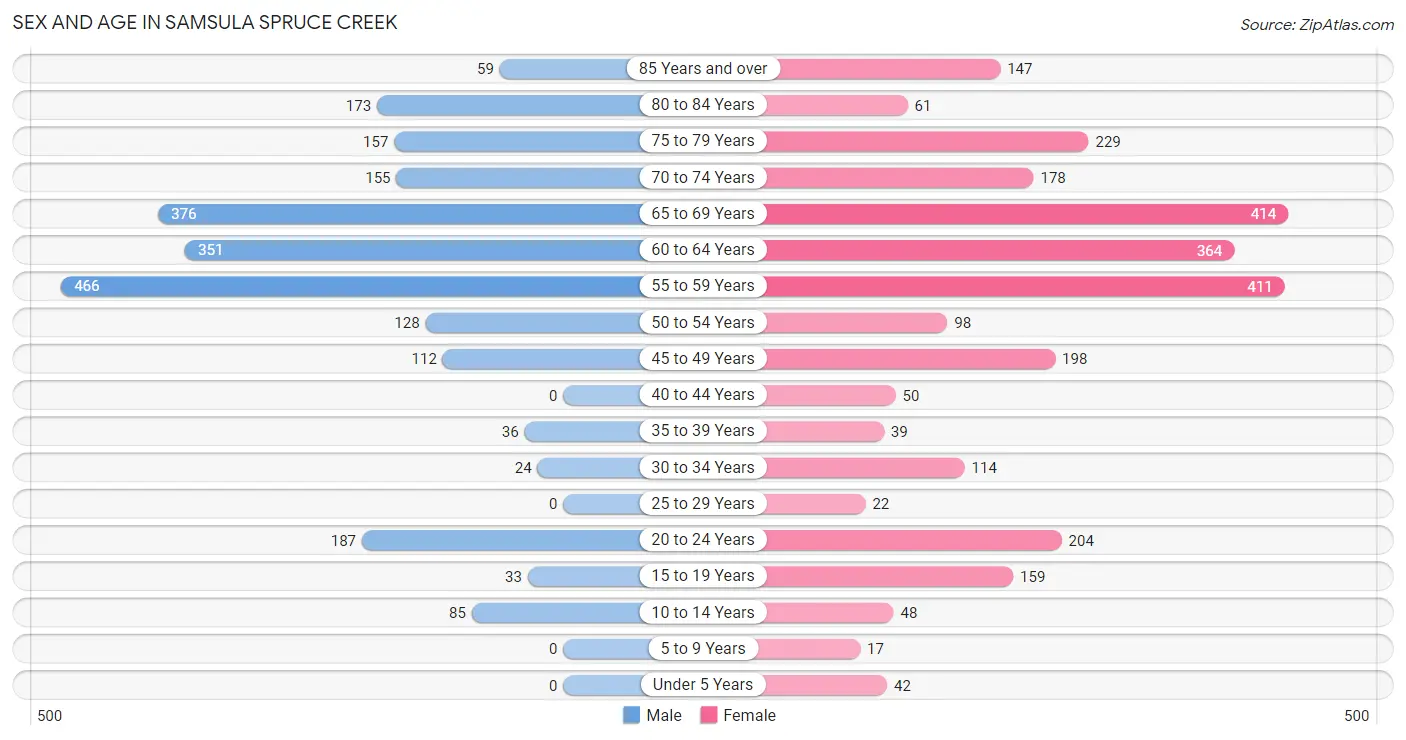
| Age Bracket | Male | Female |
| Under 5 Years | 0 (0.0%) | 42 (1.5%) |
| 5 to 9 Years | 0 (0.0%) | 17 (0.6%) |
| 10 to 14 Years | 85 (3.6%) | 48 (1.7%) |
| 15 to 19 Years | 33 (1.4%) | 159 (5.7%) |
| 20 to 24 Years | 187 (8.0%) | 204 (7.3%) |
| 25 to 29 Years | 0 (0.0%) | 22 (0.8%) |
| 30 to 34 Years | 24 (1.0%) | 114 (4.1%) |
| 35 to 39 Years | 36 (1.5%) | 39 (1.4%) |
| 40 to 44 Years | 0 (0.0%) | 50 (1.8%) |
| 45 to 49 Years | 112 (4.8%) | 198 (7.1%) |
| 50 to 54 Years | 128 (5.5%) | 98 (3.5%) |
| 55 to 59 Years | 466 (19.9%) | 411 (14.7%) |
| 60 to 64 Years | 351 (15.0%) | 364 (13.0%) |
| 65 to 69 Years | 376 (16.1%) | 414 (14.8%) |
| 70 to 74 Years | 155 (6.6%) | 178 (6.4%) |
| 75 to 79 Years | 157 (6.7%) | 229 (8.2%) |
| 80 to 84 Years | 173 (7.4%) | 61 (2.2%) |
| 85 Years and over | 59 (2.5%) | 147 (5.3%) |
| Total | 2,342 (100.0%) | 2,795 (100.0%) |
Families and Households in Samsula Spruce Creek
Median Family Size in Samsula Spruce Creek
The median family size in Samsula Spruce Creek is 2.62 persons per family, with single male/father families (100 | 5.9%) accounting for the largest median family size of 3.42 persons per family. On the other hand, married-couple families (1,519 | 88.9%) represent the smallest median family size with 2.56 persons per family.
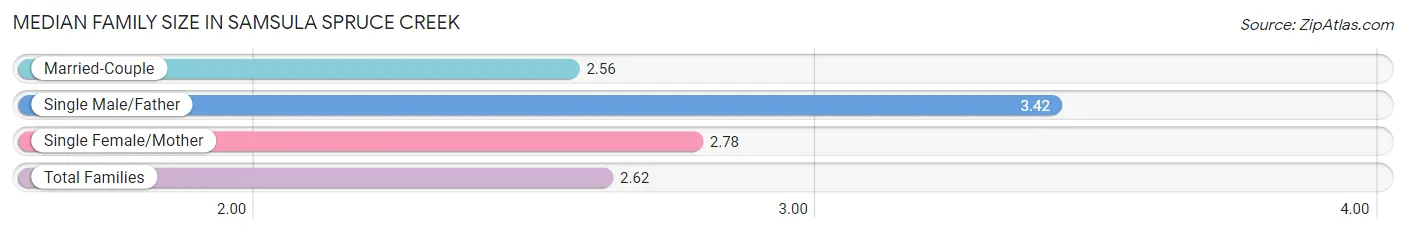
| Family Type | # Families | Family Size |
| Married-Couple | 1,519 (88.9%) | 2.56 |
| Single Male/Father | 100 (5.9%) | 3.42 |
| Single Female/Mother | 89 (5.2%) | 2.78 |
| Total Families | 1,708 (100.0%) | 2.62 |
Median Household Size in Samsula Spruce Creek
The median household size in Samsula Spruce Creek is 2.37 persons per household, with single male/father households (100 | 4.6%) accounting for the largest median household size of 3.68 persons per household. non-family households (457 | 21.1%) represent the smallest median household size with 1.19 persons per household.
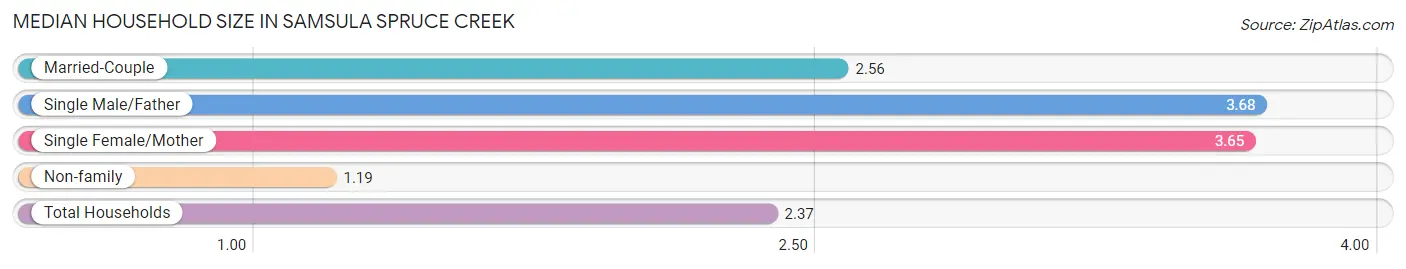
| Household Type | # Households | Household Size |
| Married-Couple | 1,519 (70.2%) | 2.56 |
| Single Male/Father | 100 (4.6%) | 3.68 |
| Single Female/Mother | 89 (4.1%) | 3.65 |
| Non-family | 457 (21.1%) | 1.19 |
| Total Households | 2,165 (100.0%) | 2.37 |
Household Size by Marriage Status in Samsula Spruce Creek
Out of a total of 2,165 households in Samsula Spruce Creek, 1,708 (78.9%) are family households, while 457 (21.1%) are nonfamily households. The most numerous type of family households are 2-person households, comprising 1,148, and the most common type of nonfamily households are 1-person households, comprising 371.
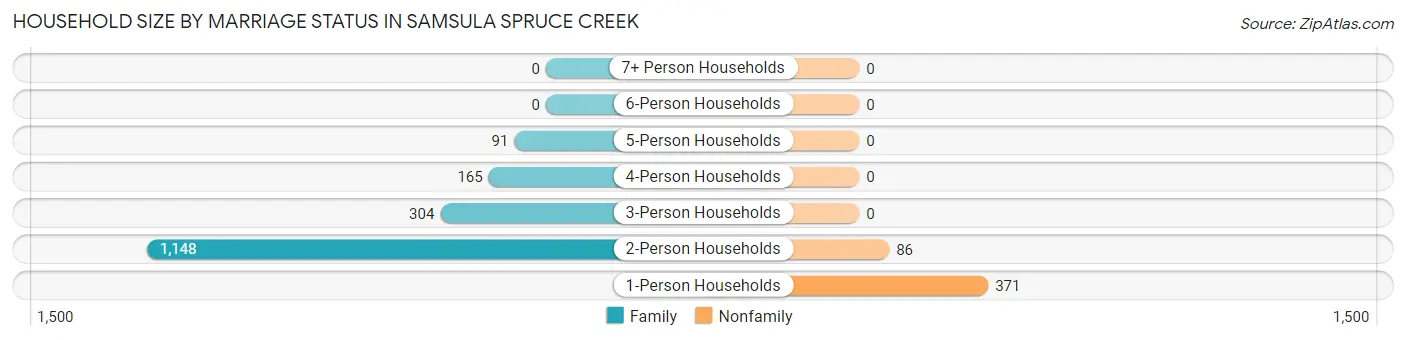
| Household Size | Family Households | Nonfamily Households |
| 1-Person Households | - | 371 (17.1%) |
| 2-Person Households | 1,148 (53.0%) | 86 (4.0%) |
| 3-Person Households | 304 (14.0%) | 0 (0.0%) |
| 4-Person Households | 165 (7.6%) | 0 (0.0%) |
| 5-Person Households | 91 (4.2%) | 0 (0.0%) |
| 6-Person Households | 0 (0.0%) | 0 (0.0%) |
| 7+ Person Households | 0 (0.0%) | 0 (0.0%) |
| Total | 1,708 (78.9%) | 457 (21.1%) |
Female Fertility in Samsula Spruce Creek
Fertility by Age in Samsula Spruce Creek
| Age Bracket | Women with Births | Births / 1,000 Women |
| 15 to 19 years | 0 (0.0%) | 0.0 |
| 20 to 34 years | 0 (0.0%) | 0.0 |
| 35 to 50 years | 0 (0.0%) | 0.0 |
| Total | 0 (0.0%) | 0.0 |
Fertility by Age by Marriage Status in Samsula Spruce Creek
| Age Bracket | Married | Unmarried |
| 15 to 19 years | 0 (0.0%) | 0 (0.0%) |
| 20 to 34 years | 0 (0.0%) | 0 (0.0%) |
| 35 to 50 years | 0 (0.0%) | 0 (0.0%) |
| Total | 0 (0.0%) | 0 (0.0%) |
Fertility by Education in Samsula Spruce Creek
| Educational Attainment | Women with Births | Births / 1,000 Women |
| Less than High School | 0 (0.0%) | 0.0 |
| High School Diploma | 0 (0.0%) | 0.0 |
| College or Associate's Degree | 0 (0.0%) | 0.0 |
| Bachelor's Degree | 0 (0.0%) | 0.0 |
| Graduate Degree | 0 (0.0%) | 0.0 |
| Total | 0 (0.0%) | 0.0 |
Fertility by Education by Marriage Status in Samsula Spruce Creek
| Educational Attainment | Married | Unmarried |
| Less than High School | 0 (0.0%) | 0 (0.0%) |
| High School Diploma | 0 (0.0%) | 0 (0.0%) |
| College or Associate's Degree | 0 (0.0%) | 0 (0.0%) |
| Bachelor's Degree | 0 (0.0%) | 0 (0.0%) |
| Graduate Degree | 0 (0.0%) | 0 (0.0%) |
| Total | 0 (0.0%) | 0 (0.0%) |
Employment Characteristics in Samsula Spruce Creek
Employment by Class of Employer in Samsula Spruce Creek
Among the 2,062 employed individuals in Samsula Spruce Creek, private company employees (1,367 | 66.3%), self-employed (not incorporated) (208 | 10.1%), and state government employees (197 | 9.6%) make up the most common classes of employment.
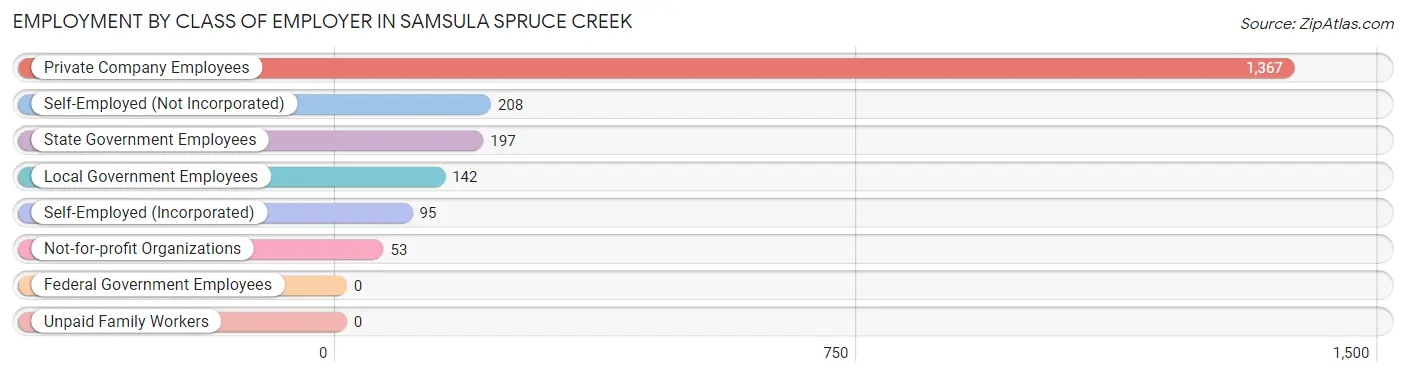
| Employer Class | # Employees | % Employees |
| Private Company Employees | 1,367 | 66.3% |
| Self-Employed (Incorporated) | 95 | 4.6% |
| Self-Employed (Not Incorporated) | 208 | 10.1% |
| Not-for-profit Organizations | 53 | 2.6% |
| Local Government Employees | 142 | 6.9% |
| State Government Employees | 197 | 9.6% |
| Federal Government Employees | 0 | 0.0% |
| Unpaid Family Workers | 0 | 0.0% |
| Total | 2,062 | 100.0% |
Employment Status by Age in Samsula Spruce Creek
According to the labor force statistics for Samsula Spruce Creek, out of the total population over 16 years of age (4,853), 44.5% or 2,160 individuals are in the labor force, with 1.3% or 28 of them unemployed. The age group with the highest labor force participation rate is 25 to 29 years, with 100.0% or 22 individuals in the labor force. Within the labor force, the 65 to 74 years age range has the highest percentage of unemployed individuals, with 4.5% or 14 of them being unemployed.
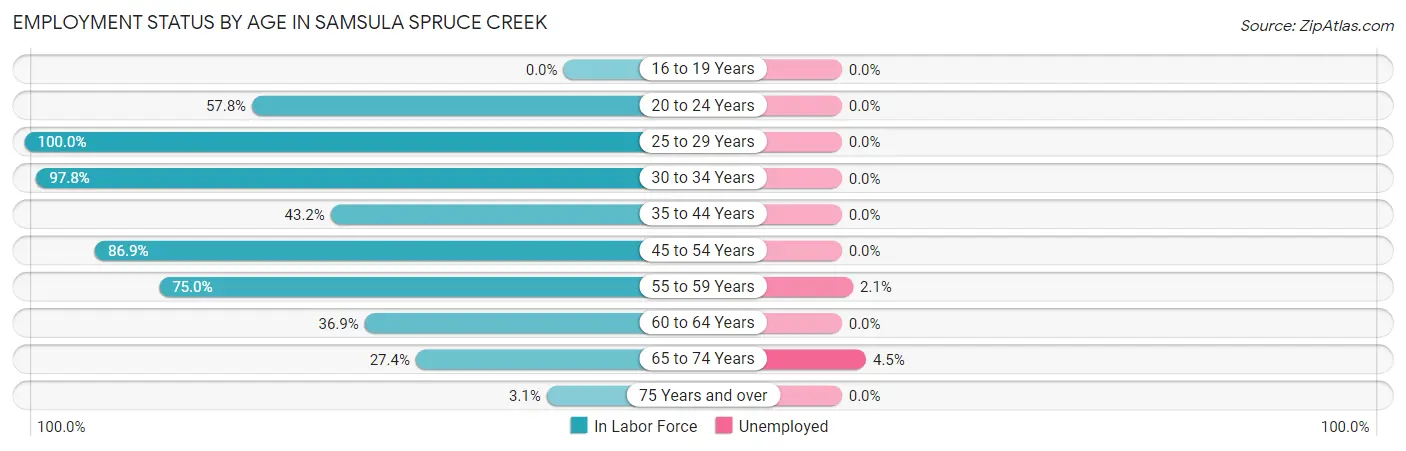
| Age Bracket | In Labor Force | Unemployed |
| 16 to 19 Years | 0 (0.0%) | 0 (0.0%) |
| 20 to 24 Years | 226 (57.8%) | 0 (0.0%) |
| 25 to 29 Years | 22 (100.0%) | 0 (0.0%) |
| 30 to 34 Years | 135 (97.8%) | 0 (0.0%) |
| 35 to 44 Years | 54 (43.2%) | 0 (0.0%) |
| 45 to 54 Years | 466 (86.9%) | 0 (0.0%) |
| 55 to 59 Years | 658 (75.0%) | 14 (2.1%) |
| 60 to 64 Years | 264 (36.9%) | 0 (0.0%) |
| 65 to 74 Years | 308 (27.4%) | 14 (4.5%) |
| 75 Years and over | 26 (3.1%) | 0 (0.0%) |
| Total | 2,160 (44.5%) | 28 (1.3%) |
Employment Status by Educational Attainment in Samsula Spruce Creek
According to labor force statistics for Samsula Spruce Creek, 66.3% of individuals (1,600) out of the total population between 25 and 64 years of age (2,413) are in the labor force, with 0.9% or 14 of them being unemployed. The group with the highest labor force participation rate are those with the educational attainment of high school diploma, with 84.5% or 425 individuals in the labor force. Within the labor force, individuals with less than high school education have the highest percentage of unemployment, with 17.1% or 14 of them being unemployed.
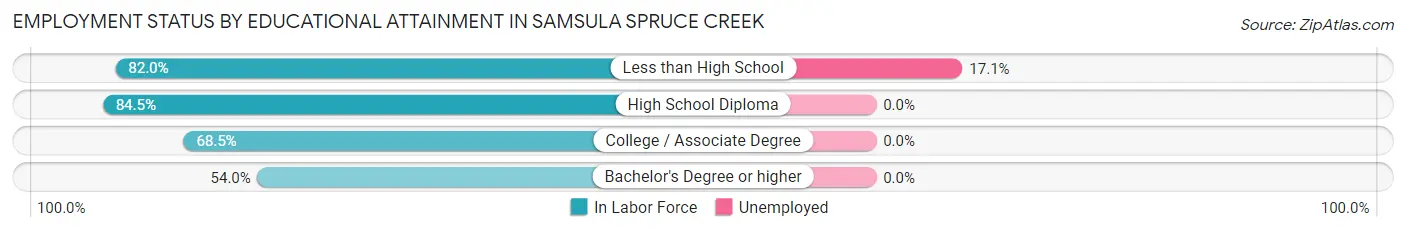
| Educational Attainment | In Labor Force | Unemployed |
| Less than High School | 82 (82.0%) | 17 (17.1%) |
| High School Diploma | 425 (84.5%) | 0 (0.0%) |
| College / Associate Degree | 538 (68.5%) | 0 (0.0%) |
| Bachelor's Degree or higher | 554 (54.0%) | 0 (0.0%) |
| Total | 1,600 (66.3%) | 22 (0.9%) |
Employment Occupations by Sex in Samsula Spruce Creek
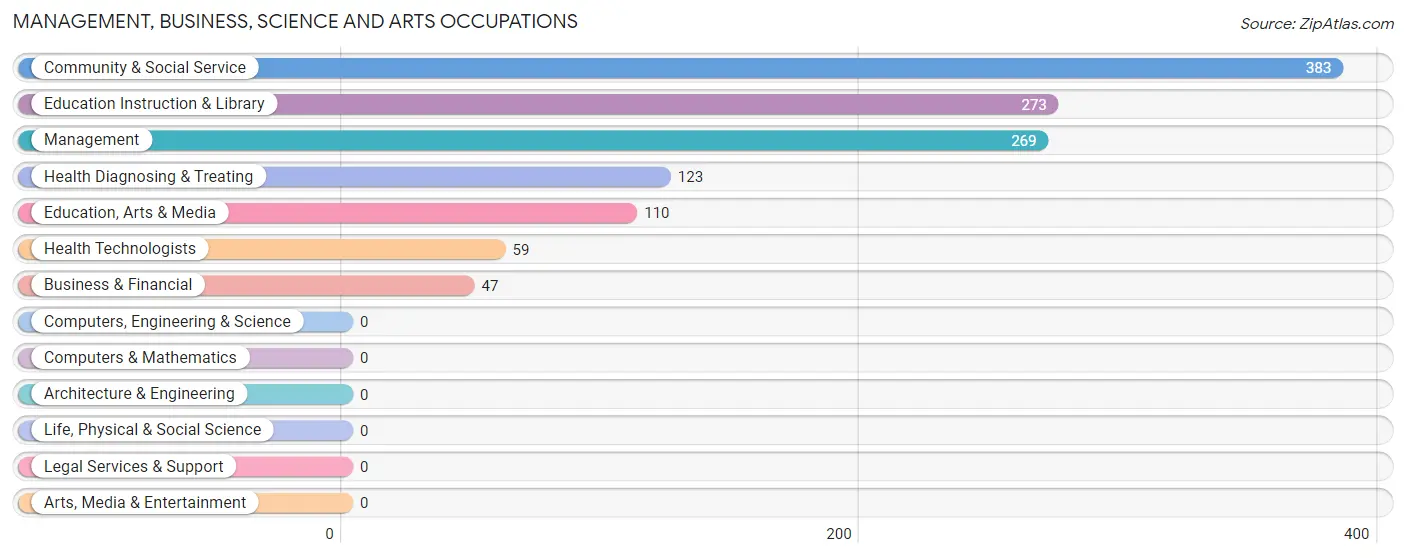
Management, Business, Science and Arts Occupations
The most common Management, Business, Science and Arts occupations in Samsula Spruce Creek are Community & Social Service (383 | 18.0%), Education Instruction & Library (273 | 12.8%), Management (269 | 12.6%), Health Diagnosing & Treating (123 | 5.8%), and Education, Arts & Media (110 | 5.2%).
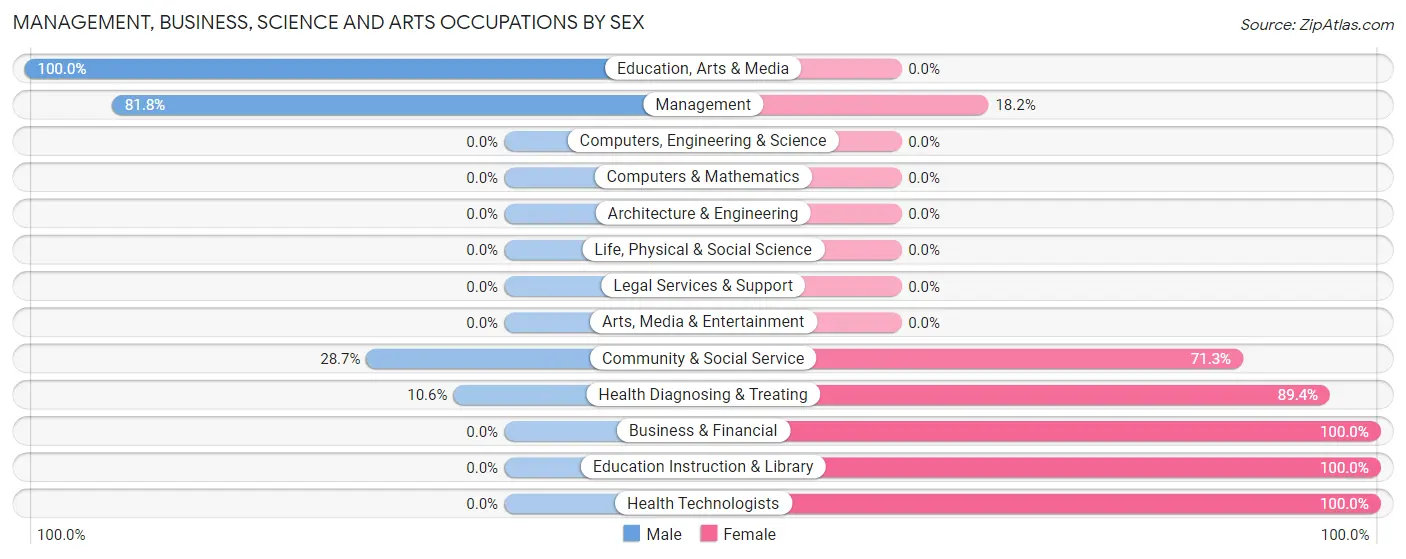
Management, Business, Science and Arts Occupations by Sex
Within the Management, Business, Science and Arts occupations in Samsula Spruce Creek, the most male-oriented occupations are Education, Arts & Media (100.0%), Management (81.8%), and Community & Social Service (28.7%), while the most female-oriented occupations are Business & Financial (100.0%), Education Instruction & Library (100.0%), and Health Technologists (100.0%).
| Occupation | Male | Female |
| Management | 220 (81.8%) | 49 (18.2%) |
| Business & Financial | 0 (0.0%) | 47 (100.0%) |
| Computers, Engineering & Science | 0 (0.0%) | 0 (0.0%) |
| Computers & Mathematics | 0 (0.0%) | 0 (0.0%) |
| Architecture & Engineering | 0 (0.0%) | 0 (0.0%) |
| Life, Physical & Social Science | 0 (0.0%) | 0 (0.0%) |
| Community & Social Service | 110 (28.7%) | 273 (71.3%) |
| Education, Arts & Media | 110 (100.0%) | 0 (0.0%) |
| Legal Services & Support | 0 (0.0%) | 0 (0.0%) |
| Education Instruction & Library | 0 (0.0%) | 273 (100.0%) |
| Arts, Media & Entertainment | 0 (0.0%) | 0 (0.0%) |
| Health Diagnosing & Treating | 13 (10.6%) | 110 (89.4%) |
| Health Technologists | 0 (0.0%) | 59 (100.0%) |
| Total (Category) | 343 (41.7%) | 479 (58.3%) |
| Total (Overall) | 1,179 (55.3%) | 952 (44.7%) |
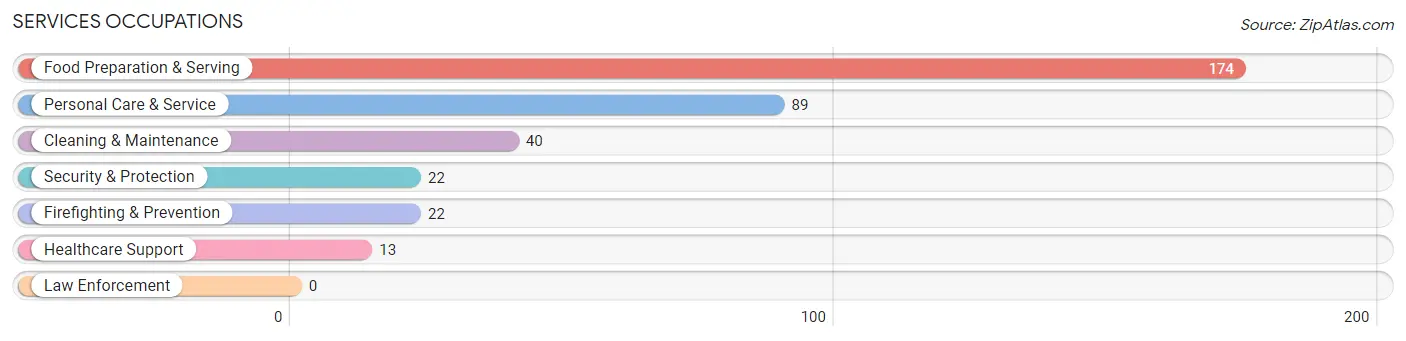
Services Occupations
The most common Services occupations in Samsula Spruce Creek are Food Preparation & Serving (174 | 8.2%), Personal Care & Service (89 | 4.2%), Cleaning & Maintenance (40 | 1.9%), Security & Protection (22 | 1.0%), and Firefighting & Prevention (22 | 1.0%).
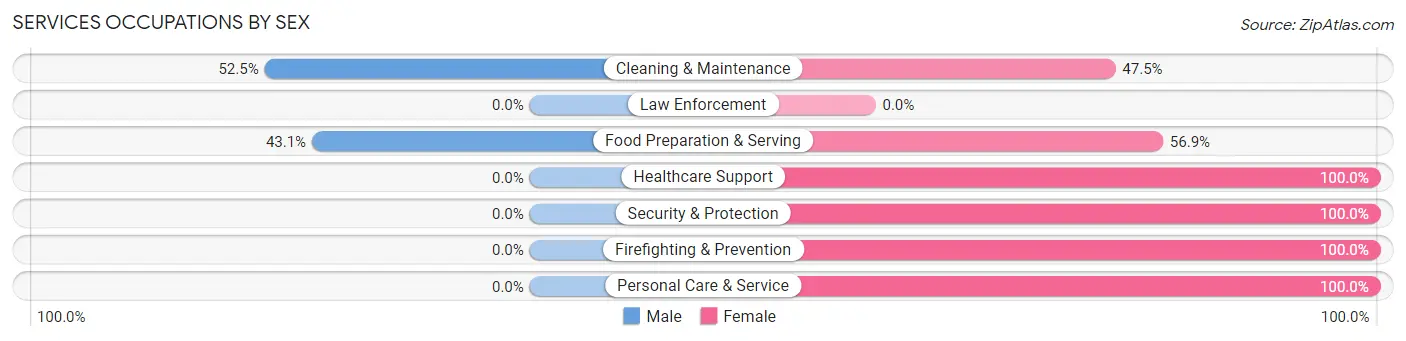
Services Occupations by Sex
Within the Services occupations in Samsula Spruce Creek, the most male-oriented occupations are Cleaning & Maintenance (52.5%), and Food Preparation & Serving (43.1%), while the most female-oriented occupations are Healthcare Support (100.0%), Security & Protection (100.0%), and Firefighting & Prevention (100.0%).
| Occupation | Male | Female |
| Healthcare Support | 0 (0.0%) | 13 (100.0%) |
| Security & Protection | 0 (0.0%) | 22 (100.0%) |
| Firefighting & Prevention | 0 (0.0%) | 22 (100.0%) |
| Law Enforcement | 0 (0.0%) | 0 (0.0%) |
| Food Preparation & Serving | 75 (43.1%) | 99 (56.9%) |
| Cleaning & Maintenance | 21 (52.5%) | 19 (47.5%) |
| Personal Care & Service | 0 (0.0%) | 89 (100.0%) |
| Total (Category) | 96 (28.4%) | 242 (71.6%) |
| Total (Overall) | 1,179 (55.3%) | 952 (44.7%) |
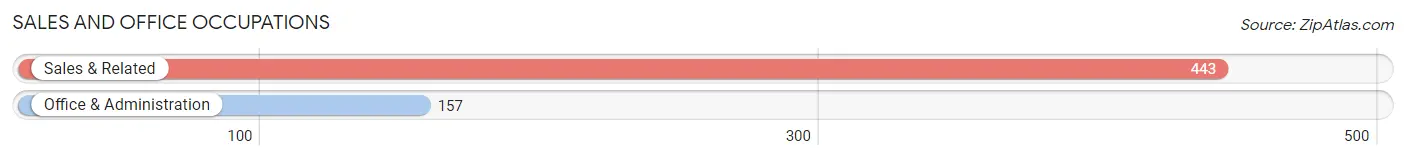
Sales and Office Occupations
The most common Sales and Office occupations in Samsula Spruce Creek are Sales & Related (443 | 20.8%), and Office & Administration (157 | 7.4%).
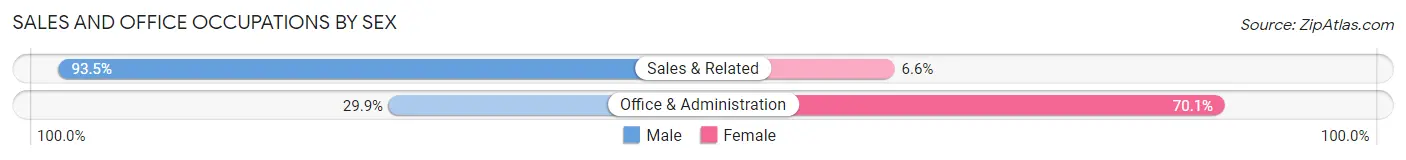
Sales and Office Occupations by Sex
| Occupation | Male | Female |
| Sales & Related | 414 (93.4%) | 29 (6.6%) |
| Office & Administration | 47 (29.9%) | 110 (70.1%) |
| Total (Category) | 461 (76.8%) | 139 (23.2%) |
| Total (Overall) | 1,179 (55.3%) | 952 (44.7%) |
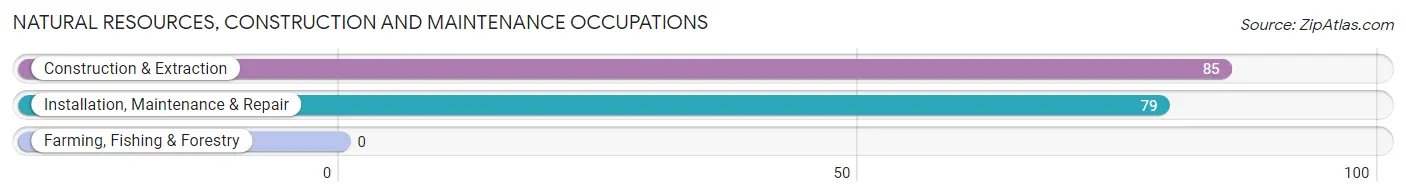
Natural Resources, Construction and Maintenance Occupations
The most common Natural Resources, Construction and Maintenance occupations in Samsula Spruce Creek are Construction & Extraction (85 | 4.0%), and Installation, Maintenance & Repair (79 | 3.7%).
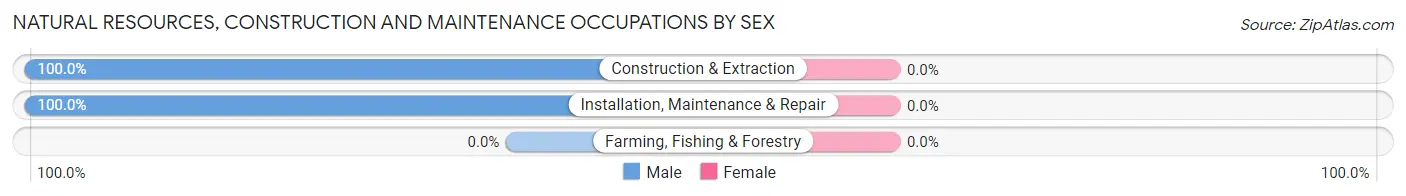
Natural Resources, Construction and Maintenance Occupations by Sex
| Occupation | Male | Female |
| Farming, Fishing & Forestry | 0 (0.0%) | 0 (0.0%) |
| Construction & Extraction | 85 (100.0%) | 0 (0.0%) |
| Installation, Maintenance & Repair | 79 (100.0%) | 0 (0.0%) |
| Total (Category) | 164 (100.0%) | 0 (0.0%) |
| Total (Overall) | 1,179 (55.3%) | 952 (44.7%) |
Production, Transportation and Moving Occupations
The most common Production, Transportation and Moving occupations in Samsula Spruce Creek are Production (105 | 4.9%), and Transportation (102 | 4.8%).
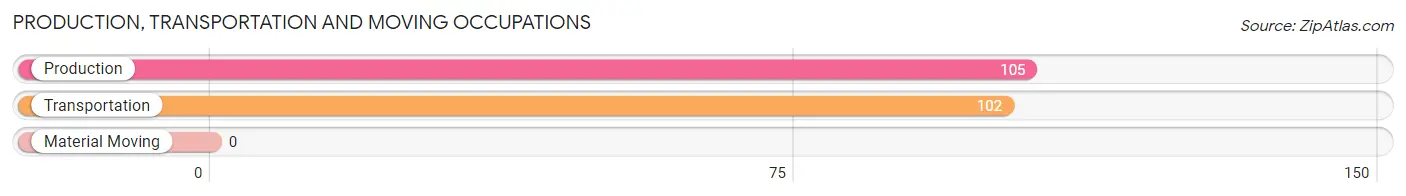
Production, Transportation and Moving Occupations by Sex
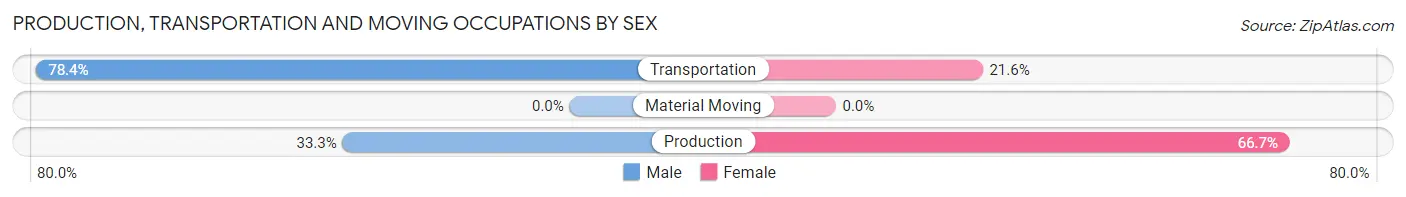
| Occupation | Male | Female |
| Production | 35 (33.3%) | 70 (66.7%) |
| Transportation | 80 (78.4%) | 22 (21.6%) |
| Material Moving | 0 (0.0%) | 0 (0.0%) |
| Total (Category) | 115 (55.6%) | 92 (44.4%) |
| Total (Overall) | 1,179 (55.3%) | 952 (44.7%) |
Employment Industries by Sex in Samsula Spruce Creek
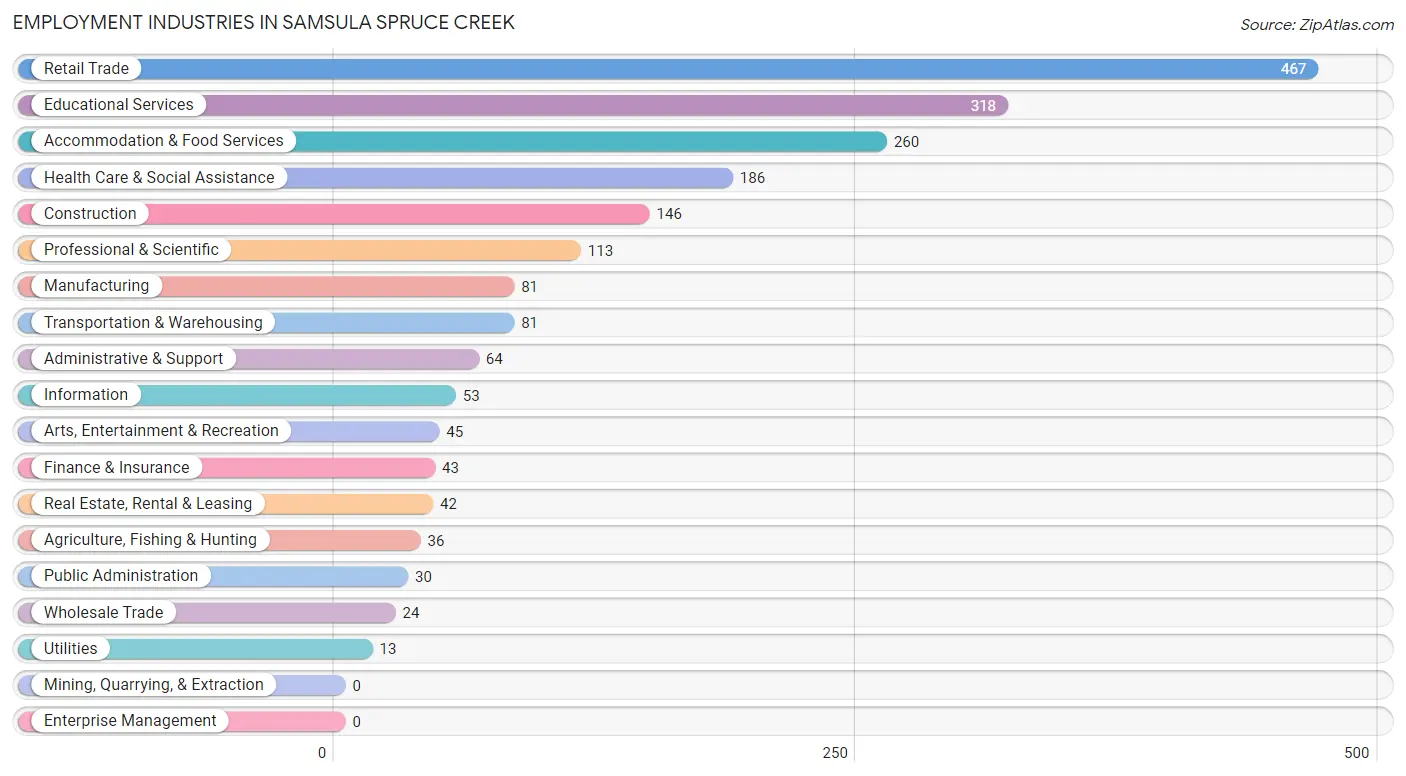
Employment Industries in Samsula Spruce Creek
The major employment industries in Samsula Spruce Creek include Retail Trade (467 | 21.9%), Educational Services (318 | 14.9%), Accommodation & Food Services (260 | 12.2%), Health Care & Social Assistance (186 | 8.7%), and Construction (146 | 6.9%).
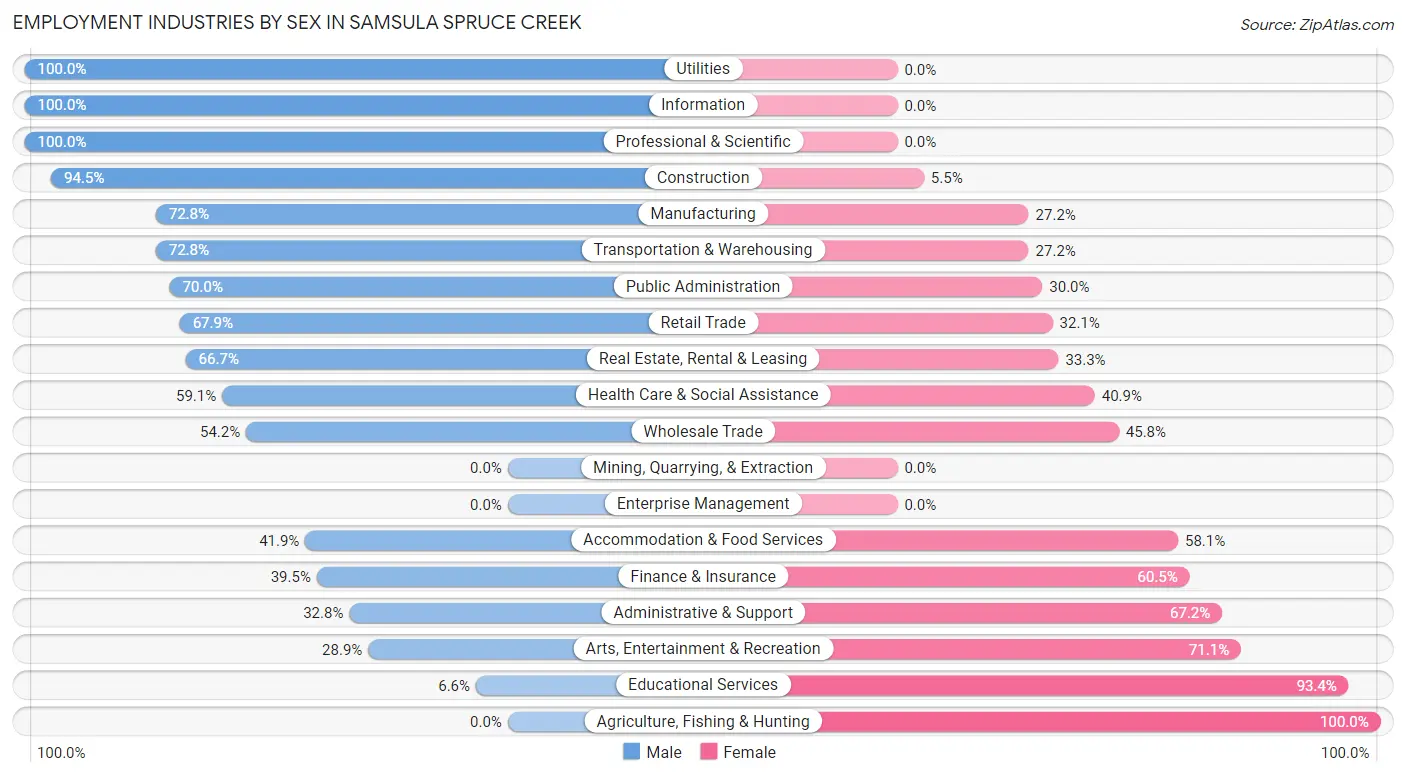
Employment Industries by Sex in Samsula Spruce Creek
The Samsula Spruce Creek industries that see more men than women are Utilities (100.0%), Information (100.0%), and Professional & Scientific (100.0%), whereas the industries that tend to have a higher number of women are Agriculture, Fishing & Hunting (100.0%), Educational Services (93.4%), and Arts, Entertainment & Recreation (71.1%).
| Industry | Male | Female |
| Agriculture, Fishing & Hunting | 0 (0.0%) | 36 (100.0%) |
| Mining, Quarrying, & Extraction | 0 (0.0%) | 0 (0.0%) |
| Construction | 138 (94.5%) | 8 (5.5%) |
| Manufacturing | 59 (72.8%) | 22 (27.2%) |
| Wholesale Trade | 13 (54.2%) | 11 (45.8%) |
| Retail Trade | 317 (67.9%) | 150 (32.1%) |
| Transportation & Warehousing | 59 (72.8%) | 22 (27.2%) |
| Utilities | 13 (100.0%) | 0 (0.0%) |
| Information | 53 (100.0%) | 0 (0.0%) |
| Finance & Insurance | 17 (39.5%) | 26 (60.5%) |
| Real Estate, Rental & Leasing | 28 (66.7%) | 14 (33.3%) |
| Professional & Scientific | 113 (100.0%) | 0 (0.0%) |
| Enterprise Management | 0 (0.0%) | 0 (0.0%) |
| Administrative & Support | 21 (32.8%) | 43 (67.2%) |
| Educational Services | 21 (6.6%) | 297 (93.4%) |
| Health Care & Social Assistance | 110 (59.1%) | 76 (40.9%) |
| Arts, Entertainment & Recreation | 13 (28.9%) | 32 (71.1%) |
| Accommodation & Food Services | 109 (41.9%) | 151 (58.1%) |
| Public Administration | 21 (70.0%) | 9 (30.0%) |
| Total | 1,179 (55.3%) | 952 (44.7%) |
Education in Samsula Spruce Creek
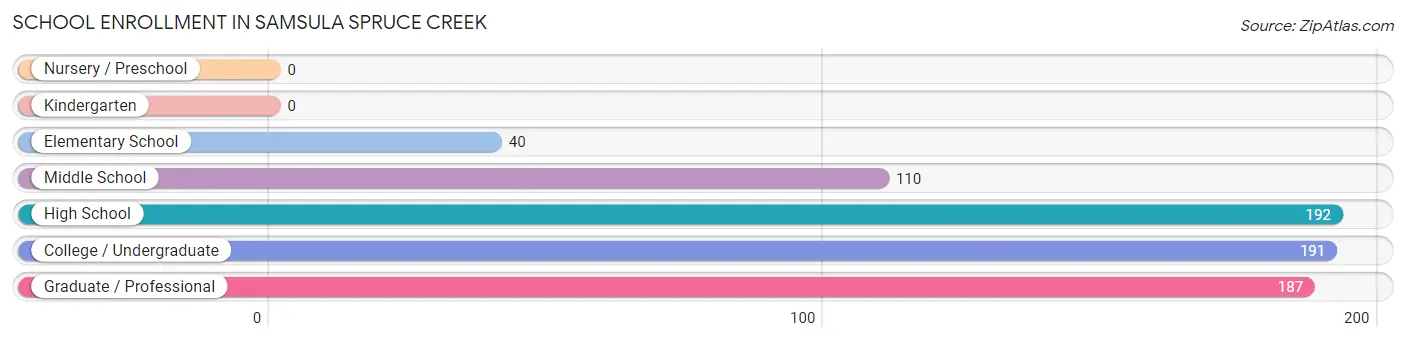
School Enrollment in Samsula Spruce Creek
The most common levels of schooling among the 720 students in Samsula Spruce Creek are high school (192 | 26.7%), college / undergraduate (191 | 26.5%), and graduate / professional (187 | 26.0%).
| School Level | # Students | % Students |
| Nursery / Preschool | 0 | 0.0% |
| Kindergarten | 0 | 0.0% |
| Elementary School | 40 | 5.6% |
| Middle School | 110 | 15.3% |
| High School | 192 | 26.7% |
| College / Undergraduate | 191 | 26.5% |
| Graduate / Professional | 187 | 26.0% |
| Total | 720 | 100.0% |
School Enrollment by Age by Funding Source in Samsula Spruce Creek
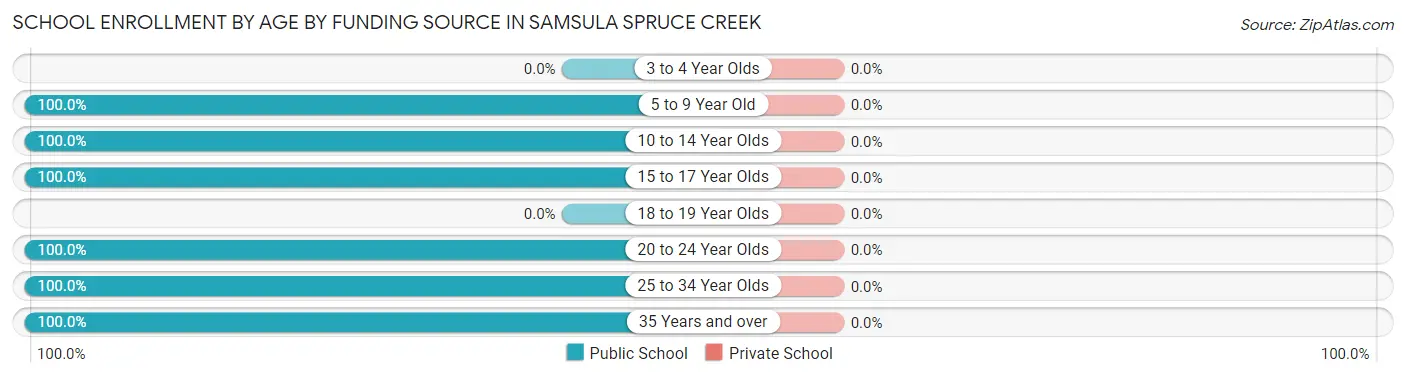
| Age Bracket | Public School | Private School |
| 3 to 4 Year Olds | 0 (0.0%) | 0 (0.0%) |
| 5 to 9 Year Old | 17 (100.0%) | 0 (0.0%) |
| 10 to 14 Year Olds | 133 (100.0%) | 0 (0.0%) |
| 15 to 17 Year Olds | 192 (100.0%) | 0 (0.0%) |
| 18 to 19 Year Olds | 0 (0.0%) | 0 (0.0%) |
| 20 to 24 Year Olds | 162 (100.0%) | 0 (0.0%) |
| 25 to 34 Year Olds | 22 (100.0%) | 0 (0.0%) |
| 35 Years and over | 194 (100.0%) | 0 (0.0%) |
| Total | 720 (100.0%) | 0 (0.0%) |
Educational Attainment by Field of Study in Samsula Spruce Creek
Business (461 | 23.3%), science & technology (449 | 22.7%), social sciences (162 | 8.2%), engineering (160 | 8.1%), and education (158 | 8.0%) are the most common fields of study among 1,982 individuals in Samsula Spruce Creek who have obtained a bachelor's degree or higher.
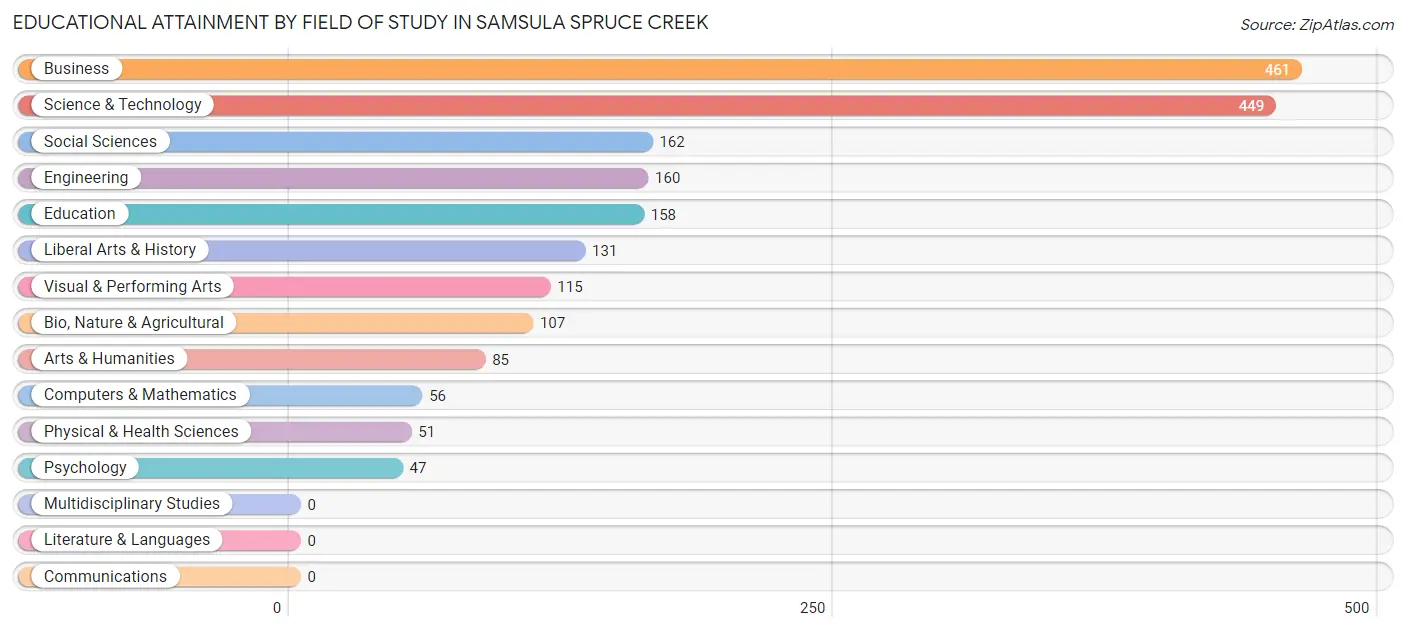
| Field of Study | # Graduates | % Graduates |
| Computers & Mathematics | 56 | 2.8% |
| Bio, Nature & Agricultural | 107 | 5.4% |
| Physical & Health Sciences | 51 | 2.6% |
| Psychology | 47 | 2.4% |
| Social Sciences | 162 | 8.2% |
| Engineering | 160 | 8.1% |
| Multidisciplinary Studies | 0 | 0.0% |
| Science & Technology | 449 | 22.7% |
| Business | 461 | 23.3% |
| Education | 158 | 8.0% |
| Literature & Languages | 0 | 0.0% |
| Liberal Arts & History | 131 | 6.6% |
| Visual & Performing Arts | 115 | 5.8% |
| Communications | 0 | 0.0% |
| Arts & Humanities | 85 | 4.3% |
| Total | 1,982 | 100.0% |
Transportation & Commute in Samsula Spruce Creek
Vehicle Availability by Sex in Samsula Spruce Creek
The most prevalent vehicle ownership categories in Samsula Spruce Creek are males with 2 vehicles (448, accounting for 40.4%) and females with 2 vehicles (424, making up 47.1%).
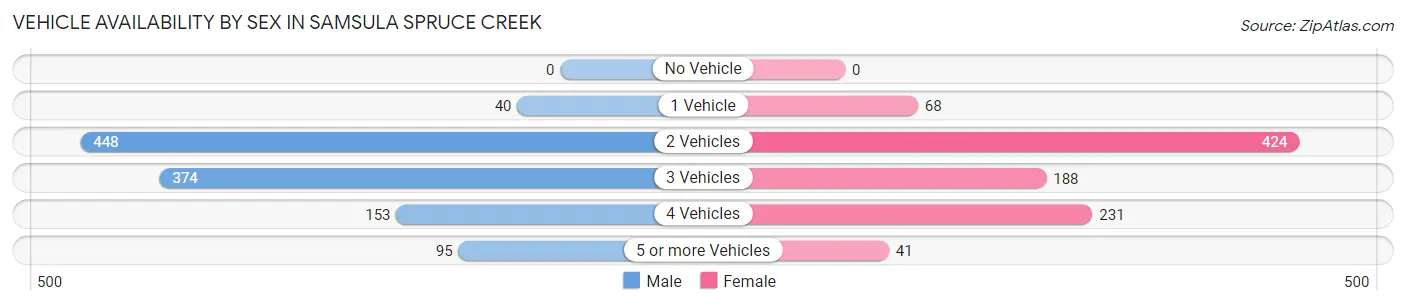
| Vehicles Available | Male | Female |
| No Vehicle | 0 (0.0%) | 0 (0.0%) |
| 1 Vehicle | 40 (3.6%) | 68 (7.1%) |
| 2 Vehicles | 448 (40.4%) | 424 (44.5%) |
| 3 Vehicles | 374 (33.7%) | 188 (19.8%) |
| 4 Vehicles | 153 (13.8%) | 231 (24.3%) |
| 5 or more Vehicles | 95 (8.6%) | 41 (4.3%) |
| Total | 1,110 (100.0%) | 952 (100.0%) |
Commute Time in Samsula Spruce Creek
The most frequently occuring commute durations in Samsula Spruce Creek are 20 to 24 minutes (363 commuters, 21.0%), 25 to 29 minutes (232 commuters, 13.4%), and 30 to 34 minutes (232 commuters, 13.4%).
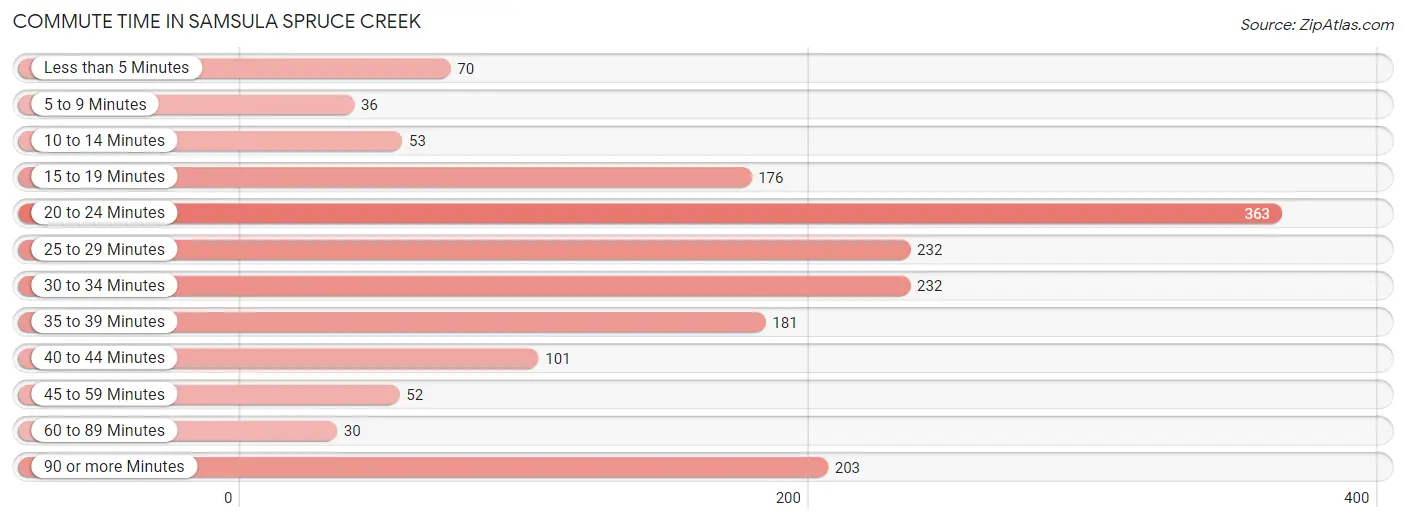
| Commute Time | # Commuters | % Commuters |
| Less than 5 Minutes | 70 | 4.1% |
| 5 to 9 Minutes | 36 | 2.1% |
| 10 to 14 Minutes | 53 | 3.1% |
| 15 to 19 Minutes | 176 | 10.2% |
| 20 to 24 Minutes | 363 | 21.0% |
| 25 to 29 Minutes | 232 | 13.4% |
| 30 to 34 Minutes | 232 | 13.4% |
| 35 to 39 Minutes | 181 | 10.5% |
| 40 to 44 Minutes | 101 | 5.8% |
| 45 to 59 Minutes | 52 | 3.0% |
| 60 to 89 Minutes | 30 | 1.7% |
| 90 or more Minutes | 203 | 11.7% |
Commute Time by Sex in Samsula Spruce Creek
The most common commute times in Samsula Spruce Creek are 20 to 24 minutes (203 commuters, 22.9%) for males and 20 to 24 minutes (160 commuters, 19.0%) for females.
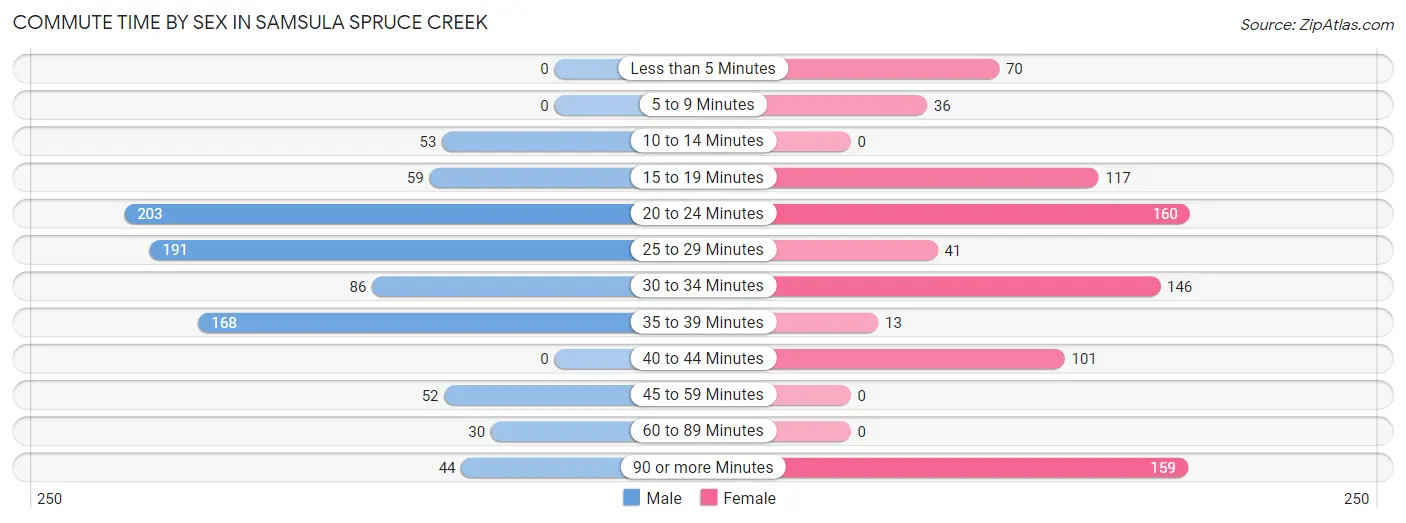
| Commute Time | Male | Female |
| Less than 5 Minutes | 0 (0.0%) | 70 (8.3%) |
| 5 to 9 Minutes | 0 (0.0%) | 36 (4.3%) |
| 10 to 14 Minutes | 53 (6.0%) | 0 (0.0%) |
| 15 to 19 Minutes | 59 (6.7%) | 117 (13.9%) |
| 20 to 24 Minutes | 203 (22.9%) | 160 (19.0%) |
| 25 to 29 Minutes | 191 (21.6%) | 41 (4.9%) |
| 30 to 34 Minutes | 86 (9.7%) | 146 (17.3%) |
| 35 to 39 Minutes | 168 (19.0%) | 13 (1.5%) |
| 40 to 44 Minutes | 0 (0.0%) | 101 (12.0%) |
| 45 to 59 Minutes | 52 (5.9%) | 0 (0.0%) |
| 60 to 89 Minutes | 30 (3.4%) | 0 (0.0%) |
| 90 or more Minutes | 44 (5.0%) | 159 (18.9%) |
Time of Departure to Work by Sex in Samsula Spruce Creek
The most frequent times of departure to work in Samsula Spruce Creek are 7:30 AM to 7:59 AM (272, 30.7%) for males and 7:30 AM to 7:59 AM (201, 23.8%) for females.
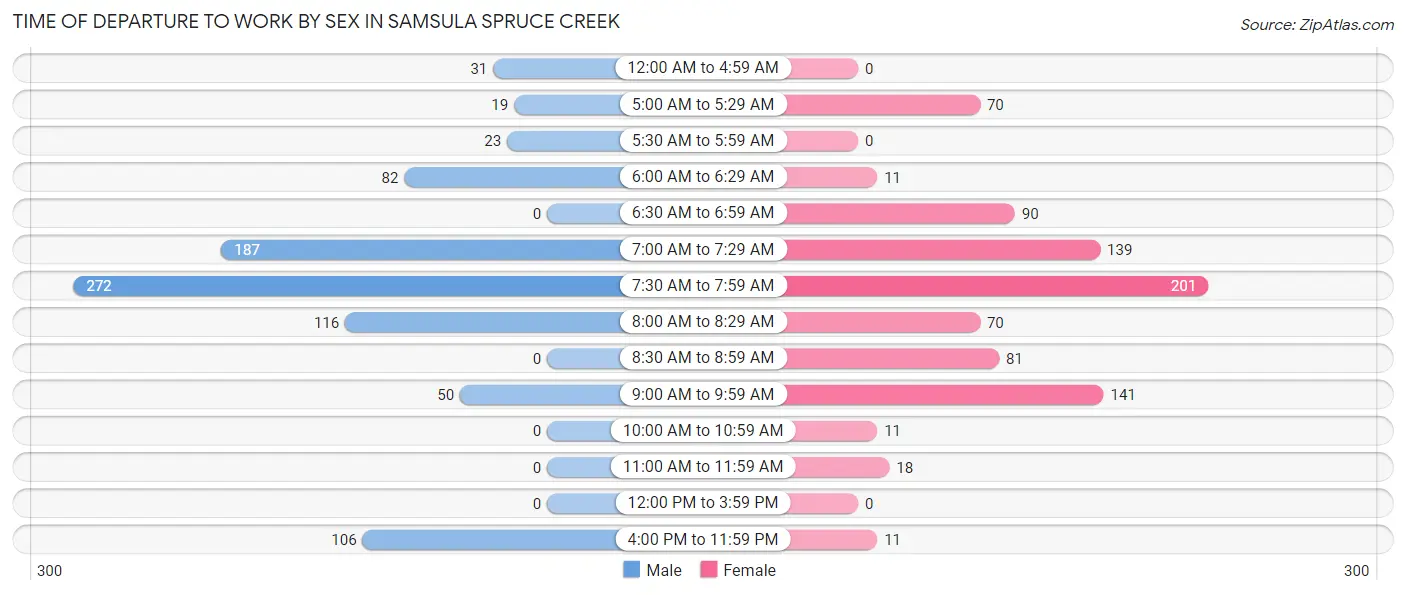
| Time of Departure | Male | Female |
| 12:00 AM to 4:59 AM | 31 (3.5%) | 0 (0.0%) |
| 5:00 AM to 5:29 AM | 19 (2.1%) | 70 (8.3%) |
| 5:30 AM to 5:59 AM | 23 (2.6%) | 0 (0.0%) |
| 6:00 AM to 6:29 AM | 82 (9.3%) | 11 (1.3%) |
| 6:30 AM to 6:59 AM | 0 (0.0%) | 90 (10.7%) |
| 7:00 AM to 7:29 AM | 187 (21.1%) | 139 (16.5%) |
| 7:30 AM to 7:59 AM | 272 (30.7%) | 201 (23.8%) |
| 8:00 AM to 8:29 AM | 116 (13.1%) | 70 (8.3%) |
| 8:30 AM to 8:59 AM | 0 (0.0%) | 81 (9.6%) |
| 9:00 AM to 9:59 AM | 50 (5.6%) | 141 (16.7%) |
| 10:00 AM to 10:59 AM | 0 (0.0%) | 11 (1.3%) |
| 11:00 AM to 11:59 AM | 0 (0.0%) | 18 (2.1%) |
| 12:00 PM to 3:59 PM | 0 (0.0%) | 0 (0.0%) |
| 4:00 PM to 11:59 PM | 106 (12.0%) | 11 (1.3%) |
| Total | 886 (100.0%) | 843 (100.0%) |
Housing Occupancy in Samsula Spruce Creek
Occupancy by Ownership in Samsula Spruce Creek
Of the total 2,165 dwellings in Samsula Spruce Creek, owner-occupied units account for 1,971 (91.0%), while renter-occupied units make up 194 (9.0%).
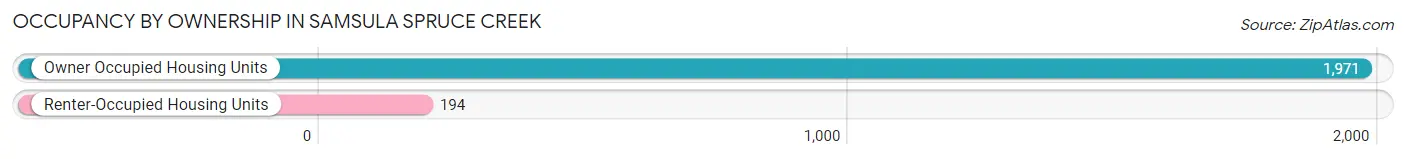
| Occupancy | # Housing Units | % Housing Units |
| Owner Occupied Housing Units | 1,971 | 91.0% |
| Renter-Occupied Housing Units | 194 | 9.0% |
| Total Occupied Housing Units | 2,165 | 100.0% |
Occupancy by Household Size in Samsula Spruce Creek
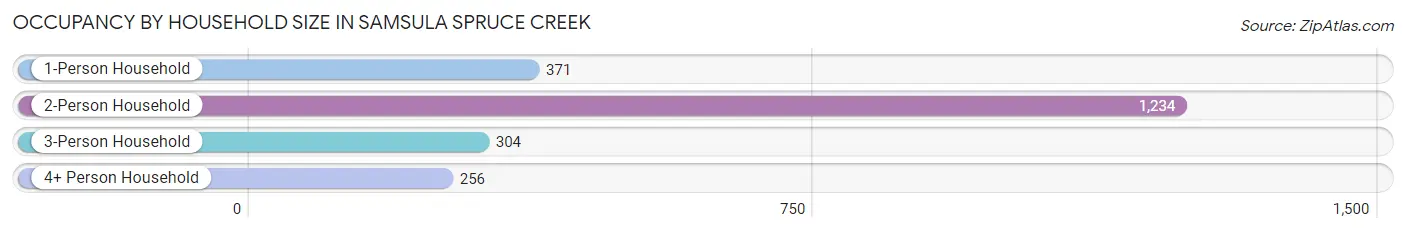
| Household Size | # Housing Units | % Housing Units |
| 1-Person Household | 371 | 17.1% |
| 2-Person Household | 1,234 | 57.0% |
| 3-Person Household | 304 | 14.0% |
| 4+ Person Household | 256 | 11.8% |
| Total Housing Units | 2,165 | 100.0% |
Occupancy by Ownership by Household Size in Samsula Spruce Creek
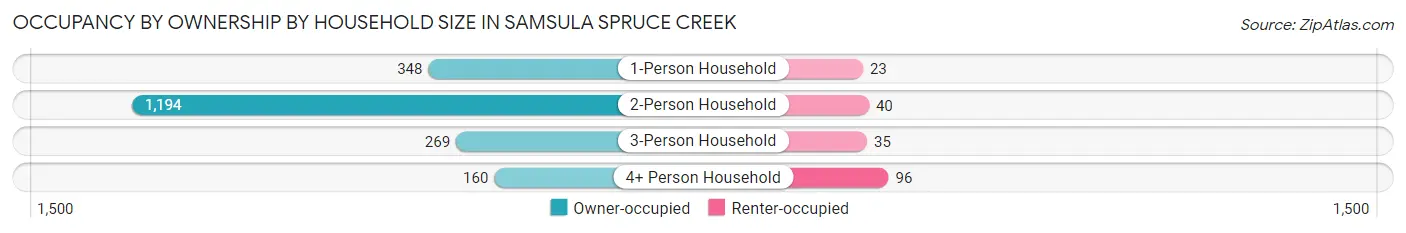
| Household Size | Owner-occupied | Renter-occupied |
| 1-Person Household | 348 (93.8%) | 23 (6.2%) |
| 2-Person Household | 1,194 (96.8%) | 40 (3.2%) |
| 3-Person Household | 269 (88.5%) | 35 (11.5%) |
| 4+ Person Household | 160 (62.5%) | 96 (37.5%) |
| Total Housing Units | 1,971 (91.0%) | 194 (9.0%) |
Occupancy by Educational Attainment in Samsula Spruce Creek
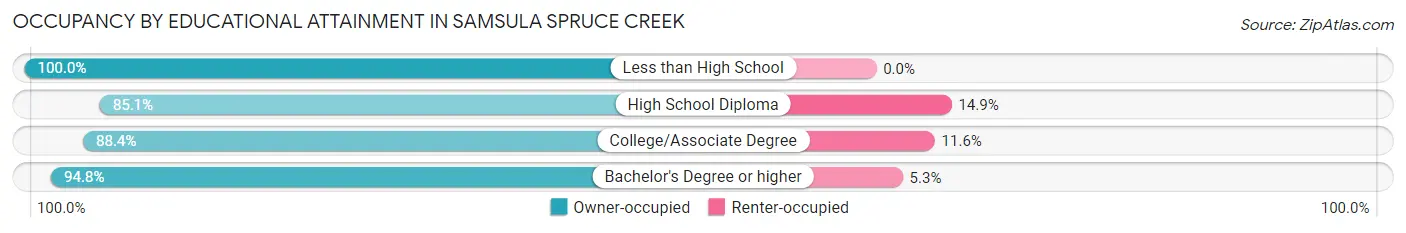
| Household Size | Owner-occupied | Renter-occupied |
| Less than High School | 27 (100.0%) | 0 (0.0%) |
| High School Diploma | 473 (85.1%) | 83 (14.9%) |
| College/Associate Degree | 389 (88.4%) | 51 (11.6%) |
| Bachelor's Degree or higher | 1,082 (94.8%) | 60 (5.2%) |
Occupancy by Age of Householder in Samsula Spruce Creek
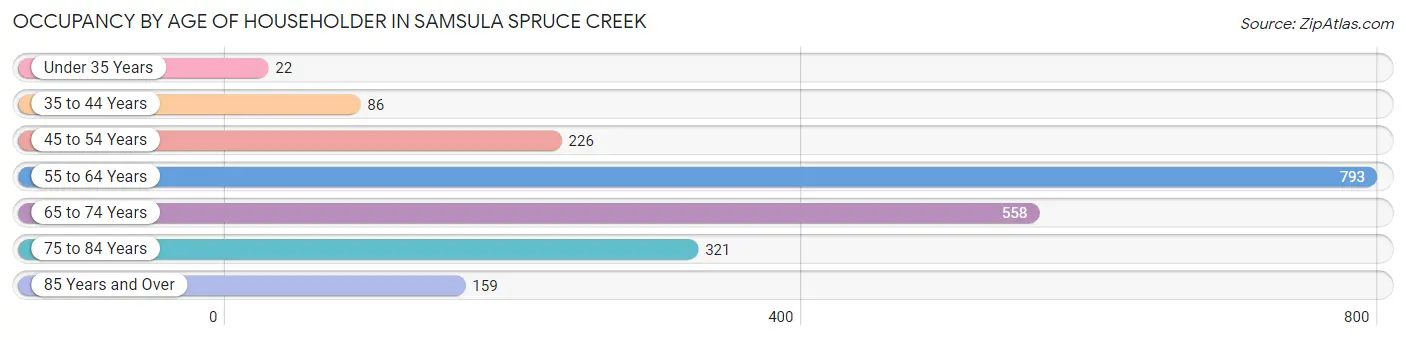
| Age Bracket | # Households | % Households |
| Under 35 Years | 22 | 1.0% |
| 35 to 44 Years | 86 | 4.0% |
| 45 to 54 Years | 226 | 10.4% |
| 55 to 64 Years | 793 | 36.6% |
| 65 to 74 Years | 558 | 25.8% |
| 75 to 84 Years | 321 | 14.8% |
| 85 Years and Over | 159 | 7.3% |
| Total | 2,165 | 100.0% |
Housing Finances in Samsula Spruce Creek
Median Income by Occupancy in Samsula Spruce Creek
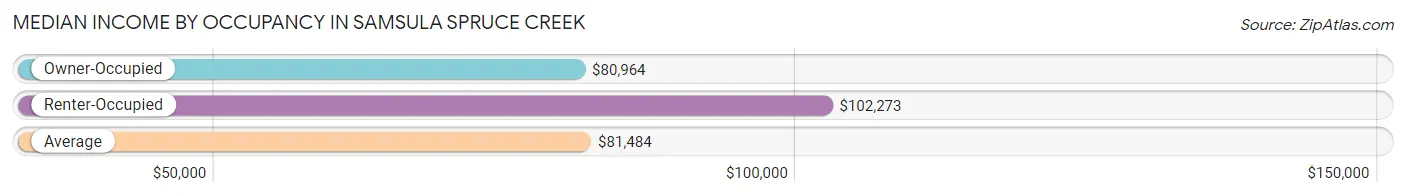
| Occupancy Type | # Households | Median Income |
| Owner-Occupied | 1,971 (91.0%) | $80,964 |
| Renter-Occupied | 194 (9.0%) | $102,273 |
| Average | 2,165 (100.0%) | $81,484 |
Occupancy by Householder Income Bracket in Samsula Spruce Creek
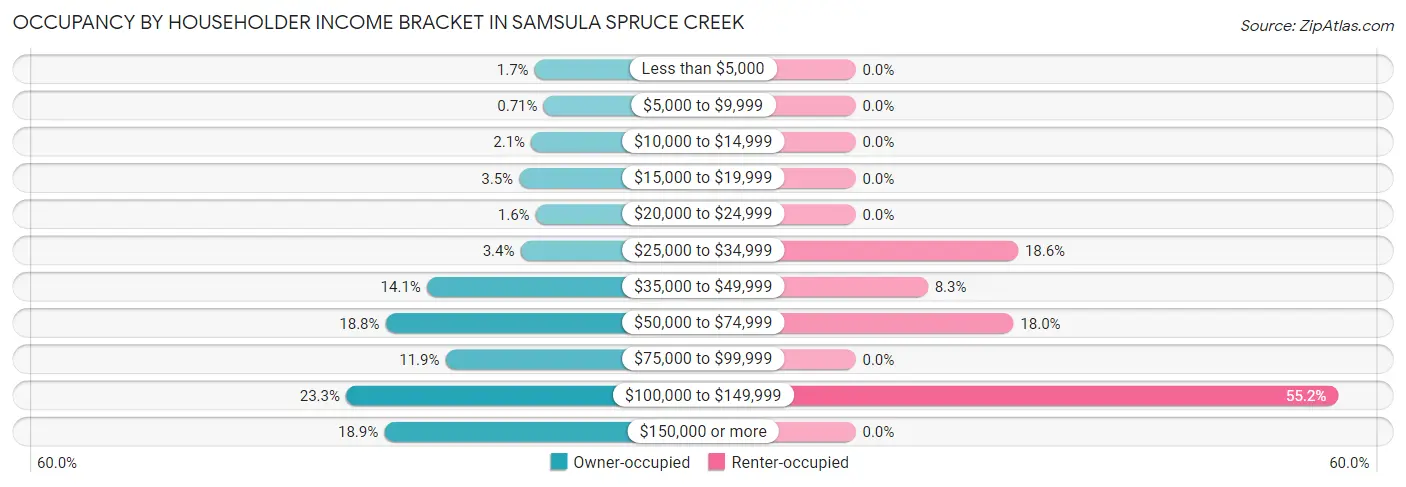
| Income Bracket | Owner-occupied | Renter-occupied |
| Less than $5,000 | 34 (1.7%) | 0 (0.0%) |
| $5,000 to $9,999 | 14 (0.7%) | 0 (0.0%) |
| $10,000 to $14,999 | 42 (2.1%) | 0 (0.0%) |
| $15,000 to $19,999 | 69 (3.5%) | 0 (0.0%) |
| $20,000 to $24,999 | 32 (1.6%) | 0 (0.0%) |
| $25,000 to $34,999 | 66 (3.4%) | 36 (18.6%) |
| $35,000 to $49,999 | 277 (14.1%) | 16 (8.3%) |
| $50,000 to $74,999 | 370 (18.8%) | 35 (18.0%) |
| $75,000 to $99,999 | 235 (11.9%) | 0 (0.0%) |
| $100,000 to $149,999 | 459 (23.3%) | 107 (55.1%) |
| $150,000 or more | 373 (18.9%) | 0 (0.0%) |
| Total | 1,971 (100.0%) | 194 (100.0%) |
Monthly Housing Cost Tiers in Samsula Spruce Creek
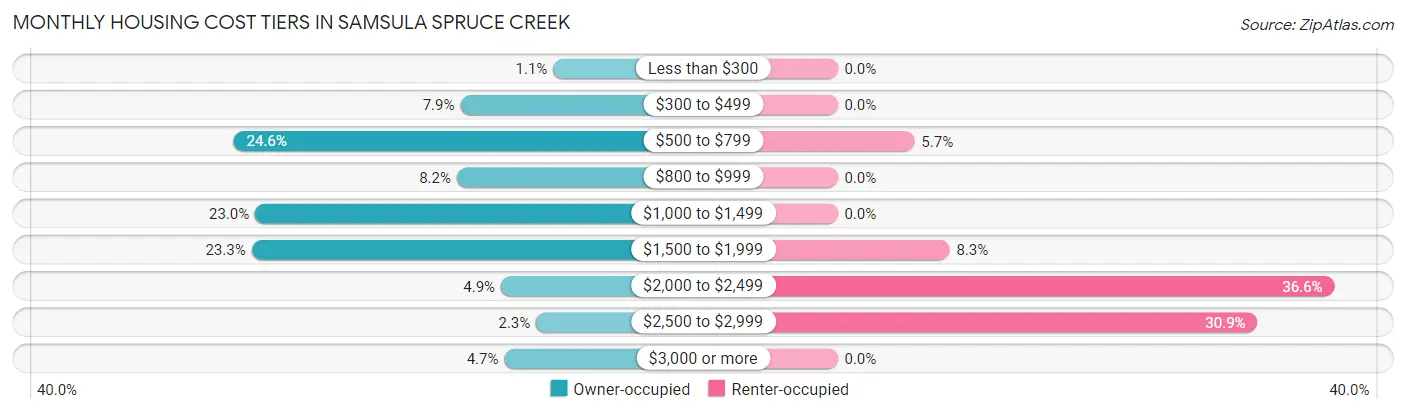
| Monthly Cost | Owner-occupied | Renter-occupied |
| Less than $300 | 21 (1.1%) | 0 (0.0%) |
| $300 to $499 | 156 (7.9%) | 0 (0.0%) |
| $500 to $799 | 485 (24.6%) | 11 (5.7%) |
| $800 to $999 | 161 (8.2%) | 0 (0.0%) |
| $1,000 to $1,499 | 454 (23.0%) | 0 (0.0%) |
| $1,500 to $1,999 | 459 (23.3%) | 16 (8.3%) |
| $2,000 to $2,499 | 97 (4.9%) | 71 (36.6%) |
| $2,500 to $2,999 | 46 (2.3%) | 60 (30.9%) |
| $3,000 or more | 92 (4.7%) | 0 (0.0%) |
| Total | 1,971 (100.0%) | 194 (100.0%) |
Physical Housing Characteristics in Samsula Spruce Creek
Housing Structures in Samsula Spruce Creek
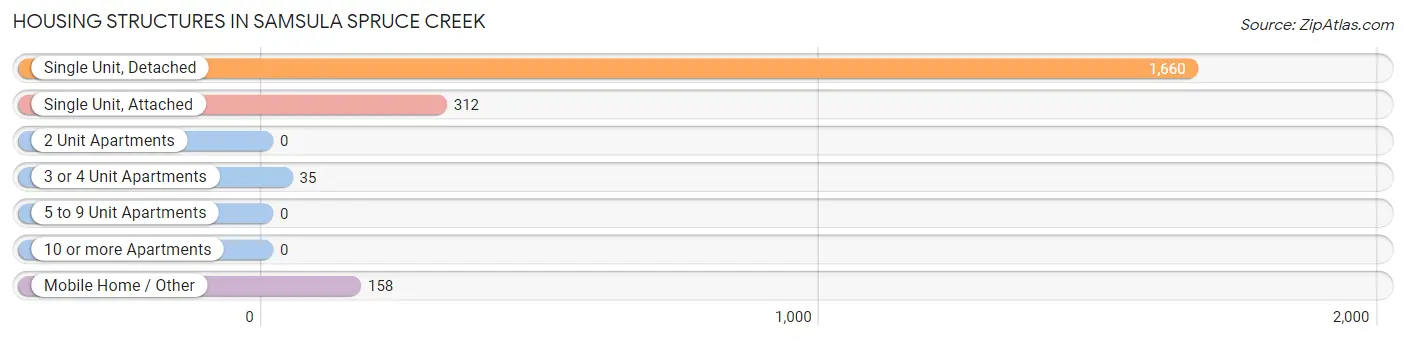
| Structure Type | # Housing Units | % Housing Units |
| Single Unit, Detached | 1,660 | 76.7% |
| Single Unit, Attached | 312 | 14.4% |
| 2 Unit Apartments | 0 | 0.0% |
| 3 or 4 Unit Apartments | 35 | 1.6% |
| 5 to 9 Unit Apartments | 0 | 0.0% |
| 10 or more Apartments | 0 | 0.0% |
| Mobile Home / Other | 158 | 7.3% |
| Total | 2,165 | 100.0% |
Housing Structures by Occupancy in Samsula Spruce Creek
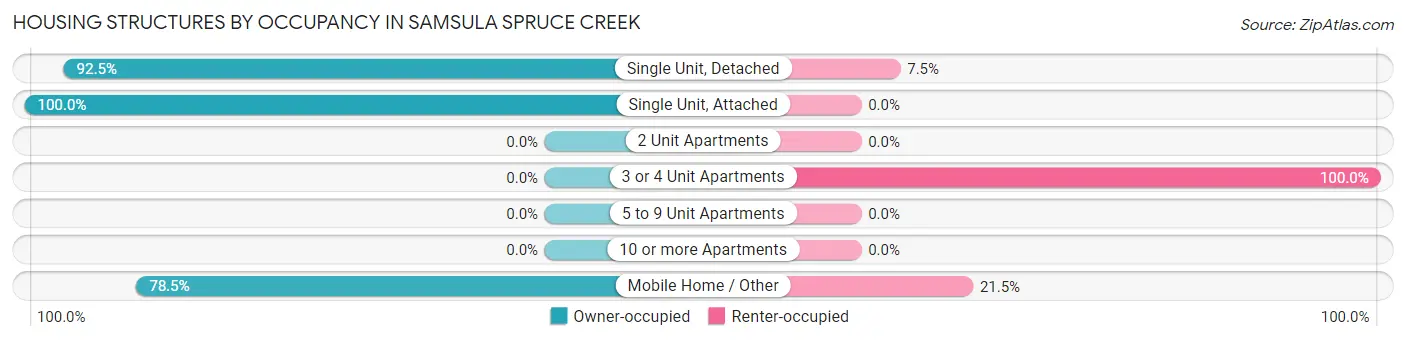
| Structure Type | Owner-occupied | Renter-occupied |
| Single Unit, Detached | 1,535 (92.5%) | 125 (7.5%) |
| Single Unit, Attached | 312 (100.0%) | 0 (0.0%) |
| 2 Unit Apartments | 0 (0.0%) | 0 (0.0%) |
| 3 or 4 Unit Apartments | 0 (0.0%) | 35 (100.0%) |
| 5 to 9 Unit Apartments | 0 (0.0%) | 0 (0.0%) |
| 10 or more Apartments | 0 (0.0%) | 0 (0.0%) |
| Mobile Home / Other | 124 (78.5%) | 34 (21.5%) |
| Total | 1,971 (91.0%) | 194 (9.0%) |
Housing Structures by Number of Rooms in Samsula Spruce Creek
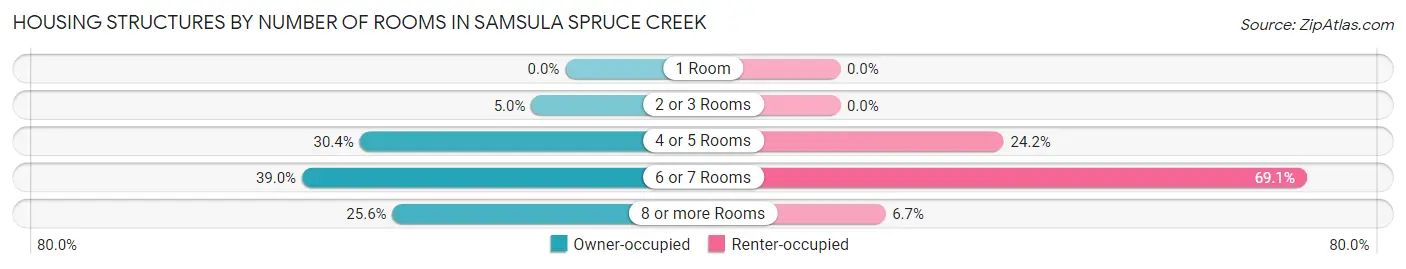
| Number of Rooms | Owner-occupied | Renter-occupied |
| 1 Room | 0 (0.0%) | 0 (0.0%) |
| 2 or 3 Rooms | 99 (5.0%) | 0 (0.0%) |
| 4 or 5 Rooms | 600 (30.4%) | 47 (24.2%) |
| 6 or 7 Rooms | 768 (39.0%) | 134 (69.1%) |
| 8 or more Rooms | 504 (25.6%) | 13 (6.7%) |
| Total | 1,971 (100.0%) | 194 (100.0%) |
Housing Structure by Heating Type in Samsula Spruce Creek
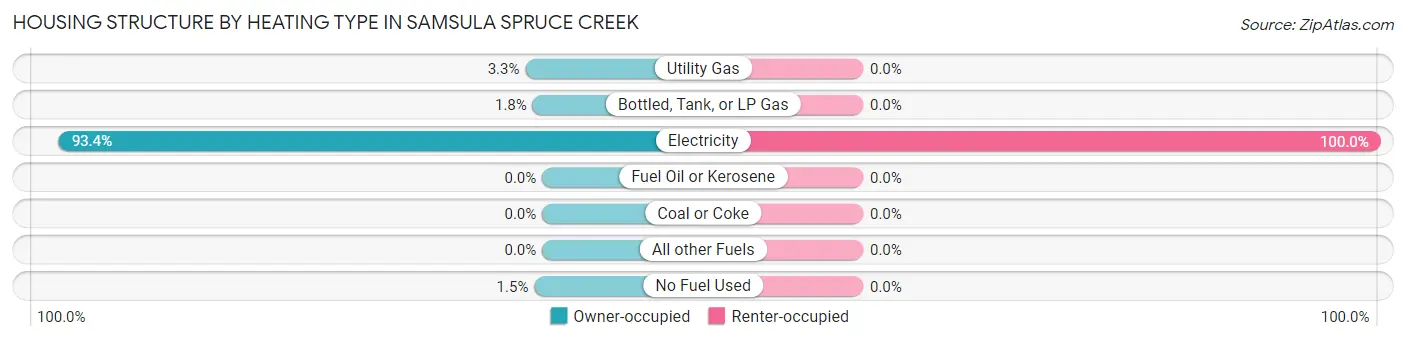
| Heating Type | Owner-occupied | Renter-occupied |
| Utility Gas | 64 (3.3%) | 0 (0.0%) |
| Bottled, Tank, or LP Gas | 36 (1.8%) | 0 (0.0%) |
| Electricity | 1,841 (93.4%) | 194 (100.0%) |
| Fuel Oil or Kerosene | 0 (0.0%) | 0 (0.0%) |
| Coal or Coke | 0 (0.0%) | 0 (0.0%) |
| All other Fuels | 0 (0.0%) | 0 (0.0%) |
| No Fuel Used | 30 (1.5%) | 0 (0.0%) |
| Total | 1,971 (100.0%) | 194 (100.0%) |
Household Vehicle Usage in Samsula Spruce Creek
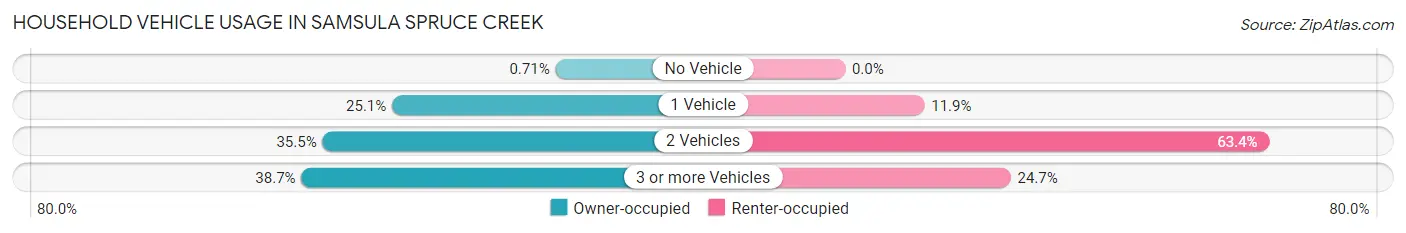
| Vehicles per Household | Owner-occupied | Renter-occupied |
| No Vehicle | 14 (0.7%) | 0 (0.0%) |
| 1 Vehicle | 495 (25.1%) | 23 (11.9%) |
| 2 Vehicles | 700 (35.5%) | 123 (63.4%) |
| 3 or more Vehicles | 762 (38.7%) | 48 (24.7%) |
| Total | 1,971 (100.0%) | 194 (100.0%) |
Real Estate & Mortgages in Samsula Spruce Creek
Real Estate and Mortgage Overview in Samsula Spruce Creek
| Characteristic | Without Mortgage | With Mortgage |
| Housing Units | 1,195 | 776 |
| Median Property Value | $389,300 | $351,900 |
| Median Household Income | $78,988 | $88 |
| Monthly Housing Costs | $748 | $62 |
| Real Estate Taxes | $4,231 | $0 |
Property Value by Mortgage Status in Samsula Spruce Creek
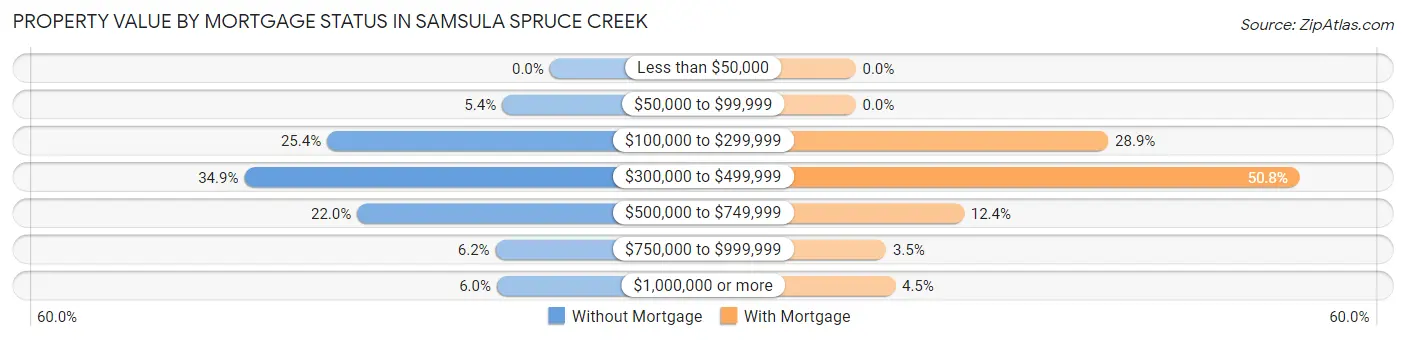
| Property Value | Without Mortgage | With Mortgage |
| Less than $50,000 | 0 (0.0%) | 0 (0.0%) |
| $50,000 to $99,999 | 65 (5.4%) | 0 (0.0%) |
| $100,000 to $299,999 | 304 (25.4%) | 224 (28.9%) |
| $300,000 to $499,999 | 417 (34.9%) | 394 (50.8%) |
| $500,000 to $749,999 | 263 (22.0%) | 96 (12.4%) |
| $750,000 to $999,999 | 74 (6.2%) | 27 (3.5%) |
| $1,000,000 or more | 72 (6.0%) | 35 (4.5%) |
| Total | 1,195 (100.0%) | 776 (100.0%) |
Household Income by Mortgage Status in Samsula Spruce Creek
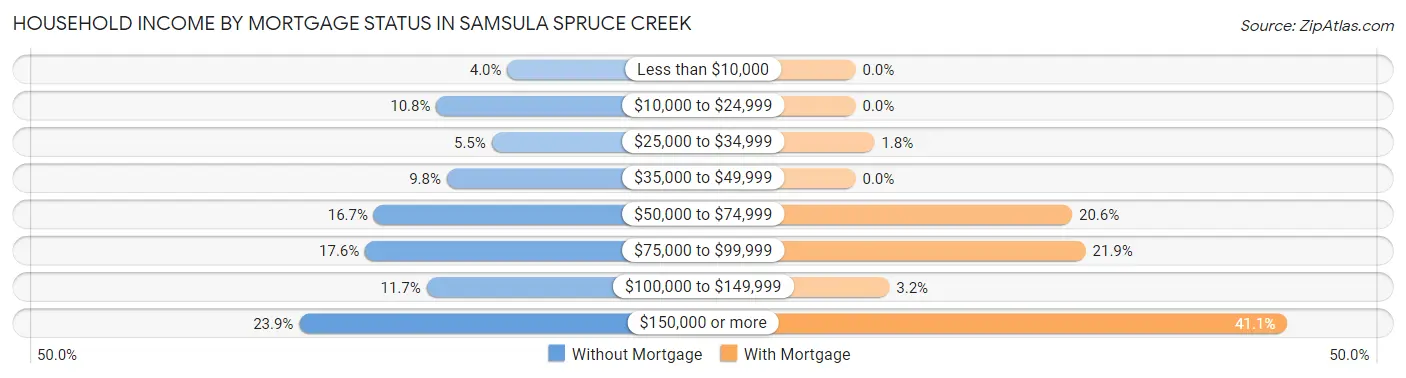
| Household Income | Without Mortgage | With Mortgage |
| Less than $10,000 | 48 (4.0%) | 0 (0.0%) |
| $10,000 to $24,999 | 129 (10.8%) | 0 (0.0%) |
| $25,000 to $34,999 | 66 (5.5%) | 14 (1.8%) |
| $35,000 to $49,999 | 117 (9.8%) | 0 (0.0%) |
| $50,000 to $74,999 | 200 (16.7%) | 160 (20.6%) |
| $75,000 to $99,999 | 210 (17.6%) | 170 (21.9%) |
| $100,000 to $149,999 | 140 (11.7%) | 25 (3.2%) |
| $150,000 or more | 285 (23.8%) | 319 (41.1%) |
| Total | 1,195 (100.0%) | 776 (100.0%) |
Property Value to Household Income Ratio in Samsula Spruce Creek
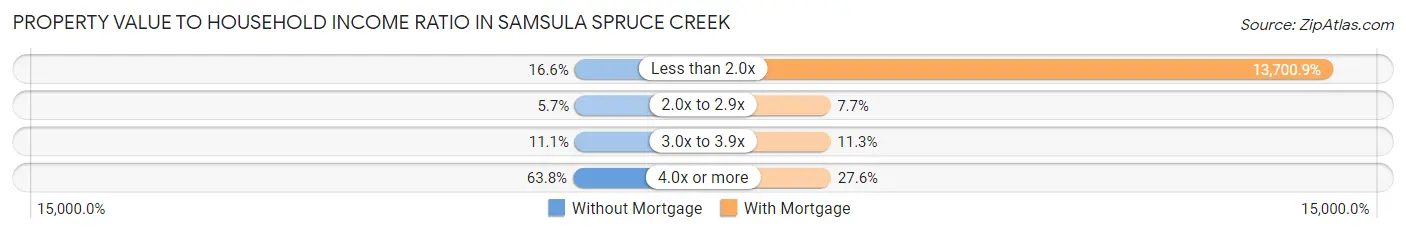
| Value-to-Income Ratio | Without Mortgage | With Mortgage |
| Less than 2.0x | 198 (16.6%) | 106,319 (13,700.9%) |
| 2.0x to 2.9x | 68 (5.7%) | 60 (7.7%) |
| 3.0x to 3.9x | 133 (11.1%) | 88 (11.3%) |
| 4.0x or more | 762 (63.8%) | 214 (27.6%) |
| Total | 1,195 (100.0%) | 776 (100.0%) |
Real Estate Taxes by Mortgage Status in Samsula Spruce Creek
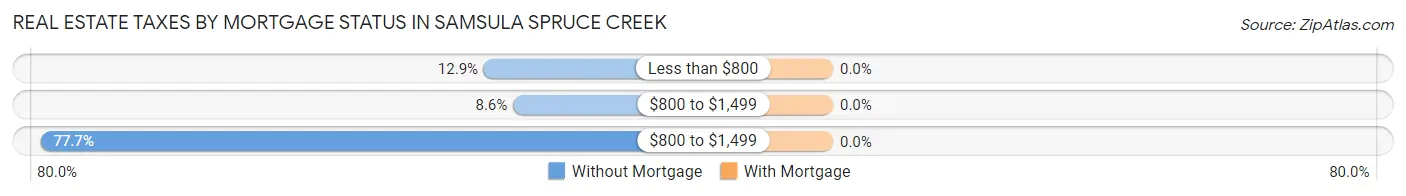
| Property Taxes | Without Mortgage | With Mortgage |
| Less than $800 | 154 (12.9%) | 0 (0.0%) |
| $800 to $1,499 | 103 (8.6%) | 0 (0.0%) |
| $800 to $1,499 | 928 (77.7%) | 0 (0.0%) |
| Total | 1,195 (100.0%) | 776 (100.0%) |
Health & Disability in Samsula Spruce Creek
Health Insurance Coverage by Age in Samsula Spruce Creek
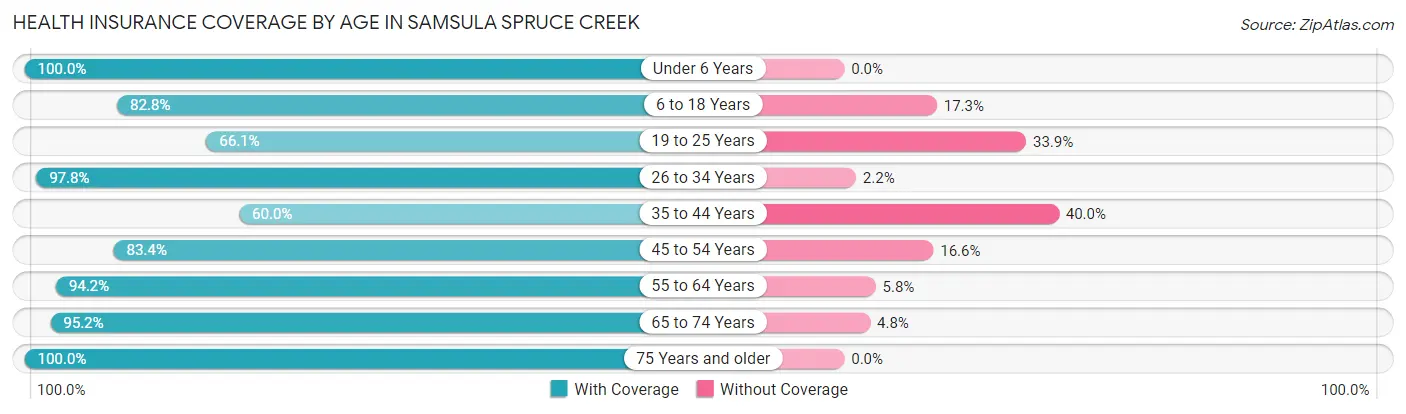
| Age Bracket | With Coverage | Without Coverage |
| Under 6 Years | 42 (100.0%) | 0 (0.0%) |
| 6 to 18 Years | 283 (82.8%) | 59 (17.2%) |
| 19 to 25 Years | 273 (66.1%) | 140 (33.9%) |
| 26 to 34 Years | 135 (97.8%) | 3 (2.2%) |
| 35 to 44 Years | 75 (60.0%) | 50 (40.0%) |
| 45 to 54 Years | 447 (83.4%) | 89 (16.6%) |
| 55 to 64 Years | 1,499 (94.2%) | 93 (5.8%) |
| 65 to 74 Years | 1,069 (95.2%) | 54 (4.8%) |
| 75 Years and older | 826 (100.0%) | 0 (0.0%) |
| Total | 4,649 (90.5%) | 488 (9.5%) |
Health Insurance Coverage by Citizenship Status in Samsula Spruce Creek
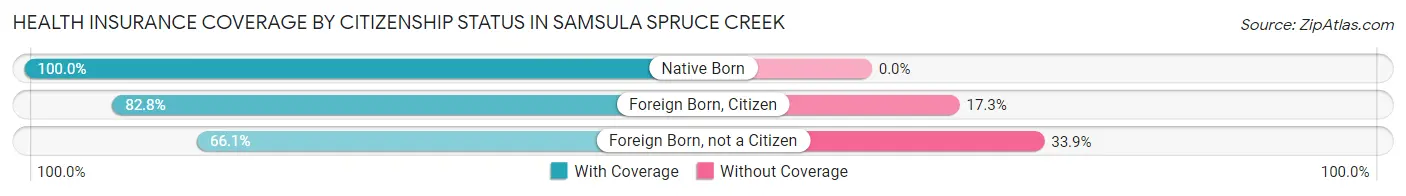
| Citizenship Status | With Coverage | Without Coverage |
| Native Born | 42 (100.0%) | 0 (0.0%) |
| Foreign Born, Citizen | 283 (82.8%) | 59 (17.2%) |
| Foreign Born, not a Citizen | 273 (66.1%) | 140 (33.9%) |
Health Insurance Coverage by Household Income in Samsula Spruce Creek
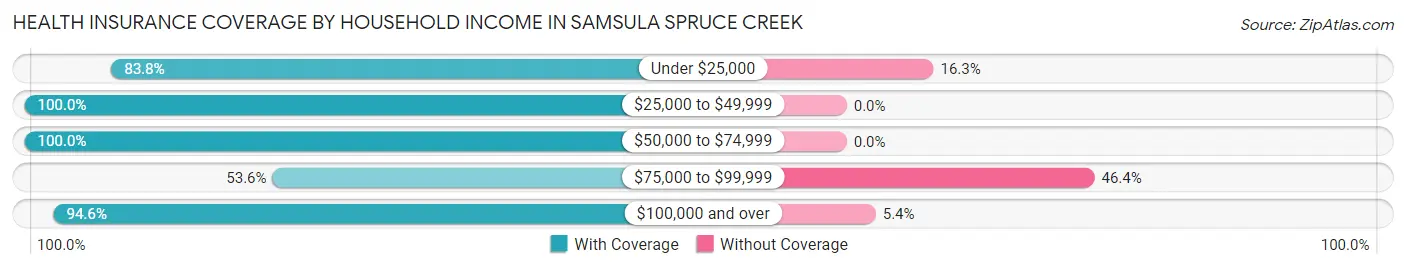
| Household Income | With Coverage | Without Coverage |
| Under $25,000 | 232 (83.8%) | 45 (16.3%) |
| $25,000 to $49,999 | 863 (100.0%) | 0 (0.0%) |
| $50,000 to $74,999 | 848 (100.0%) | 0 (0.0%) |
| $75,000 to $99,999 | 352 (53.6%) | 305 (46.4%) |
| $100,000 and over | 2,351 (94.6%) | 135 (5.4%) |
Public vs Private Health Insurance Coverage by Age in Samsula Spruce Creek
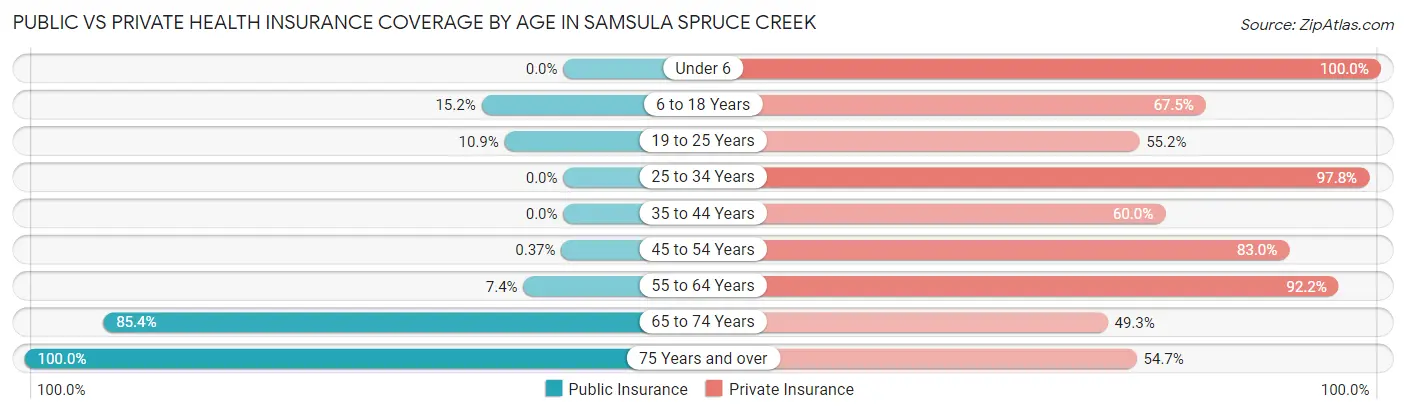
| Age Bracket | Public Insurance | Private Insurance |
| Under 6 | 0 (0.0%) | 42 (100.0%) |
| 6 to 18 Years | 52 (15.2%) | 231 (67.5%) |
| 19 to 25 Years | 45 (10.9%) | 228 (55.2%) |
| 25 to 34 Years | 0 (0.0%) | 135 (97.8%) |
| 35 to 44 Years | 0 (0.0%) | 75 (60.0%) |
| 45 to 54 Years | 2 (0.4%) | 445 (83.0%) |
| 55 to 64 Years | 118 (7.4%) | 1,468 (92.2%) |
| 65 to 74 Years | 959 (85.4%) | 554 (49.3%) |
| 75 Years and over | 826 (100.0%) | 452 (54.7%) |
| Total | 2,002 (39.0%) | 3,630 (70.7%) |
Disability Status by Sex by Age in Samsula Spruce Creek
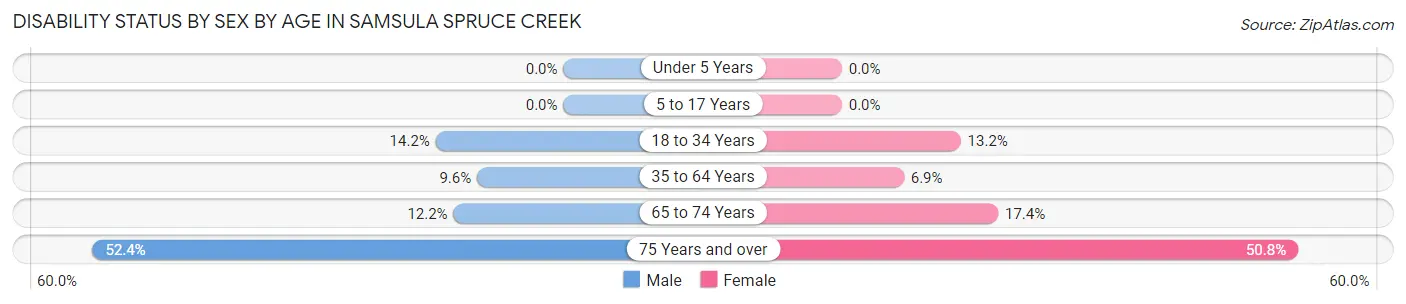
| Age Bracket | Male | Female |
| Under 5 Years | 0 (0.0%) | 0 (0.0%) |
| 5 to 17 Years | 0 (0.0%) | 0 (0.0%) |
| 18 to 34 Years | 30 (14.2%) | 45 (13.2%) |
| 35 to 64 Years | 105 (9.6%) | 80 (6.9%) |
| 65 to 74 Years | 65 (12.2%) | 103 (17.4%) |
| 75 Years and over | 204 (52.4%) | 222 (50.8%) |
Disability Class by Sex by Age in Samsula Spruce Creek
Disability Class: Hearing Difficulty
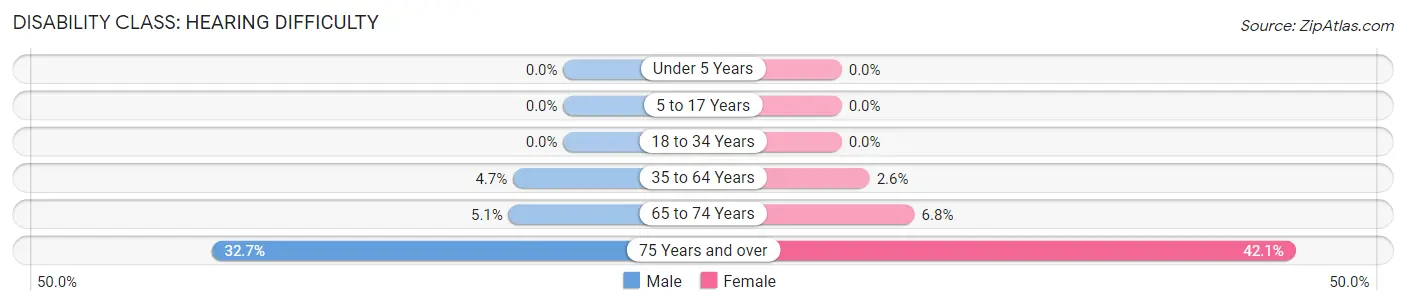
| Age Bracket | Male | Female |
| Under 5 Years | 0 (0.0%) | 0 (0.0%) |
| 5 to 17 Years | 0 (0.0%) | 0 (0.0%) |
| 18 to 34 Years | 0 (0.0%) | 0 (0.0%) |
| 35 to 64 Years | 51 (4.7%) | 30 (2.6%) |
| 65 to 74 Years | 27 (5.1%) | 40 (6.8%) |
| 75 Years and over | 127 (32.7%) | 184 (42.1%) |
Disability Class: Vision Difficulty
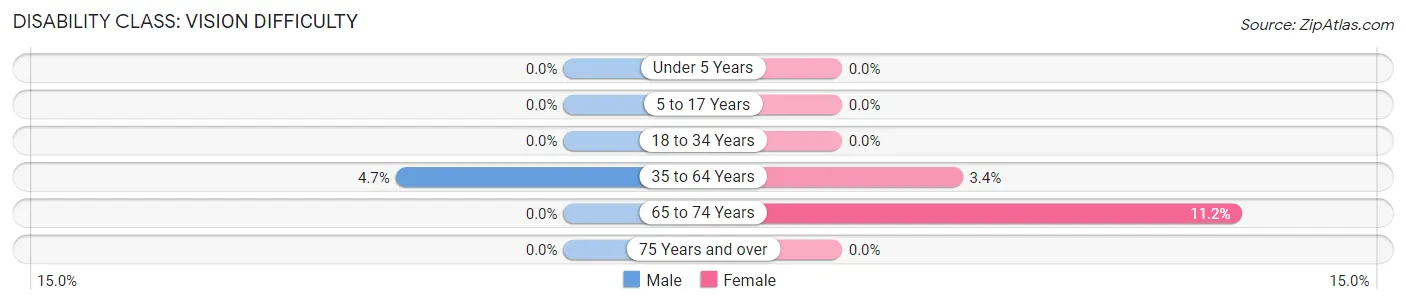
| Age Bracket | Male | Female |
| Under 5 Years | 0 (0.0%) | 0 (0.0%) |
| 5 to 17 Years | 0 (0.0%) | 0 (0.0%) |
| 18 to 34 Years | 0 (0.0%) | 0 (0.0%) |
| 35 to 64 Years | 51 (4.7%) | 39 (3.4%) |
| 65 to 74 Years | 0 (0.0%) | 66 (11.2%) |
| 75 Years and over | 0 (0.0%) | 0 (0.0%) |
Disability Class: Cognitive Difficulty
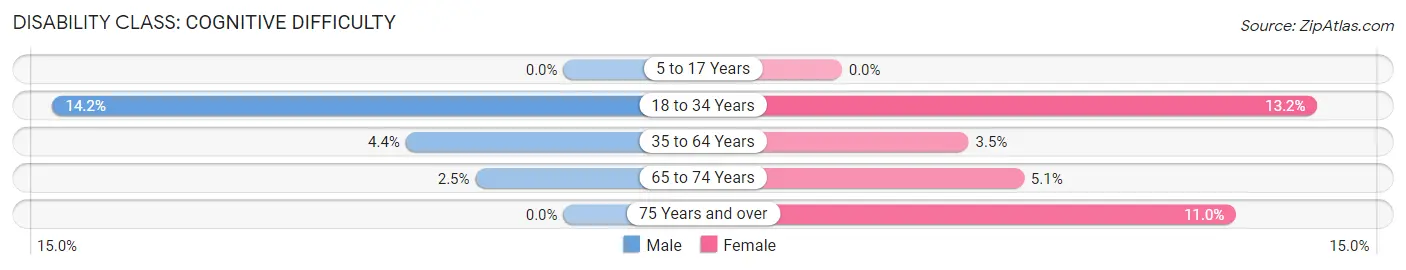
| Age Bracket | Male | Female |
| 5 to 17 Years | 0 (0.0%) | 0 (0.0%) |
| 18 to 34 Years | 30 (14.2%) | 45 (13.2%) |
| 35 to 64 Years | 48 (4.4%) | 41 (3.5%) |
| 65 to 74 Years | 13 (2.5%) | 30 (5.1%) |
| 75 Years and over | 0 (0.0%) | 48 (11.0%) |
Disability Class: Ambulatory Difficulty
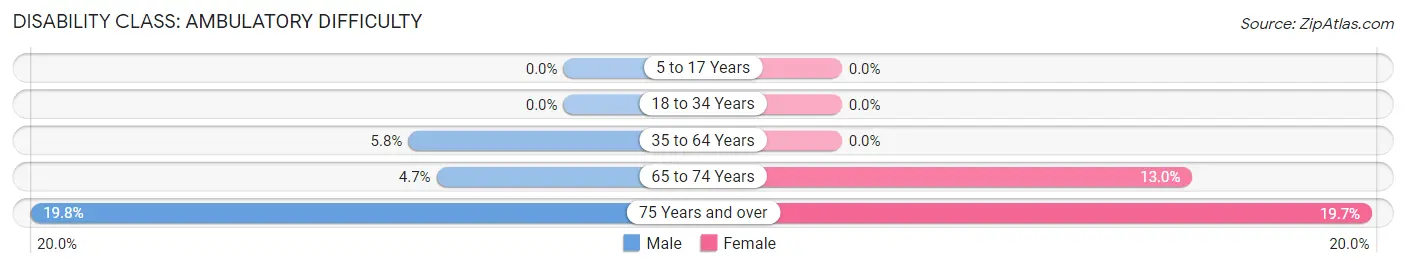
| Age Bracket | Male | Female |
| 5 to 17 Years | 0 (0.0%) | 0 (0.0%) |
| 18 to 34 Years | 0 (0.0%) | 0 (0.0%) |
| 35 to 64 Years | 63 (5.8%) | 0 (0.0%) |
| 65 to 74 Years | 25 (4.7%) | 77 (13.0%) |
| 75 Years and over | 77 (19.8%) | 86 (19.7%) |
Disability Class: Self-Care Difficulty
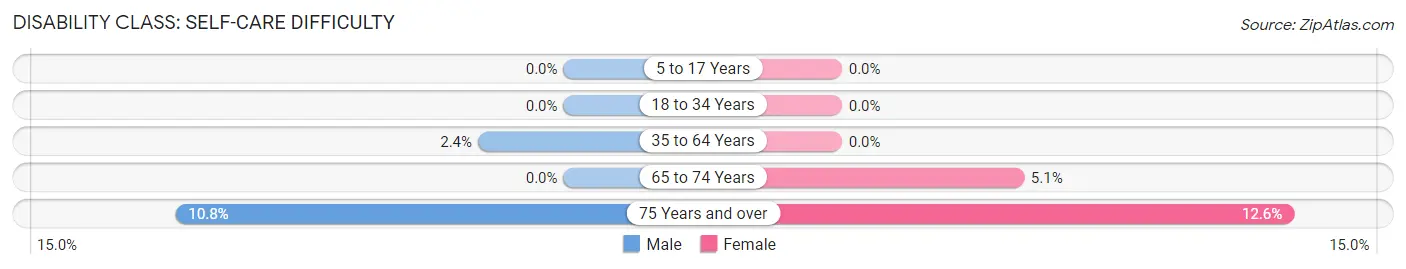
| Age Bracket | Male | Female |
| 5 to 17 Years | 0 (0.0%) | 0 (0.0%) |
| 18 to 34 Years | 0 (0.0%) | 0 (0.0%) |
| 35 to 64 Years | 26 (2.4%) | 0 (0.0%) |
| 65 to 74 Years | 0 (0.0%) | 30 (5.1%) |
| 75 Years and over | 42 (10.8%) | 55 (12.6%) |
Technology Access in Samsula Spruce Creek
Computing Device Access in Samsula Spruce Creek
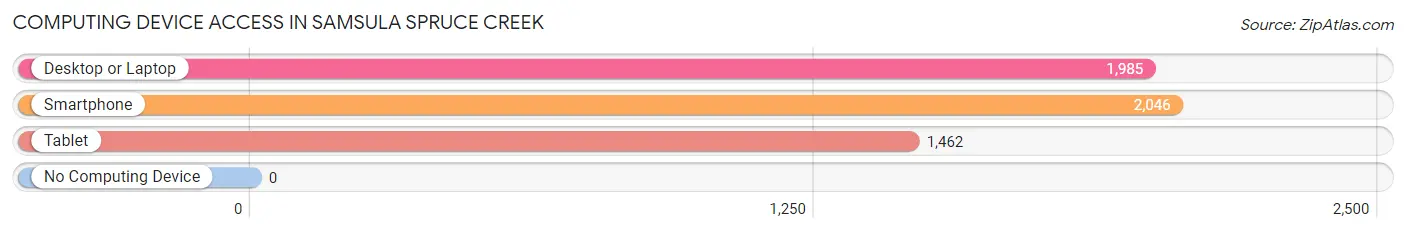
| Device Type | # Households | % Households |
| Desktop or Laptop | 1,985 | 91.7% |
| Smartphone | 2,046 | 94.5% |
| Tablet | 1,462 | 67.5% |
| No Computing Device | 0 | 0.0% |
| Total | 2,165 | 100.0% |
Internet Access in Samsula Spruce Creek
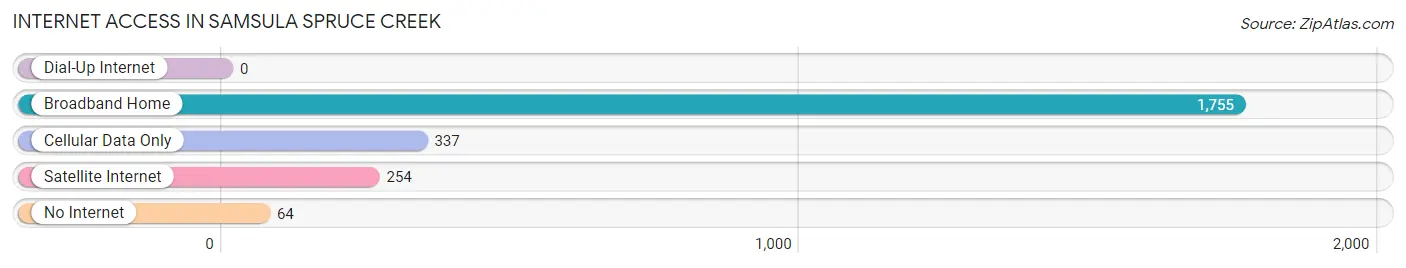
| Internet Type | # Households | % Households |
| Dial-Up Internet | 0 | 0.0% |
| Broadband Home | 1,755 | 81.1% |
| Cellular Data Only | 337 | 15.6% |
| Satellite Internet | 254 | 11.7% |
| No Internet | 64 | 3.0% |
| Total | 2,165 | 100.0% |
Samsula Spruce Creek Summary
Samsula Spruce Creek is a small unincorporated community located in Volusia County, Florida. It is situated on the banks of the Spruce Creek, a tributary of the Halifax River. The community is located approximately 10 miles south of Daytona Beach and is part of the Deltona–Daytona Beach–Ormond Beach metropolitan area.
History
Samsula Spruce Creek was first settled in the late 19th century by a group of settlers from the nearby town of Samsula. The settlers were attracted to the area by the abundance of timber and the potential for farming. The community was originally known as Samsula Spruce Creek, but the name was eventually shortened to Samsula Spruce Creek.
The community was officially incorporated in 1925 and was home to a variety of businesses, including a general store, a post office, a sawmill, and a grist mill. The community also had a school, which was built in the early 1900s and served the local children until it closed in the 1950s.
Geography
Samsula Spruce Creek is located in Volusia County, Florida, approximately 10 miles south of Daytona Beach. The community is situated on the banks of the Spruce Creek, a tributary of the Halifax River. The area is mostly flat and is covered with pine and palmetto trees.
Economy
Samsula Spruce Creek is a small, rural community with a limited economy. The primary industry in the area is agriculture, with the main crops being citrus, vegetables, and hay. The community also has a few small businesses, including a general store, a post office, and a sawmill.
Demographics
As of the 2010 census, the population of Samsula Spruce Creek was 1,845. The racial makeup of the community was 94.3% White, 2.2% African American, 0.3% Native American, 0.7% Asian, 0.1% Pacific Islander, and 2.4% from other races. The median household income was $41,250, and the median age was 44.7 years.
Conclusion
Samsula Spruce Creek is a small, rural community located in Volusia County, Florida. It was first settled in the late 19th century and was officially incorporated in 1925. The economy of the community is primarily based on agriculture, with the main crops being citrus, vegetables, and hay. The population of Samsula Spruce Creek was 1,845 as of the 2010 census, with the median household income being $41,250 and the median age being 44.7 years.
Common Questions
What is Per Capita Income in Samsula Spruce Creek?
Per Capita income in Samsula Spruce Creek is $44,282.
What is the Median Family Income in Samsula Spruce Creek?
Median Family Income in Samsula Spruce Creek is $100,441.
What is the Median Household income in Samsula Spruce Creek?
Median Household Income in Samsula Spruce Creek is $81,484.
What is Income or Wage Gap in Samsula Spruce Creek?
Income or Wage Gap in Samsula Spruce Creek is 58.2%.
Women in Samsula Spruce Creek earn 41.8 cents for every dollar earned by a man.
What is Inequality or Gini Index in Samsula Spruce Creek?
Inequality or Gini Index in Samsula Spruce Creek is 0.38.
What is the Total Population of Samsula Spruce Creek?
Total Population of Samsula Spruce Creek is 5,137.
What is the Total Male Population of Samsula Spruce Creek?
Total Male Population of Samsula Spruce Creek is 2,342.
What is the Total Female Population of Samsula Spruce Creek?
Total Female Population of Samsula Spruce Creek is 2,795.
What is the Ratio of Males per 100 Females in Samsula Spruce Creek?
There are 83.79 Males per 100 Females in Samsula Spruce Creek.
What is the Ratio of Females per 100 Males in Samsula Spruce Creek?
There are 119.34 Females per 100 Males in Samsula Spruce Creek.
What is the Median Population Age in Samsula Spruce Creek?
Median Population Age in Samsula Spruce Creek is 60.4 Years.
What is the Average Family Size in Samsula Spruce Creek
Average Family Size in Samsula Spruce Creek is 2.6 People.
What is the Average Household Size in Samsula Spruce Creek
Average Household Size in Samsula Spruce Creek is 2.4 People.
How Large is the Labor Force in Samsula Spruce Creek?
There are 2,160 People in the Labor Forcein in Samsula Spruce Creek.
What is the Percentage of People in the Labor Force in Samsula Spruce Creek?
44.5% of People are in the Labor Force in Samsula Spruce Creek.
What is the Unemployment Rate in Samsula Spruce Creek?
Unemployment Rate in Samsula Spruce Creek is 1.3%.