Goldenrod, FL Map & Demographics
Goldenrod Map
Goldenrod Overview
$33,795
PER CAPITA INCOME
$90,125
AVG FAMILY INCOME
$61,495
AVG HOUSEHOLD INCOME
1.4%
WAGE / INCOME GAP [ % ]
98.6¢/ $1
WAGE / INCOME GAP [ $ ]
$7,059
FAMILY INCOME DEFICIT
0.45
INEQUALITY / GINI INDEX
12,496
TOTAL POPULATION
6,179
MALE POPULATION
6,317
FEMALE POPULATION
97.82
MALES / 100 FEMALES
102.23
FEMALES / 100 MALES
32.3
MEDIAN AGE
3.0
AVG FAMILY SIZE
2.4
AVG HOUSEHOLD SIZE
7,393
LABOR FORCE [ PEOPLE ]
69.9%
PERCENT IN LABOR FORCE
8.8%
UNEMPLOYMENT RATE
Goldenrod Area Codes
Income in Goldenrod
Income Overview in Goldenrod
Per Capita Income in Goldenrod is $33,795, while median incomes of families and households are $90,125 and $61,495 respectively.
| Characteristic | Number | Measure |
| Per Capita Income | 12,496 | $33,795 |
| Median Family Income | 2,848 | $90,125 |
| Mean Family Income | 2,848 | $100,746 |
| Median Household Income | 5,247 | $61,495 |
| Mean Household Income | 5,247 | $77,832 |
| Income Deficit | 2,848 | $7,059 |
| Wage / Income Gap (%) | 12,496 | 1.41% |
| Wage / Income Gap ($) | 12,496 | 98.59¢ per $1 |
| Gini / Inequality Index | 12,496 | 0.45 |
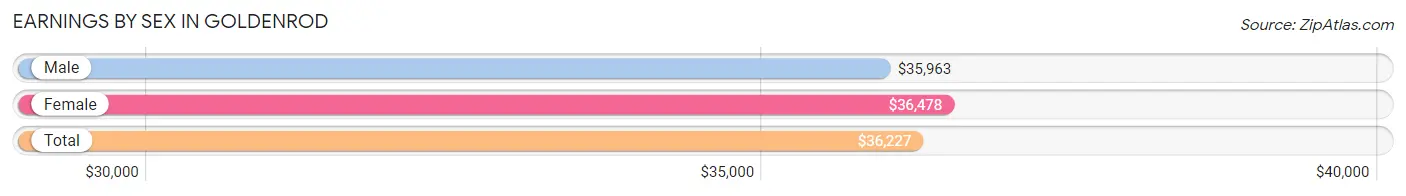
Earnings by Sex in Goldenrod
Average Earnings in Goldenrod are $36,227, $35,963 for men and $36,478 for women, a difference of 1.4%.
| Sex | Number | Average Earnings |
| Male | 3,802 (50.5%) | $35,963 |
| Female | 3,731 (49.5%) | $36,478 |
| Total | 7,533 (100.0%) | $36,227 |
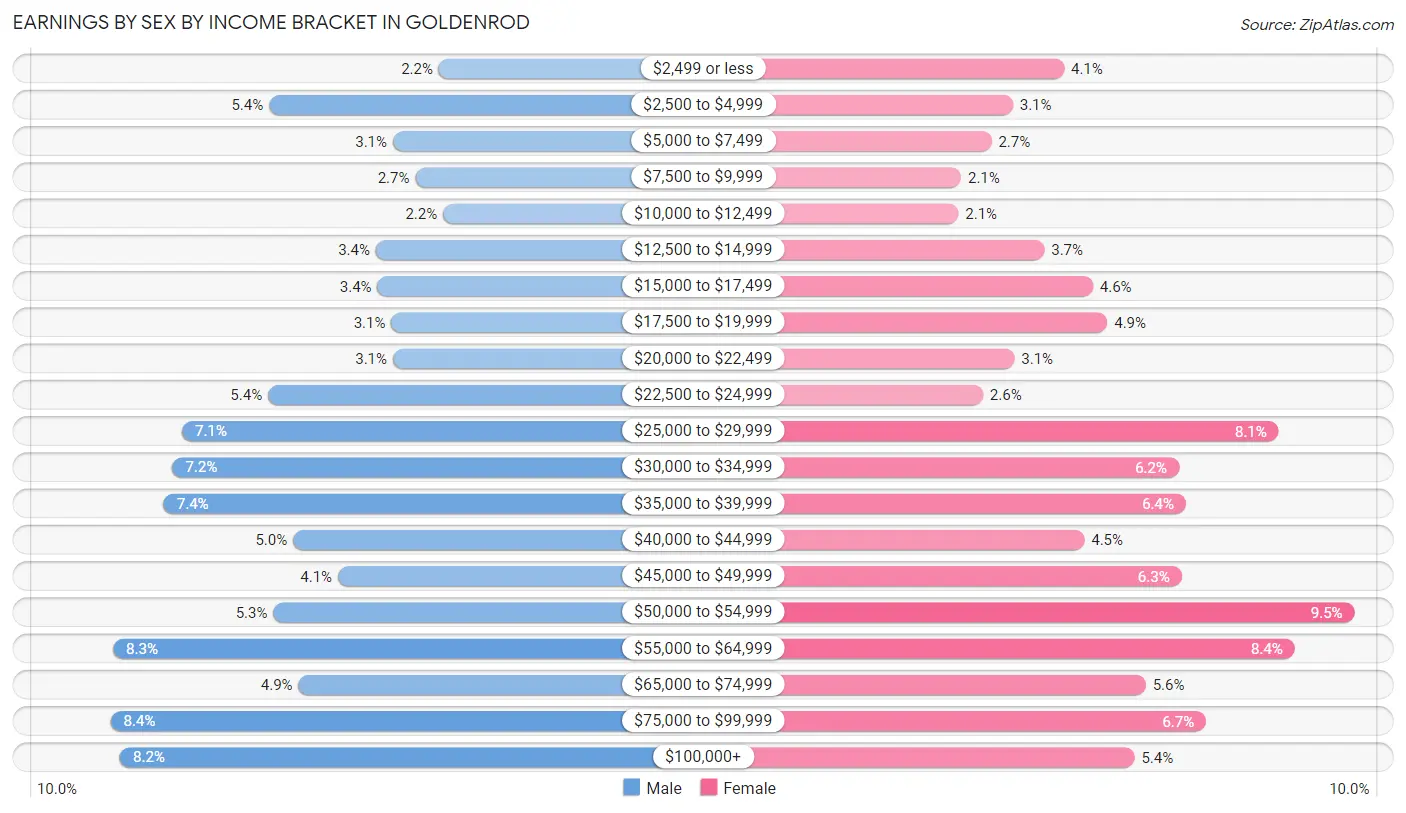
Earnings by Sex by Income Bracket in Goldenrod
The most common earnings brackets in Goldenrod are $75,000 to $99,999 for men (319 | 8.4%) and $50,000 to $54,999 for women (355 | 9.5%).
| Income | Male | Female |
| $2,499 or less | 85 (2.2%) | 152 (4.1%) |
| $2,500 to $4,999 | 206 (5.4%) | 116 (3.1%) |
| $5,000 to $7,499 | 118 (3.1%) | 101 (2.7%) |
| $7,500 to $9,999 | 102 (2.7%) | 80 (2.1%) |
| $10,000 to $12,499 | 82 (2.2%) | 78 (2.1%) |
| $12,500 to $14,999 | 130 (3.4%) | 138 (3.7%) |
| $15,000 to $17,499 | 129 (3.4%) | 172 (4.6%) |
| $17,500 to $19,999 | 119 (3.1%) | 182 (4.9%) |
| $20,000 to $22,499 | 118 (3.1%) | 117 (3.1%) |
| $22,500 to $24,999 | 207 (5.4%) | 95 (2.5%) |
| $25,000 to $29,999 | 268 (7.0%) | 302 (8.1%) |
| $30,000 to $34,999 | 275 (7.2%) | 232 (6.2%) |
| $35,000 to $39,999 | 281 (7.4%) | 237 (6.4%) |
| $40,000 to $44,999 | 189 (5.0%) | 166 (4.4%) |
| $45,000 to $49,999 | 157 (4.1%) | 234 (6.3%) |
| $50,000 to $54,999 | 203 (5.3%) | 355 (9.5%) |
| $55,000 to $64,999 | 317 (8.3%) | 313 (8.4%) |
| $65,000 to $74,999 | 185 (4.9%) | 209 (5.6%) |
| $75,000 to $99,999 | 319 (8.4%) | 251 (6.7%) |
| $100,000+ | 312 (8.2%) | 201 (5.4%) |
| Total | 3,802 (100.0%) | 3,731 (100.0%) |
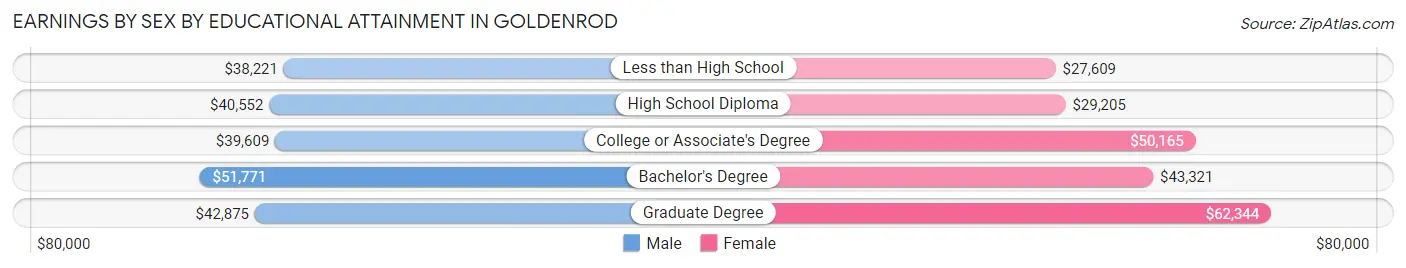
Earnings by Sex by Educational Attainment in Goldenrod
Average earnings in Goldenrod are $43,497 for men and $44,841 for women, a difference of 3.0%. Men with an educational attainment of bachelor's degree enjoy the highest average annual earnings of $51,771, while those with less than high school education earn the least with $38,221. Women with an educational attainment of graduate degree earn the most with the average annual earnings of $62,344, while those with less than high school education have the smallest earnings of $27,609.
| Educational Attainment | Male Income | Female Income |
| Less than High School | $38,221 | $27,609 |
| High School Diploma | $40,552 | $29,205 |
| College or Associate's Degree | $39,609 | $50,165 |
| Bachelor's Degree | $51,771 | $43,321 |
| Graduate Degree | $42,875 | $62,344 |
| Total | $43,497 | $44,841 |
Family Income in Goldenrod
Family Income Brackets in Goldenrod
According to the Goldenrod family income data, there are 629 families falling into the $75,000 to $99,999 income range, which is the most common income bracket and makes up 22.1% of all families.
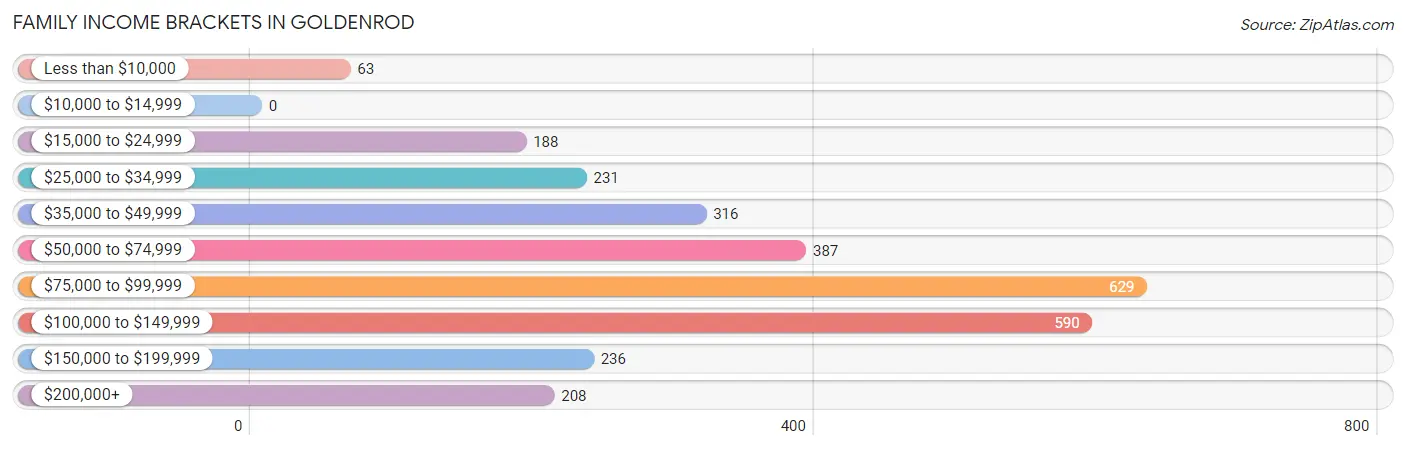
| Income Bracket | # Families | % Families |
| Less than $10,000 | 63 | 2.2% |
| $10,000 to $14,999 | 0 | 0.0% |
| $15,000 to $24,999 | 188 | 6.6% |
| $25,000 to $34,999 | 231 | 8.1% |
| $35,000 to $49,999 | 316 | 11.1% |
| $50,000 to $74,999 | 387 | 13.6% |
| $75,000 to $99,999 | 629 | 22.1% |
| $100,000 to $149,999 | 590 | 20.7% |
| $150,000 to $199,999 | 236 | 8.3% |
| $200,000+ | 208 | 7.3% |
Family Income by Famaliy Size in Goldenrod
6-person families (23 | 0.8%) account for the highest median family income in Goldenrod with $225,104 per family, while 2-person families (1,224 | 43.0%) have the highest median income of $38,036 per family member.
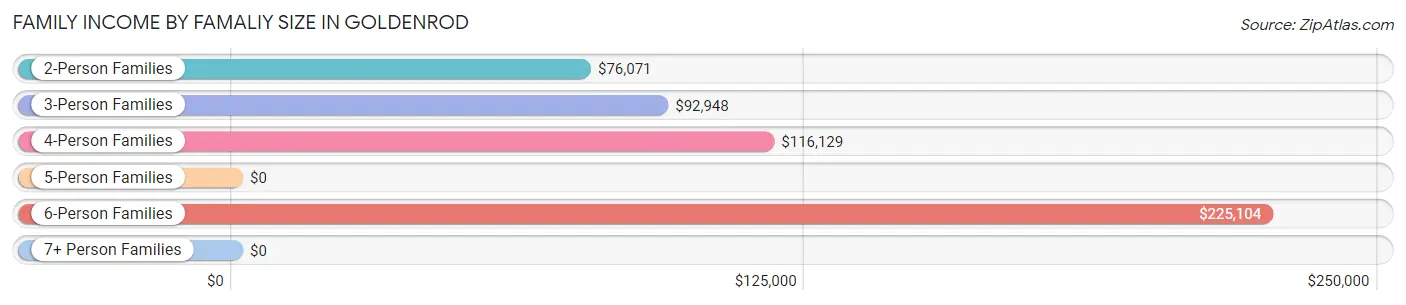
| Income Bracket | # Families | Median Income |
| 2-Person Families | 1,224 (43.0%) | $76,071 |
| 3-Person Families | 903 (31.7%) | $92,948 |
| 4-Person Families | 466 (16.4%) | $116,129 |
| 5-Person Families | 228 (8.0%) | $0 |
| 6-Person Families | 23 (0.8%) | $225,104 |
| 7+ Person Families | 4 (0.1%) | $0 |
| Total | 2,848 (100.0%) | $90,125 |
Family Income by Number of Earners in Goldenrod
The median family income in Goldenrod is $90,125, with families comprising 3+ earners (373) having the highest median family income of $135,054, while families with no earners (277) have the lowest median family income of $40,888, accounting for 13.1% and 9.7% of families, respectively.
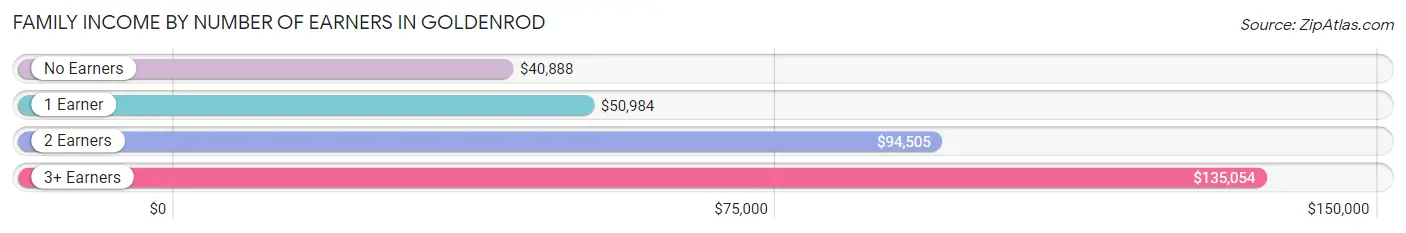
| Number of Earners | # Families | Median Income |
| No Earners | 277 (9.7%) | $40,888 |
| 1 Earner | 934 (32.8%) | $50,984 |
| 2 Earners | 1,264 (44.4%) | $94,505 |
| 3+ Earners | 373 (13.1%) | $135,054 |
| Total | 2,848 (100.0%) | $90,125 |
Household Income in Goldenrod
Household Income Brackets in Goldenrod
With 866 households falling in the category, the $100,000 to $149,999 income range is the most frequent in Goldenrod, accounting for 16.5% of all households. In contrast, only 163 households (3.1%) fall into the $10,000 to $14,999 income bracket, making it the least populous group.
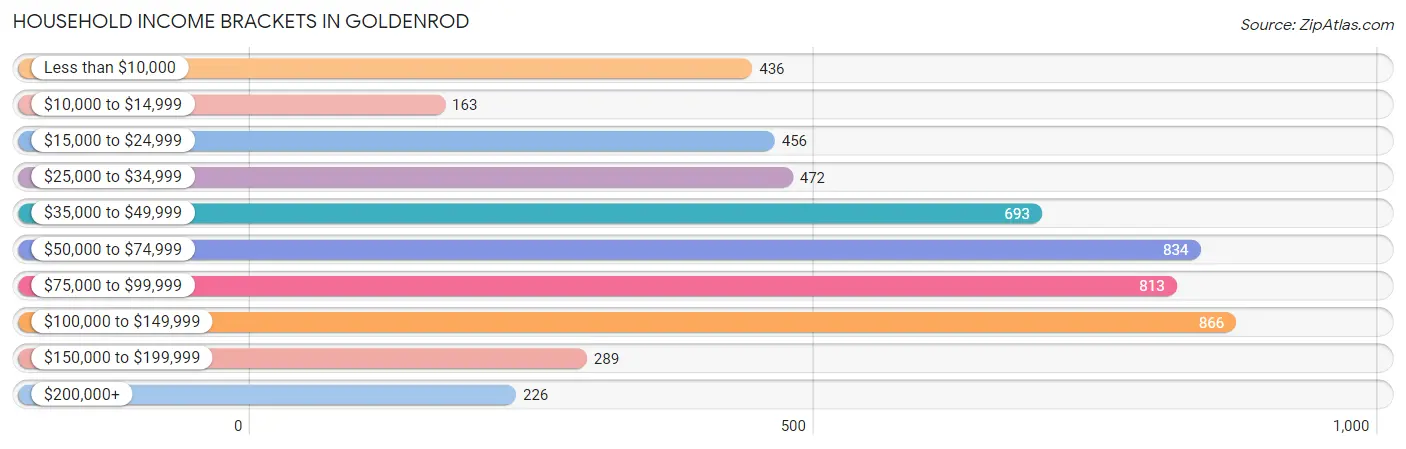
| Income Bracket | # Households | % Households |
| Less than $10,000 | 436 | 8.3% |
| $10,000 to $14,999 | 163 | 3.1% |
| $15,000 to $24,999 | 456 | 8.7% |
| $25,000 to $34,999 | 472 | 9.0% |
| $35,000 to $49,999 | 693 | 13.2% |
| $50,000 to $74,999 | 834 | 15.9% |
| $75,000 to $99,999 | 813 | 15.5% |
| $100,000 to $149,999 | 866 | 16.5% |
| $150,000 to $199,999 | 289 | 5.5% |
| $200,000+ | 226 | 4.3% |
Household Income by Householder Age in Goldenrod
The median household income in Goldenrod is $61,495, with the highest median household income of $80,804 found in the 25 to 44 years age bracket for the primary householder. A total of 2,143 households (40.8%) fall into this category. Meanwhile, the 15 to 24 years age bracket for the primary householder has the lowest median household income of $26,511, with 603 households (11.5%) in this group.
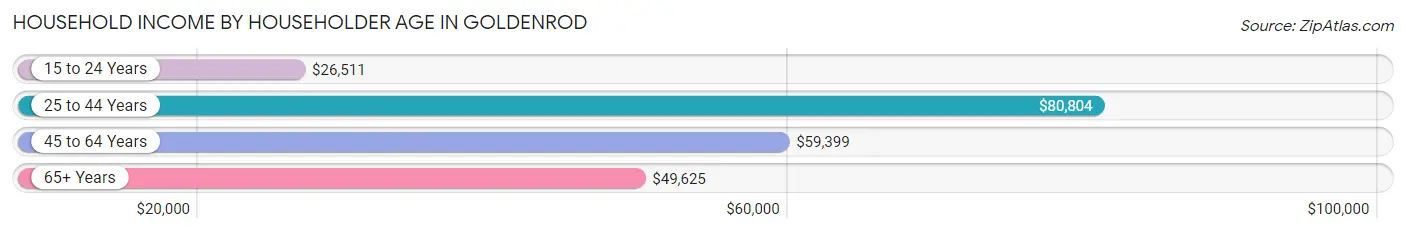
| Income Bracket | # Households | Median Income |
| 15 to 24 Years | 603 (11.5%) | $26,511 |
| 25 to 44 Years | 2,143 (40.8%) | $80,804 |
| 45 to 64 Years | 1,502 (28.6%) | $59,399 |
| 65+ Years | 999 (19.0%) | $49,625 |
| Total | 5,247 (100.0%) | $61,495 |
Poverty in Goldenrod
Income Below Poverty by Sex and Age in Goldenrod
With 16.1% poverty level for males and 15.6% for females among the residents of Goldenrod, 15 year old males and 15 year old females are the most vulnerable to poverty, with 68 males (86.1%) and 62 females (74.7%) in their respective age groups living below the poverty level.
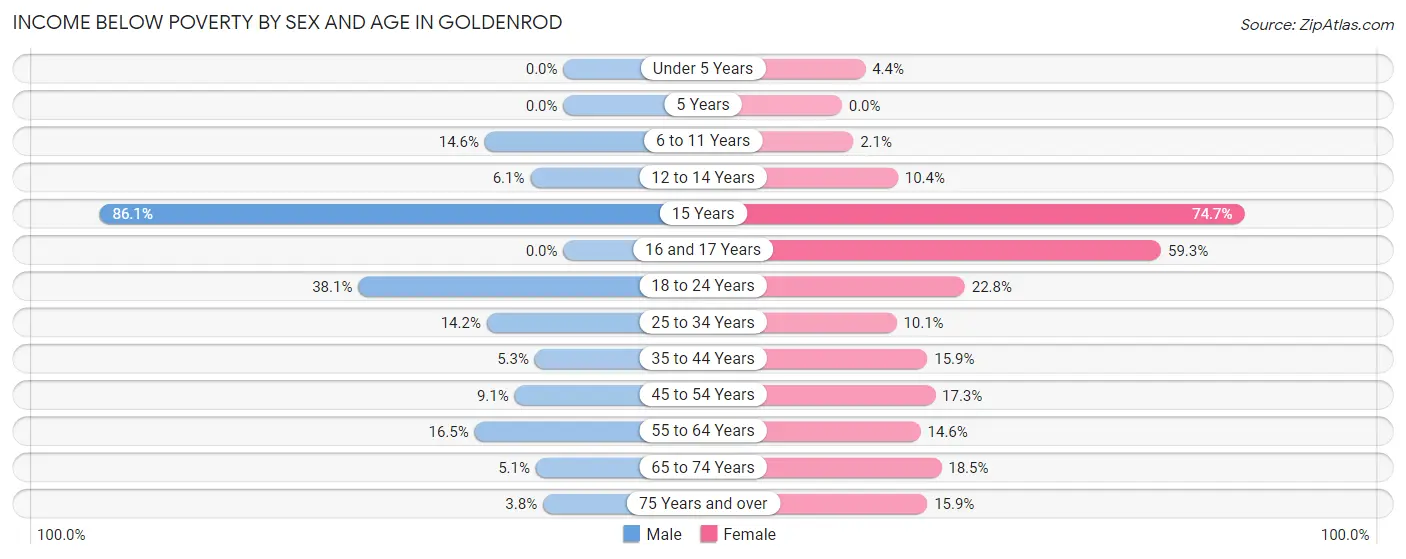
| Age Bracket | Male | Female |
| Under 5 Years | 0 (0.0%) | 12 (4.3%) |
| 5 Years | 0 (0.0%) | 0 (0.0%) |
| 6 to 11 Years | 50 (14.6%) | 8 (2.1%) |
| 12 to 14 Years | 14 (6.1%) | 18 (10.4%) |
| 15 Years | 68 (86.1%) | 62 (74.7%) |
| 16 and 17 Years | 0 (0.0%) | 64 (59.3%) |
| 18 to 24 Years | 415 (38.1%) | 174 (22.8%) |
| 25 to 34 Years | 204 (14.2%) | 136 (10.1%) |
| 35 to 44 Years | 35 (5.3%) | 140 (15.9%) |
| 45 to 54 Years | 52 (9.1%) | 120 (17.3%) |
| 55 to 64 Years | 117 (16.5%) | 96 (14.6%) |
| 65 to 74 Years | 25 (5.1%) | 84 (18.5%) |
| 75 Years and over | 7 (3.8%) | 68 (15.9%) |
| Total | 987 (16.1%) | 982 (15.6%) |
Income Above Poverty by Sex and Age in Goldenrod
According to the poverty statistics in Goldenrod, males aged under 5 years and females aged 5 years are the age groups that are most secure financially, with 100.0% of males and 100.0% of females in these age groups living above the poverty line.
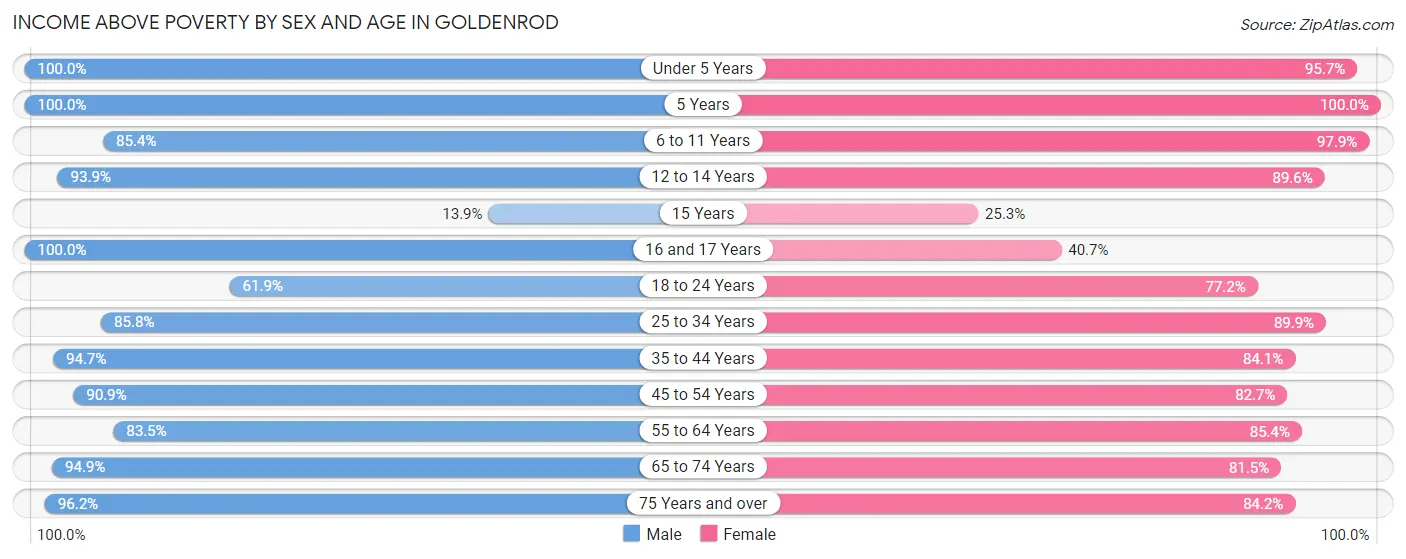
| Age Bracket | Male | Female |
| Under 5 Years | 254 (100.0%) | 264 (95.7%) |
| 5 Years | 8 (100.0%) | 59 (100.0%) |
| 6 to 11 Years | 293 (85.4%) | 370 (97.9%) |
| 12 to 14 Years | 214 (93.9%) | 155 (89.6%) |
| 15 Years | 11 (13.9%) | 21 (25.3%) |
| 16 and 17 Years | 88 (100.0%) | 44 (40.7%) |
| 18 to 24 Years | 675 (61.9%) | 588 (77.2%) |
| 25 to 34 Years | 1,231 (85.8%) | 1,205 (89.9%) |
| 35 to 44 Years | 625 (94.7%) | 742 (84.1%) |
| 45 to 54 Years | 522 (90.9%) | 573 (82.7%) |
| 55 to 64 Years | 593 (83.5%) | 560 (85.4%) |
| 65 to 74 Years | 464 (94.9%) | 371 (81.5%) |
| 75 Years and over | 178 (96.2%) | 361 (84.2%) |
| Total | 5,156 (83.9%) | 5,313 (84.4%) |
Income Below Poverty Among Married-Couple Families in Goldenrod
The poverty statistics for married-couple families in Goldenrod show that 3.2% or 60 of the total 1,884 families live below the poverty line. Families with 1 or 2 children have the highest poverty rate of 5.4%, comprising of 38 families. On the other hand, families with 3 or 4 children have the lowest poverty rate of 0.0%, which includes 0 families.
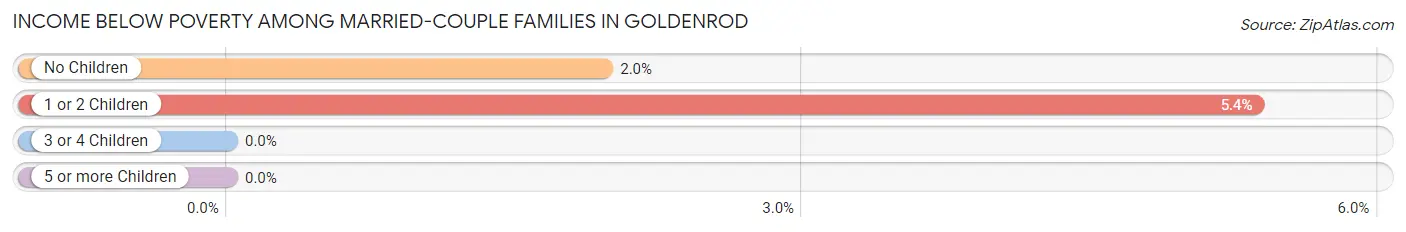
| Children | Above Poverty | Below Poverty |
| No Children | 1,101 (98.0%) | 22 (2.0%) |
| 1 or 2 Children | 671 (94.6%) | 38 (5.4%) |
| 3 or 4 Children | 48 (100.0%) | 0 (0.0%) |
| 5 or more Children | 4 (100.0%) | 0 (0.0%) |
| Total | 1,824 (96.8%) | 60 (3.2%) |
Income Below Poverty Among Single-Parent Households in Goldenrod
According to the poverty data in Goldenrod, 17.5% or 40 single-father households and 22.5% or 165 single-mother households are living below the poverty line. Among single-father households, those with 1 or 2 children have the highest poverty rate, with 24 households (30.8%) experiencing poverty. Likewise, among single-mother households, those with 3 or 4 children have the highest poverty rate, with 18 households (36.0%) falling below the poverty line.
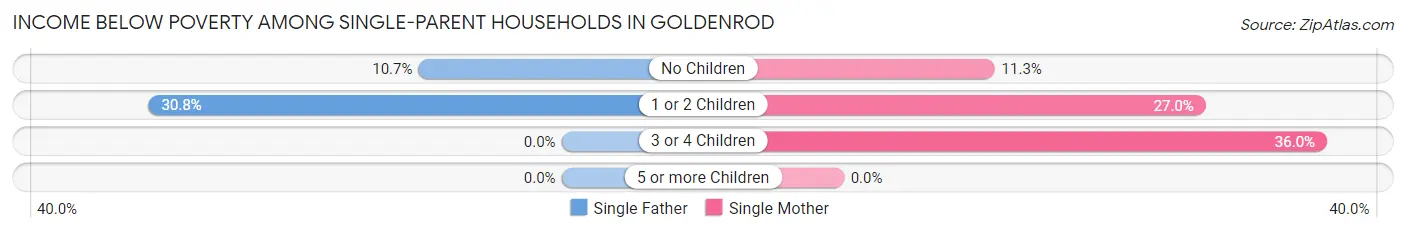
| Children | Single Father | Single Mother |
| No Children | 16 (10.7%) | 27 (11.3%) |
| 1 or 2 Children | 24 (30.8%) | 120 (27.0%) |
| 3 or 4 Children | 0 (0.0%) | 18 (36.0%) |
| 5 or more Children | 0 (0.0%) | 0 (0.0%) |
| Total | 40 (17.5%) | 165 (22.5%) |
Income Below Poverty Among Married-Couple vs Single-Parent Households in Goldenrod
The poverty data for Goldenrod shows that 60 of the married-couple family households (3.2%) and 205 of the single-parent households (21.3%) are living below the poverty level. Within the married-couple family households, those with 1 or 2 children have the highest poverty rate, with 38 households (5.4%) falling below the poverty line. Among the single-parent households, those with 3 or 4 children have the highest poverty rate, with 18 household (36.0%) living below poverty.
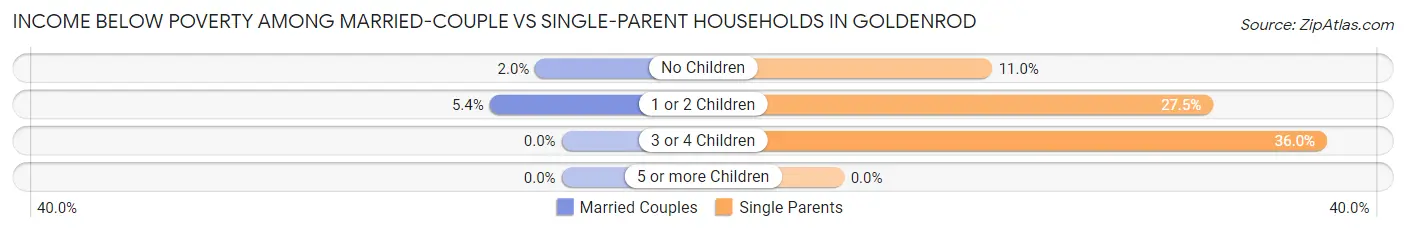
| Children | Married-Couple Families | Single-Parent Households |
| No Children | 22 (2.0%) | 43 (11.0%) |
| 1 or 2 Children | 38 (5.4%) | 144 (27.5%) |
| 3 or 4 Children | 0 (0.0%) | 18 (36.0%) |
| 5 or more Children | 0 (0.0%) | 0 (0.0%) |
| Total | 60 (3.2%) | 205 (21.3%) |
Race in Goldenrod
The most populous races in Goldenrod are White / Caucasian (7,994 | 64.0%), Hispanic or Latino (3,298 | 26.4%), and Two or more Races (1,565 | 12.5%).
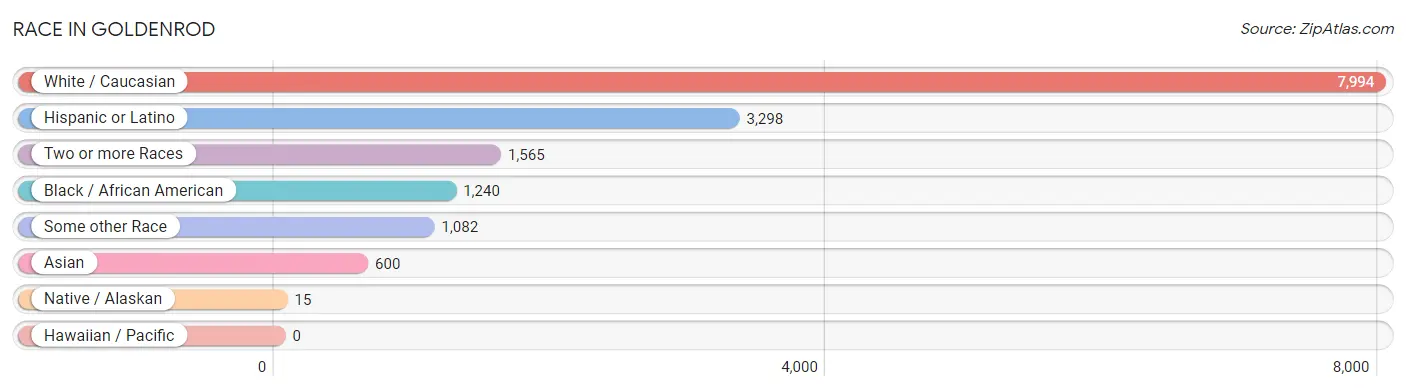
| Race | # Population | % Population |
| Asian | 600 | 4.8% |
| Black / African American | 1,240 | 9.9% |
| Hawaiian / Pacific | 0 | 0.0% |
| Hispanic or Latino | 3,298 | 26.4% |
| Native / Alaskan | 15 | 0.1% |
| White / Caucasian | 7,994 | 64.0% |
| Two or more Races | 1,565 | 12.5% |
| Some other Race | 1,082 | 8.7% |
| Total | 12,496 | 100.0% |
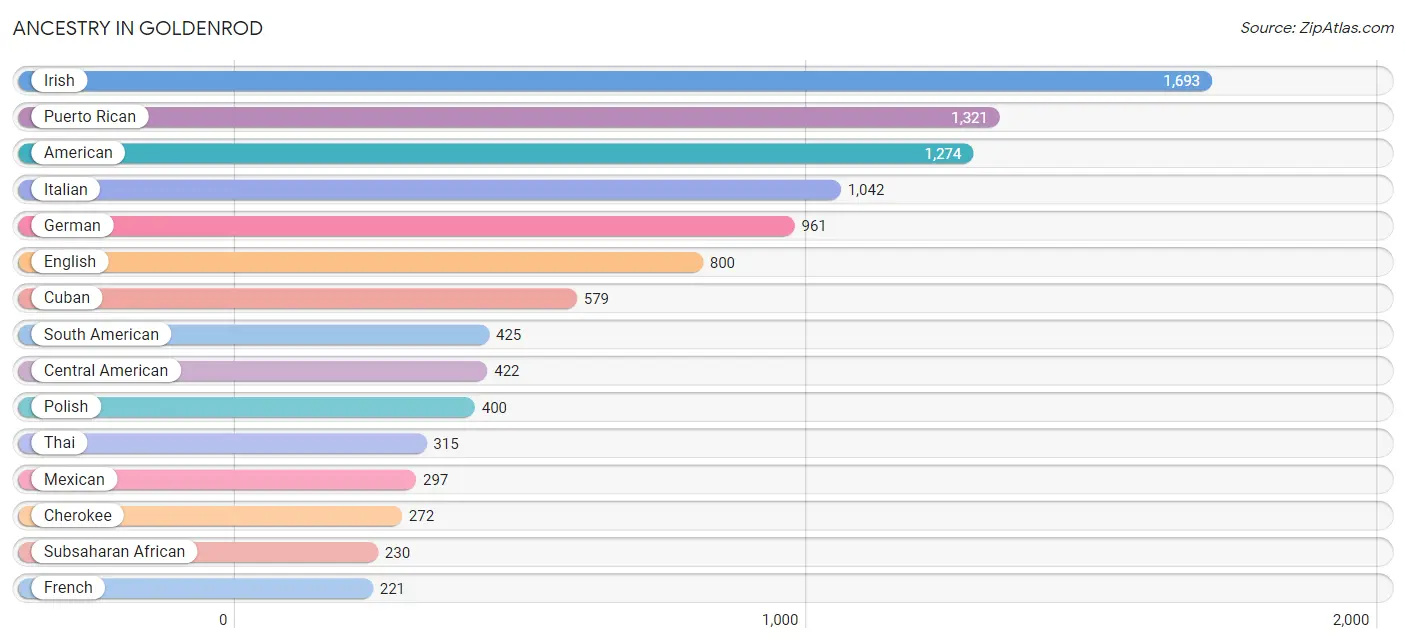
Ancestry in Goldenrod
The most populous ancestries reported in Goldenrod are Irish (1,693 | 13.6%), Puerto Rican (1,321 | 10.6%), American (1,274 | 10.2%), Italian (1,042 | 8.3%), and German (961 | 7.7%), together accounting for 50.3% of all Goldenrod residents.
| Ancestry | # Population | % Population |
| African | 203 | 1.6% |
| American | 1,274 | 10.2% |
| Apache | 11 | 0.1% |
| Arab | 67 | 0.5% |
| Argentinean | 7 | 0.1% |
| Armenian | 1 | 0.0% |
| Austrian | 29 | 0.2% |
| Bahamian | 24 | 0.2% |
| Basque | 16 | 0.1% |
| Belgian | 5 | 0.0% |
| Bhutanese | 34 | 0.3% |
| Bolivian | 17 | 0.1% |
| Brazilian | 11 | 0.1% |
| British | 145 | 1.2% |
| British West Indian | 21 | 0.2% |
| Burmese | 79 | 0.6% |
| Cajun | 8 | 0.1% |
| Canadian | 8 | 0.1% |
| Central American | 422 | 3.4% |
| Central American Indian | 15 | 0.1% |
| Cherokee | 272 | 2.2% |
| Chilean | 37 | 0.3% |
| Colombian | 72 | 0.6% |
| Costa Rican | 42 | 0.3% |
| Cuban | 579 | 4.6% |
| Czech | 114 | 0.9% |
| Danish | 32 | 0.3% |
| Dominican | 161 | 1.3% |
| Dutch | 76 | 0.6% |
| Eastern European | 36 | 0.3% |
| Ecuadorian | 65 | 0.5% |
| English | 800 | 6.4% |
| European | 207 | 1.7% |
| Finnish | 15 | 0.1% |
| French | 221 | 1.8% |
| French Canadian | 49 | 0.4% |
| German | 961 | 7.7% |
| Greek | 7 | 0.1% |
| Guamanian / Chamorro | 21 | 0.2% |
| Guatemalan | 80 | 0.6% |
| Guyanese | 129 | 1.0% |
| Haitian | 102 | 0.8% |
| Honduran | 17 | 0.1% |
| Hungarian | 41 | 0.3% |
| Indian (Asian) | 61 | 0.5% |
| Irish | 1,693 | 13.6% |
| Iroquois | 4 | 0.0% |
| Israeli | 35 | 0.3% |
| Italian | 1,042 | 8.3% |
| Jamaican | 148 | 1.2% |
| Japanese | 14 | 0.1% |
| Korean | 74 | 0.6% |
| Lebanese | 42 | 0.3% |
| Lithuanian | 73 | 0.6% |
| Malaysian | 23 | 0.2% |
| Maltese | 7 | 0.1% |
| Mexican | 297 | 2.4% |
| Nicaraguan | 173 | 1.4% |
| Northern European | 17 | 0.1% |
| Norwegian | 106 | 0.9% |
| Pakistani | 23 | 0.2% |
| Palestinian | 7 | 0.1% |
| Panamanian | 51 | 0.4% |
| Peruvian | 33 | 0.3% |
| Polish | 400 | 3.2% |
| Portuguese | 89 | 0.7% |
| Puerto Rican | 1,321 | 10.6% |
| Romanian | 12 | 0.1% |
| Russian | 87 | 0.7% |
| Salvadoran | 59 | 0.5% |
| Scandinavian | 63 | 0.5% |
| Scotch-Irish | 62 | 0.5% |
| Scottish | 94 | 0.7% |
| Slavic | 98 | 0.8% |
| Slovak | 117 | 0.9% |
| South African | 20 | 0.2% |
| South American | 425 | 3.4% |
| Spaniard | 10 | 0.1% |
| Spanish | 83 | 0.7% |
| Sri Lankan | 121 | 1.0% |
| Subsaharan African | 230 | 1.8% |
| Swedish | 52 | 0.4% |
| Swiss | 48 | 0.4% |
| Thai | 315 | 2.5% |
| U.S. Virgin Islander | 7 | 0.1% |
| Ukrainian | 20 | 0.2% |
| Venezuelan | 194 | 1.5% |
| Vietnamese | 32 | 0.3% |
| Welsh | 103 | 0.8% | View All 89 Rows |
Immigrants in Goldenrod
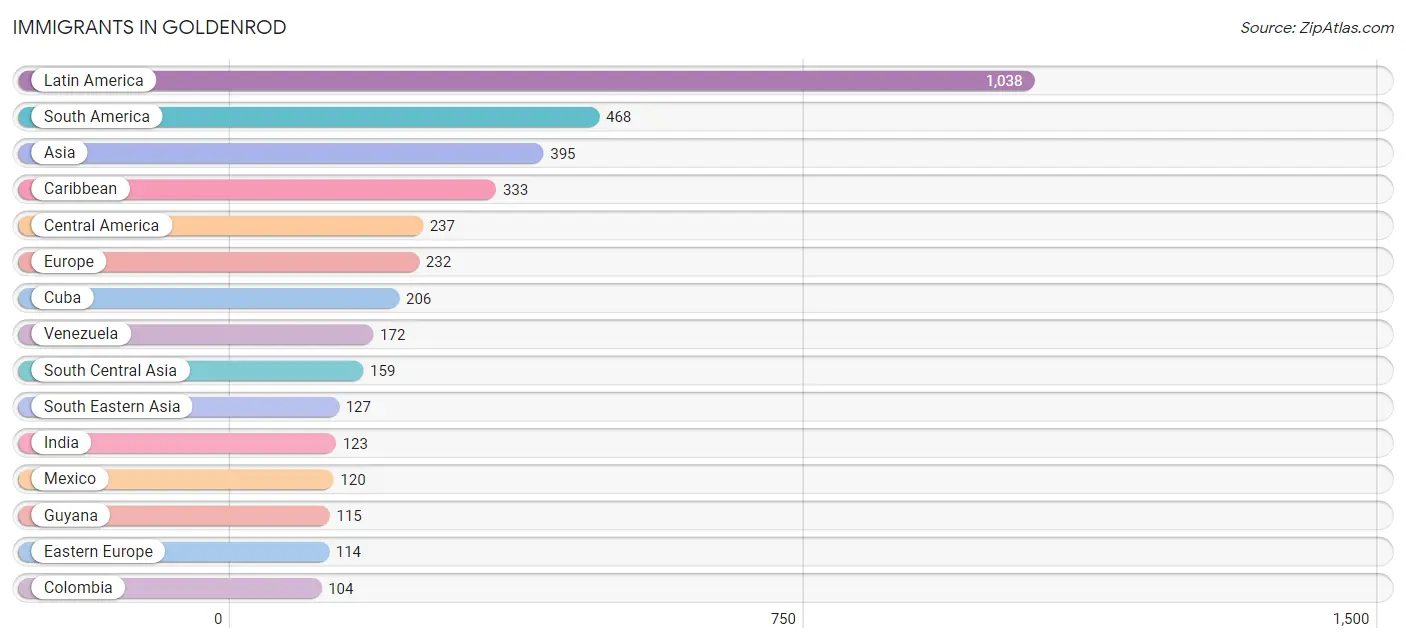
The most numerous immigrant groups reported in Goldenrod came from Latin America (1,038 | 8.3%), South America (468 | 3.7%), Asia (395 | 3.2%), Caribbean (333 | 2.7%), and Central America (237 | 1.9%), together accounting for 19.8% of all Goldenrod residents.
| Immigration Origin | # Population | % Population |
| Africa | 27 | 0.2% |
| Argentina | 7 | 0.1% |
| Asia | 395 | 3.2% |
| Bahamas | 24 | 0.2% |
| Bangladesh | 21 | 0.2% |
| Brazil | 12 | 0.1% |
| Canada | 12 | 0.1% |
| Caribbean | 333 | 2.7% |
| Central America | 237 | 1.9% |
| Chile | 7 | 0.1% |
| China | 11 | 0.1% |
| Colombia | 104 | 0.8% |
| Costa Rica | 15 | 0.1% |
| Cuba | 206 | 1.7% |
| Czechoslovakia | 83 | 0.7% |
| Dominican Republic | 74 | 0.6% |
| Eastern Africa | 7 | 0.1% |
| Eastern Asia | 19 | 0.2% |
| Eastern Europe | 114 | 0.9% |
| Ecuador | 18 | 0.1% |
| El Salvador | 7 | 0.1% |
| England | 14 | 0.1% |
| Europe | 232 | 1.9% |
| France | 36 | 0.3% |
| Germany | 8 | 0.1% |
| Guatemala | 32 | 0.3% |
| Guyana | 115 | 0.9% |
| India | 123 | 1.0% |
| Italy | 9 | 0.1% |
| Jamaica | 29 | 0.2% |
| Kenya | 7 | 0.1% |
| Korea | 8 | 0.1% |
| Kuwait | 18 | 0.1% |
| Latin America | 1,038 | 8.3% |
| Lebanon | 8 | 0.1% |
| Mexico | 120 | 1.0% |
| Nicaragua | 63 | 0.5% |
| Northern Europe | 50 | 0.4% |
| Peru | 33 | 0.3% |
| Philippines | 30 | 0.2% |
| Poland | 14 | 0.1% |
| Portugal | 6 | 0.1% |
| South Africa | 20 | 0.2% |
| South America | 468 | 3.7% |
| South Central Asia | 159 | 1.3% |
| South Eastern Asia | 127 | 1.0% |
| Southern Europe | 22 | 0.2% |
| Sri Lanka | 15 | 0.1% |
| Switzerland | 2 | 0.0% |
| Taiwan | 11 | 0.1% |
| Thailand | 6 | 0.1% |
| Turkey | 10 | 0.1% |
| Ukraine | 17 | 0.1% |
| Venezuela | 172 | 1.4% |
| Vietnam | 91 | 0.7% |
| Western Asia | 90 | 0.7% |
| Western Europe | 46 | 0.4% | View All 57 Rows |
Sex and Age in Goldenrod
Sex and Age in Goldenrod
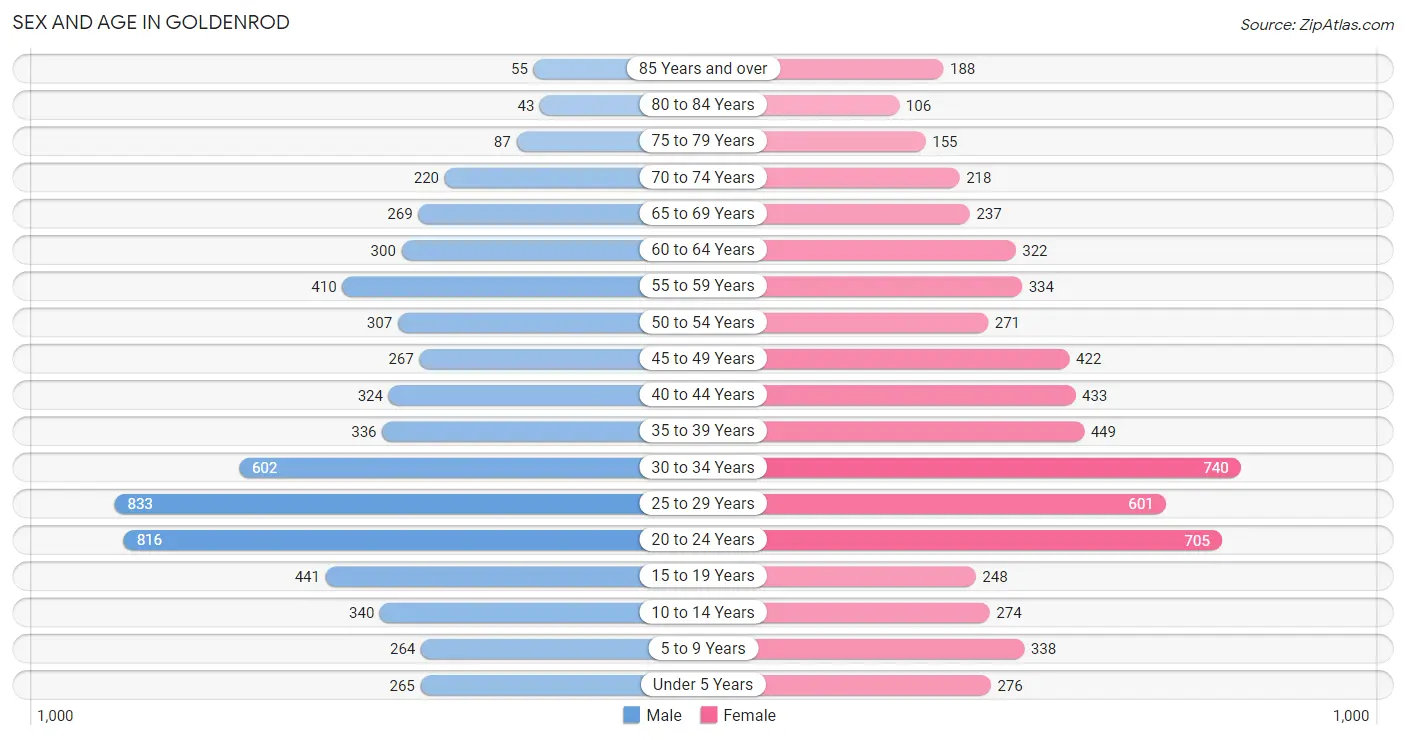
The most populous age groups in Goldenrod are 25 to 29 Years (833 | 13.5%) for men and 30 to 34 Years (740 | 11.7%) for women.
| Age Bracket | Male | Female |
| Under 5 Years | 265 (4.3%) | 276 (4.4%) |
| 5 to 9 Years | 264 (4.3%) | 338 (5.3%) |
| 10 to 14 Years | 340 (5.5%) | 274 (4.3%) |
| 15 to 19 Years | 441 (7.1%) | 248 (3.9%) |
| 20 to 24 Years | 816 (13.2%) | 705 (11.2%) |
| 25 to 29 Years | 833 (13.5%) | 601 (9.5%) |
| 30 to 34 Years | 602 (9.7%) | 740 (11.7%) |
| 35 to 39 Years | 336 (5.4%) | 449 (7.1%) |
| 40 to 44 Years | 324 (5.2%) | 433 (6.9%) |
| 45 to 49 Years | 267 (4.3%) | 422 (6.7%) |
| 50 to 54 Years | 307 (5.0%) | 271 (4.3%) |
| 55 to 59 Years | 410 (6.6%) | 334 (5.3%) |
| 60 to 64 Years | 300 (4.9%) | 322 (5.1%) |
| 65 to 69 Years | 269 (4.3%) | 237 (3.7%) |
| 70 to 74 Years | 220 (3.6%) | 218 (3.5%) |
| 75 to 79 Years | 87 (1.4%) | 155 (2.5%) |
| 80 to 84 Years | 43 (0.7%) | 106 (1.7%) |
| 85 Years and over | 55 (0.9%) | 188 (3.0%) |
| Total | 6,179 (100.0%) | 6,317 (100.0%) |
Families and Households in Goldenrod
Median Family Size in Goldenrod
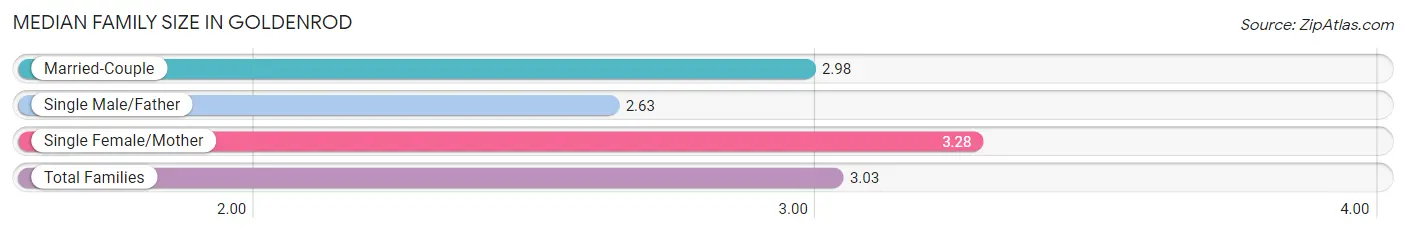
The median family size in Goldenrod is 3.03 persons per family, with single female/mother families (735 | 25.8%) accounting for the largest median family size of 3.28 persons per family. On the other hand, single male/father families (229 | 8.0%) represent the smallest median family size with 2.63 persons per family.
| Family Type | # Families | Family Size |
| Married-Couple | 1,884 (66.1%) | 2.98 |
| Single Male/Father | 229 (8.0%) | 2.63 |
| Single Female/Mother | 735 (25.8%) | 3.28 |
| Total Families | 2,848 (100.0%) | 3.03 |
Median Household Size in Goldenrod
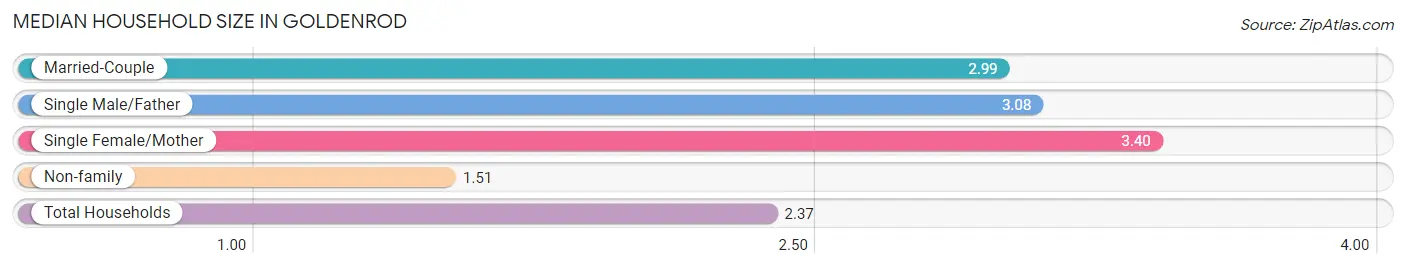
The median household size in Goldenrod is 2.37 persons per household, with single female/mother households (735 | 14.0%) accounting for the largest median household size of 3.4 persons per household. non-family households (2,399 | 45.7%) represent the smallest median household size with 1.51 persons per household.
| Household Type | # Households | Household Size |
| Married-Couple | 1,884 (35.9%) | 2.99 |
| Single Male/Father | 229 (4.4%) | 3.08 |
| Single Female/Mother | 735 (14.0%) | 3.40 |
| Non-family | 2,399 (45.7%) | 1.51 |
| Total Households | 5,247 (100.0%) | 2.37 |
Household Size by Marriage Status in Goldenrod
Out of a total of 5,247 households in Goldenrod, 2,848 (54.3%) are family households, while 2,399 (45.7%) are nonfamily households. The most numerous type of family households are 2-person households, comprising 1,110, and the most common type of nonfamily households are 1-person households, comprising 1,527.
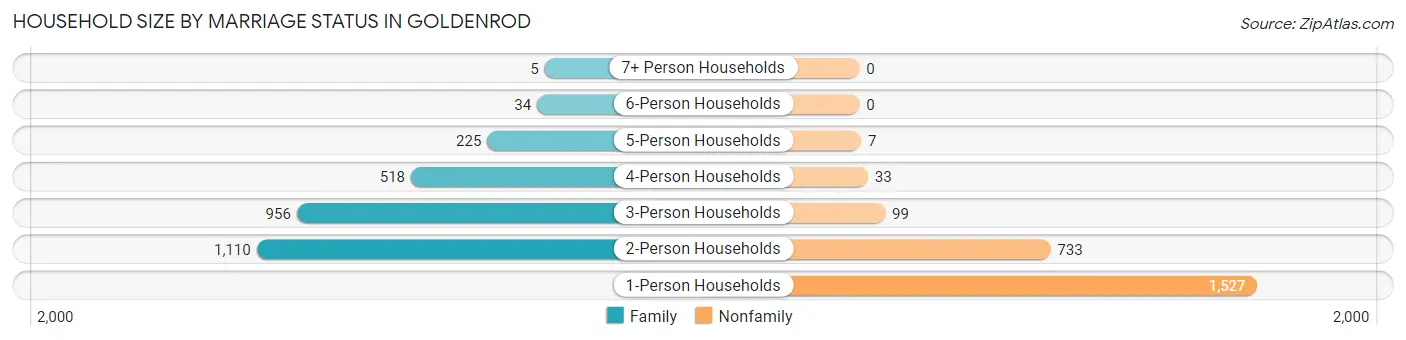
| Household Size | Family Households | Nonfamily Households |
| 1-Person Households | - | 1,527 (29.1%) |
| 2-Person Households | 1,110 (21.1%) | 733 (14.0%) |
| 3-Person Households | 956 (18.2%) | 99 (1.9%) |
| 4-Person Households | 518 (9.9%) | 33 (0.6%) |
| 5-Person Households | 225 (4.3%) | 7 (0.1%) |
| 6-Person Households | 34 (0.6%) | 0 (0.0%) |
| 7+ Person Households | 5 (0.1%) | 0 (0.0%) |
| Total | 2,848 (54.3%) | 2,399 (45.7%) |
Female Fertility in Goldenrod
Fertility by Age in Goldenrod
Average fertility rate in Goldenrod is 33.0 births per 1,000 women. Women in the age bracket of 20 to 34 years have the highest fertility rate with 42.0 births per 1,000 women. Women in the age bracket of 20 to 34 years acount for 70.5% of all women with births.
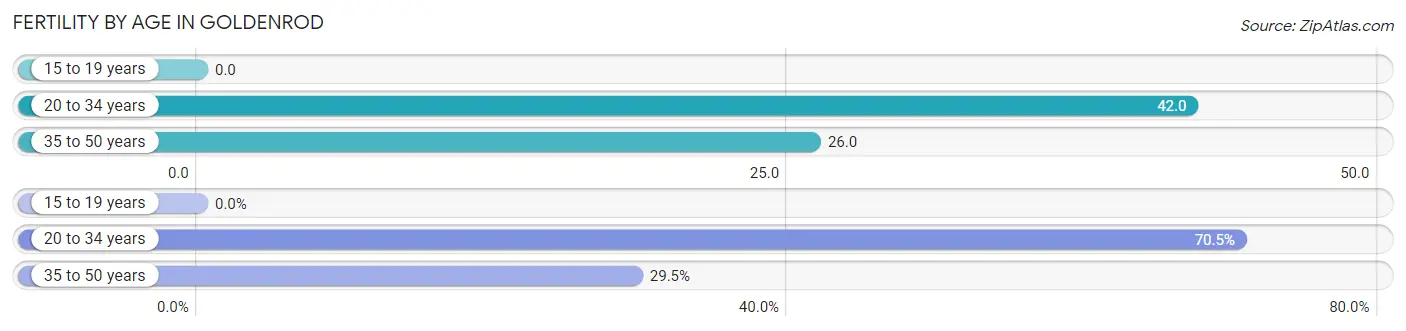
| Age Bracket | Women with Births | Births / 1,000 Women |
| 15 to 19 years | 0 (0.0%) | 0.0 |
| 20 to 34 years | 86 (70.5%) | 42.0 |
| 35 to 50 years | 36 (29.5%) | 26.0 |
| Total | 122 (100.0%) | 33.0 |
Fertility by Age by Marriage Status in Goldenrod
67.2% of women with births (122) in Goldenrod are married. The highest percentage of unmarried women with births falls into 20 to 34 years age bracket with 46.5% of them unmarried at the time of birth, while the lowest percentage of unmarried women with births belong to 35 to 50 years age bracket with 0.0% of them unmarried.
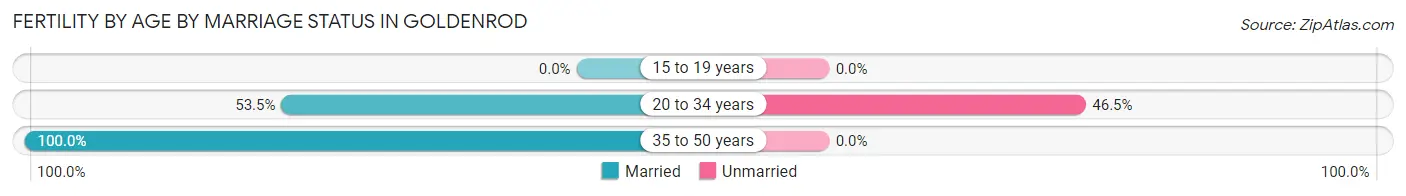
| Age Bracket | Married | Unmarried |
| 15 to 19 years | 0 (0.0%) | 0 (0.0%) |
| 20 to 34 years | 46 (53.5%) | 40 (46.5%) |
| 35 to 50 years | 36 (100.0%) | 0 (0.0%) |
| Total | 82 (67.2%) | 40 (32.8%) |
Fertility by Education in Goldenrod
Average fertility rate in Goldenrod is 33.0 births per 1,000 women. Women with the education attainment of high school diploma have the highest fertility rate of 55.0 births per 1,000 women, while women with the education attainment of college or associate's degree have the lowest fertility at 14.0 births per 1,000 women. Women with the education attainment of high school diploma represent 32.8% of all women with births.
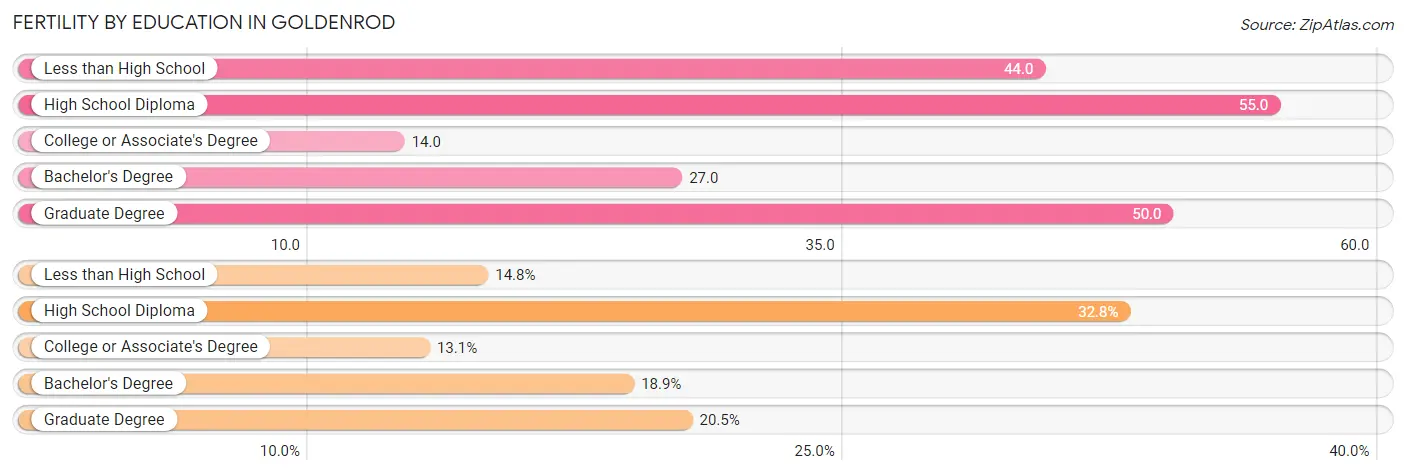
| Educational Attainment | Women with Births | Births / 1,000 Women |
| Less than High School | 18 (14.7%) | 44.0 |
| High School Diploma | 40 (32.8%) | 55.0 |
| College or Associate's Degree | 16 (13.1%) | 14.0 |
| Bachelor's Degree | 23 (18.9%) | 27.0 |
| Graduate Degree | 25 (20.5%) | 50.0 |
| Total | 122 (100.0%) | 33.0 |
Fertility by Education by Marriage Status in Goldenrod
32.8% of women with births in Goldenrod are unmarried. Women with the educational attainment of less than high school are most likely to be married with 100.0% of them married at childbirth, while women with the educational attainment of high school diploma are least likely to be married with 100.0% of them unmarried at childbirth.
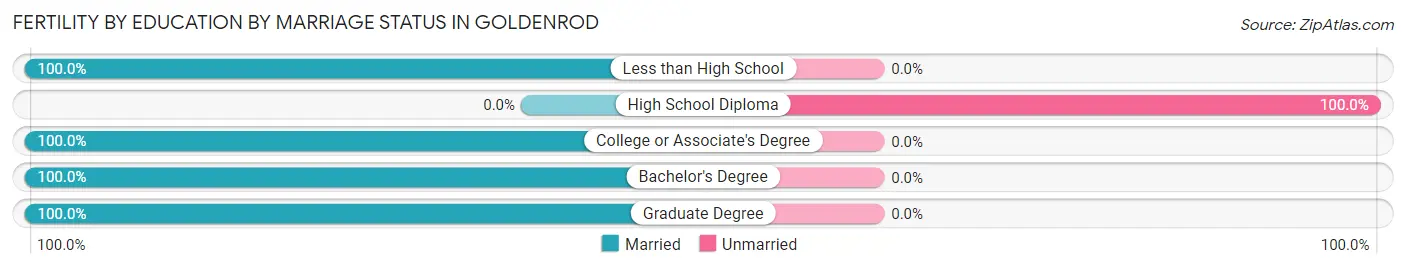
| Educational Attainment | Married | Unmarried |
| Less than High School | 18 (100.0%) | 0 (0.0%) |
| High School Diploma | 0 (0.0%) | 40 (100.0%) |
| College or Associate's Degree | 16 (100.0%) | 0 (0.0%) |
| Bachelor's Degree | 23 (100.0%) | 0 (0.0%) |
| Graduate Degree | 25 (100.0%) | 0 (0.0%) |
| Total | 82 (67.2%) | 40 (32.8%) |
Employment Characteristics in Goldenrod
Employment by Class of Employer in Goldenrod
Among the 6,675 employed individuals in Goldenrod, private company employees (4,972 | 74.5%), not-for-profit organizations (412 | 6.2%), and local government employees (353 | 5.3%) make up the most common classes of employment.
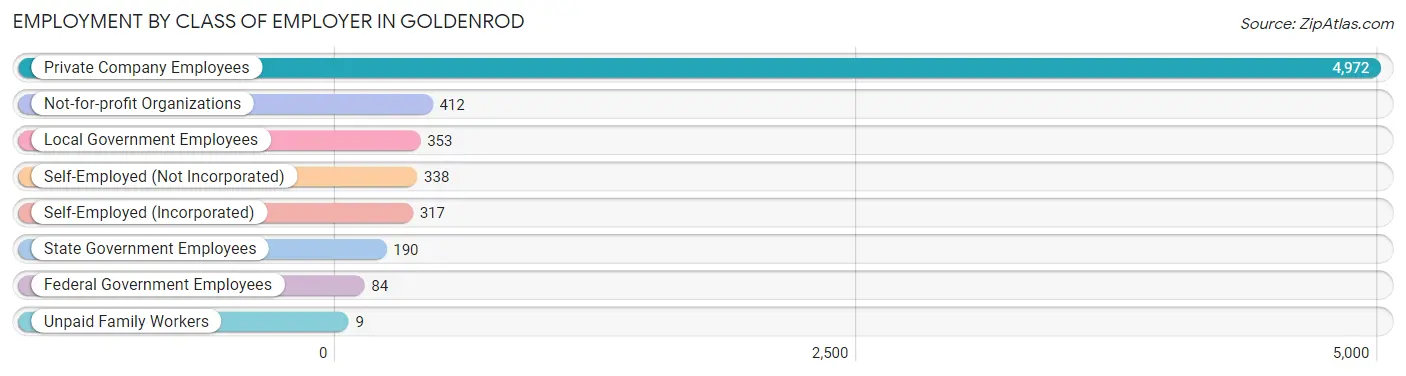
| Employer Class | # Employees | % Employees |
| Private Company Employees | 4,972 | 74.5% |
| Self-Employed (Incorporated) | 317 | 4.8% |
| Self-Employed (Not Incorporated) | 338 | 5.1% |
| Not-for-profit Organizations | 412 | 6.2% |
| Local Government Employees | 353 | 5.3% |
| State Government Employees | 190 | 2.9% |
| Federal Government Employees | 84 | 1.3% |
| Unpaid Family Workers | 9 | 0.1% |
| Total | 6,675 | 100.0% |
Employment Status by Age in Goldenrod
According to the labor force statistics for Goldenrod, out of the total population over 16 years of age (10,577), 69.9% or 7,393 individuals are in the labor force, with 8.8% or 651 of them unemployed. The age group with the highest labor force participation rate is 30 to 34 years, with 94.0% or 1,261 individuals in the labor force. Within the labor force, the 16 to 19 years age range has the highest percentage of unemployed individuals, with 27.7% or 49 of them being unemployed.
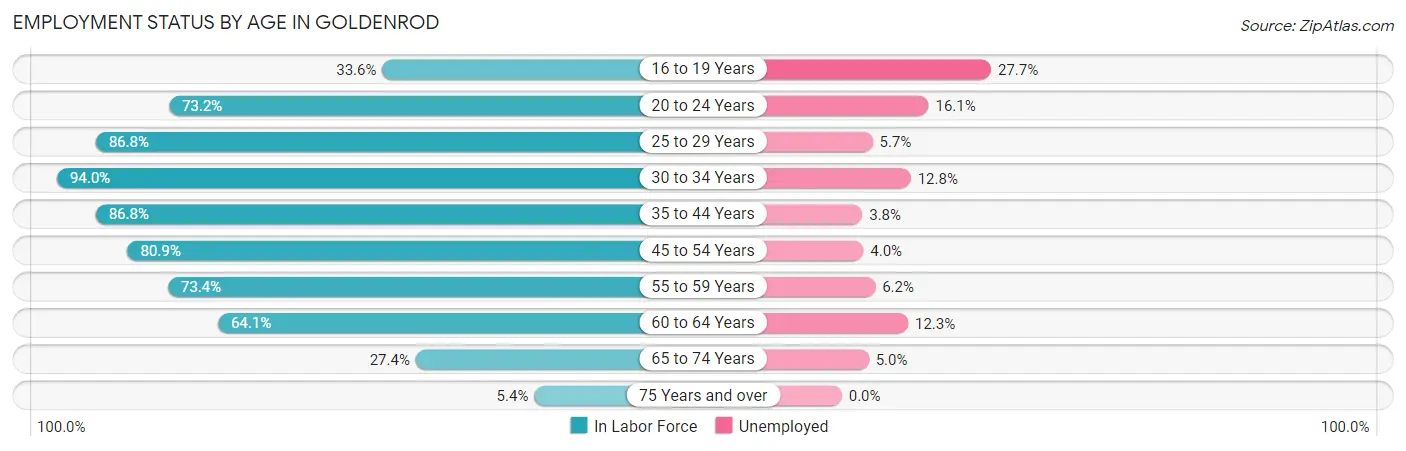
| Age Bracket | In Labor Force | Unemployed |
| 16 to 19 Years | 177 (33.6%) | 49 (27.7%) |
| 20 to 24 Years | 1,113 (73.2%) | 179 (16.1%) |
| 25 to 29 Years | 1,245 (86.8%) | 71 (5.7%) |
| 30 to 34 Years | 1,261 (94.0%) | 161 (12.8%) |
| 35 to 44 Years | 1,338 (86.8%) | 51 (3.8%) |
| 45 to 54 Years | 1,025 (80.9%) | 41 (4.0%) |
| 55 to 59 Years | 546 (73.4%) | 34 (6.2%) |
| 60 to 64 Years | 399 (64.1%) | 49 (12.3%) |
| 65 to 74 Years | 259 (27.4%) | 13 (5.0%) |
| 75 Years and over | 34 (5.4%) | 0 (0.0%) |
| Total | 7,393 (69.9%) | 651 (8.8%) |
Employment Status by Educational Attainment in Goldenrod
According to labor force statistics for Goldenrod, 83.7% of individuals (5,818) out of the total population between 25 and 64 years of age (6,951) are in the labor force, with 7.0% or 407 of them being unemployed. The group with the highest labor force participation rate are those with the educational attainment of bachelor's degree or higher, with 89.4% or 2,449 individuals in the labor force. Within the labor force, individuals with bachelor's degree or higher education have the highest percentage of unemployment, with 9.6% or 235 of them being unemployed.
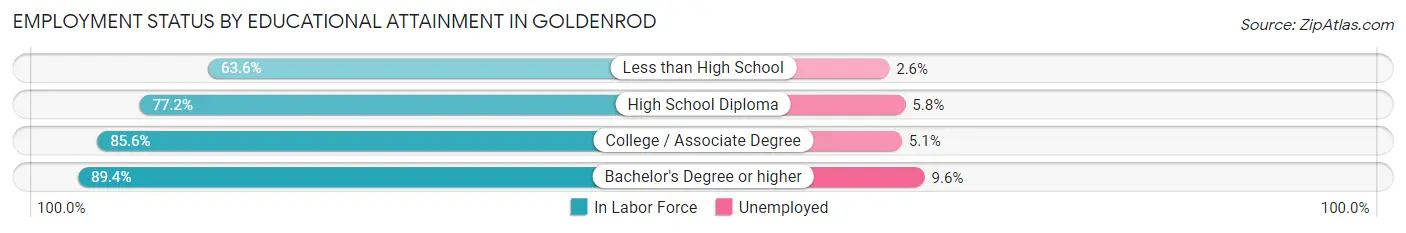
| Educational Attainment | In Labor Force | Unemployed |
| Less than High School | 307 (63.6%) | 13 (2.6%) |
| High School Diploma | 1,220 (77.2%) | 92 (5.8%) |
| College / Associate Degree | 1,840 (85.6%) | 110 (5.1%) |
| Bachelor's Degree or higher | 2,449 (89.4%) | 263 (9.6%) |
| Total | 5,818 (83.7%) | 487 (7.0%) |
Employment Occupations by Sex in Goldenrod
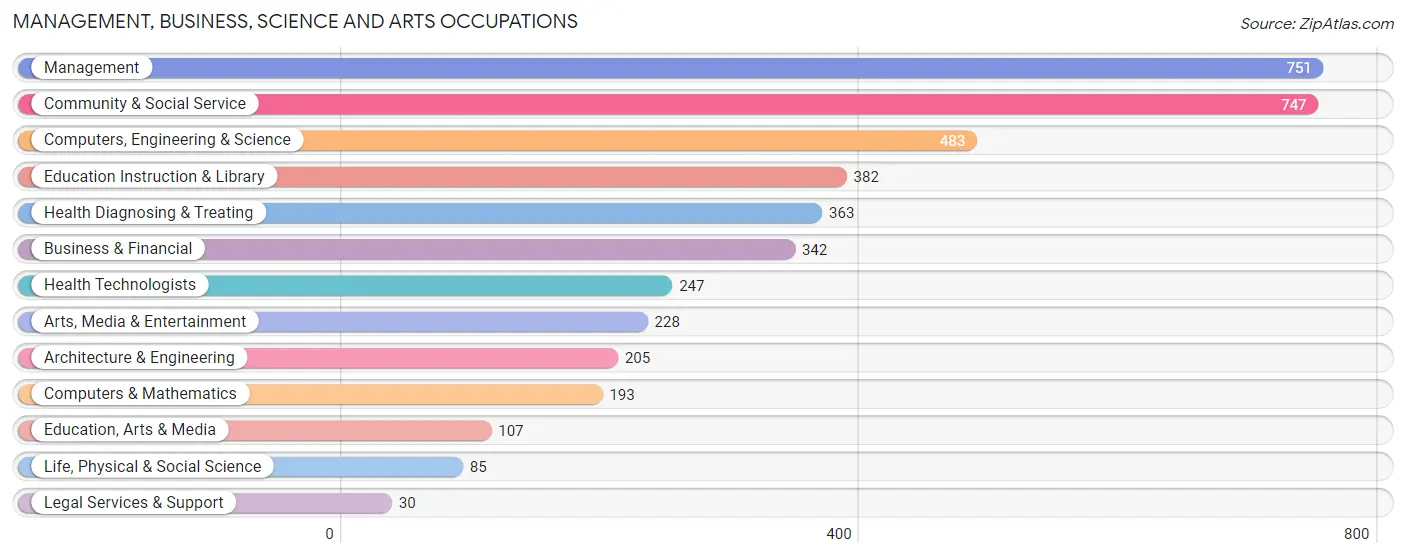
Management, Business, Science and Arts Occupations
The most common Management, Business, Science and Arts occupations in Goldenrod are Management (751 | 11.1%), Community & Social Service (747 | 11.1%), Computers, Engineering & Science (483 | 7.2%), Education Instruction & Library (382 | 5.7%), and Health Diagnosing & Treating (363 | 5.4%).
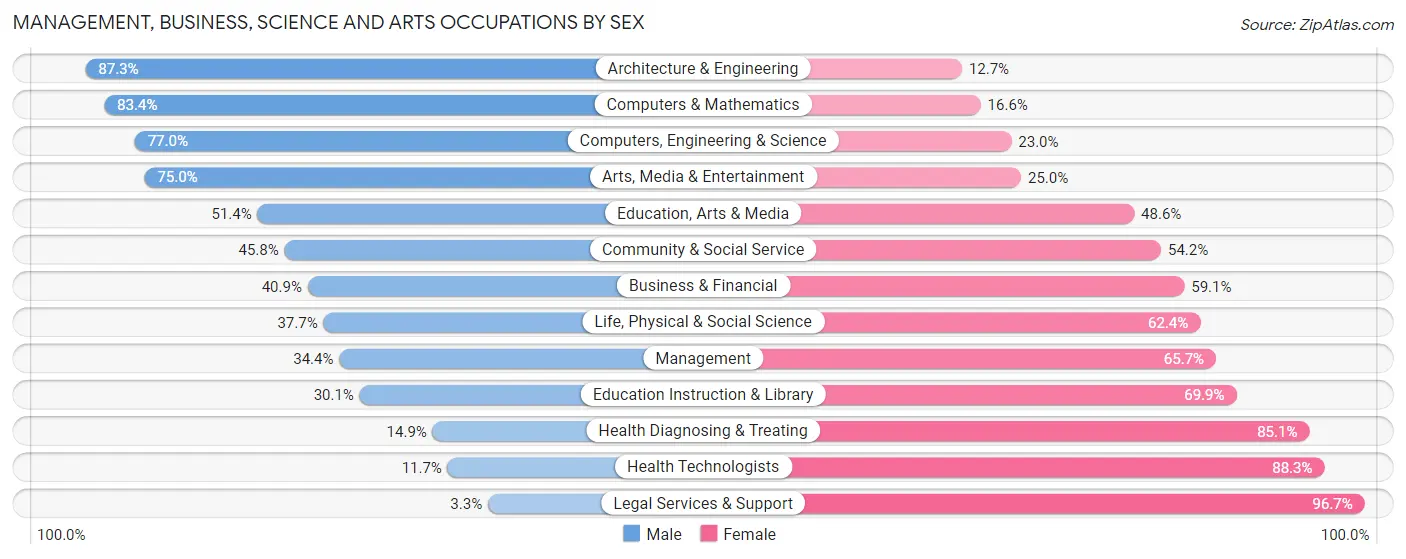
Management, Business, Science and Arts Occupations by Sex
Within the Management, Business, Science and Arts occupations in Goldenrod, the most male-oriented occupations are Architecture & Engineering (87.3%), Computers & Mathematics (83.4%), and Computers, Engineering & Science (77.0%), while the most female-oriented occupations are Legal Services & Support (96.7%), Health Technologists (88.3%), and Health Diagnosing & Treating (85.1%).
| Occupation | Male | Female |
| Management | 258 (34.4%) | 493 (65.6%) |
| Business & Financial | 140 (40.9%) | 202 (59.1%) |
| Computers, Engineering & Science | 372 (77.0%) | 111 (23.0%) |
| Computers & Mathematics | 161 (83.4%) | 32 (16.6%) |
| Architecture & Engineering | 179 (87.3%) | 26 (12.7%) |
| Life, Physical & Social Science | 32 (37.7%) | 53 (62.4%) |
| Community & Social Service | 342 (45.8%) | 405 (54.2%) |
| Education, Arts & Media | 55 (51.4%) | 52 (48.6%) |
| Legal Services & Support | 1 (3.3%) | 29 (96.7%) |
| Education Instruction & Library | 115 (30.1%) | 267 (69.9%) |
| Arts, Media & Entertainment | 171 (75.0%) | 57 (25.0%) |
| Health Diagnosing & Treating | 54 (14.9%) | 309 (85.1%) |
| Health Technologists | 29 (11.7%) | 218 (88.3%) |
| Total (Category) | 1,166 (43.4%) | 1,520 (56.6%) |
| Total (Overall) | 3,277 (48.5%) | 3,473 (51.4%) |
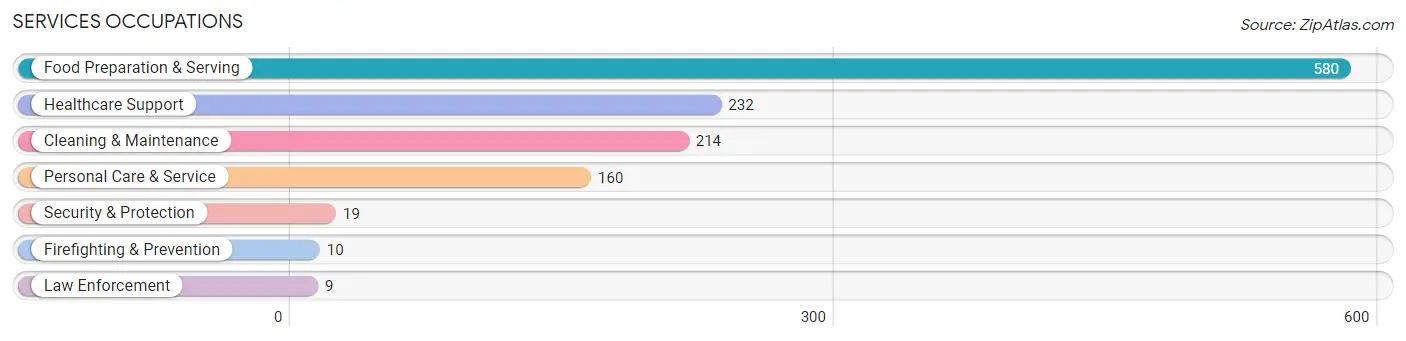
Services Occupations
The most common Services occupations in Goldenrod are Food Preparation & Serving (580 | 8.6%), Healthcare Support (232 | 3.4%), Cleaning & Maintenance (214 | 3.2%), Personal Care & Service (160 | 2.4%), and Security & Protection (19 | 0.3%).
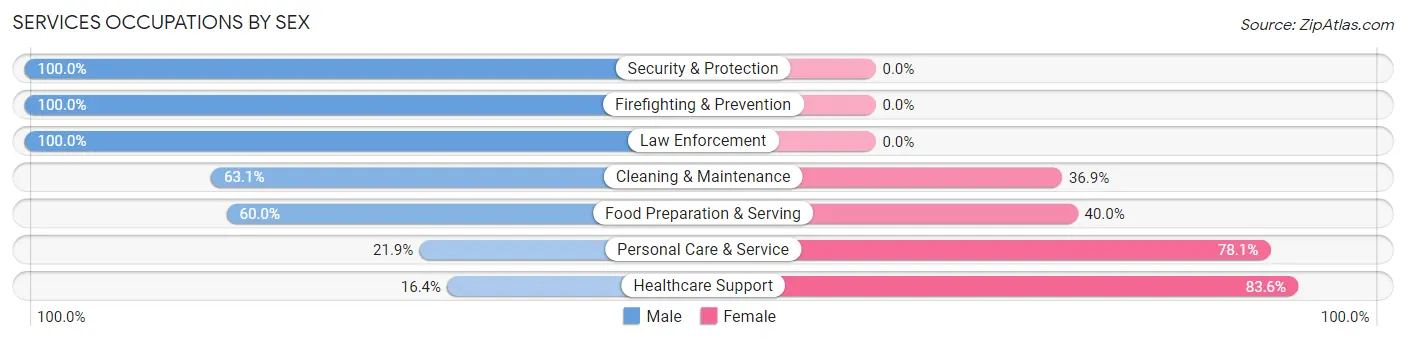
Services Occupations by Sex
Within the Services occupations in Goldenrod, the most male-oriented occupations are Security & Protection (100.0%), Firefighting & Prevention (100.0%), and Law Enforcement (100.0%), while the most female-oriented occupations are Healthcare Support (83.6%), Personal Care & Service (78.1%), and Food Preparation & Serving (40.0%).
| Occupation | Male | Female |
| Healthcare Support | 38 (16.4%) | 194 (83.6%) |
| Security & Protection | 19 (100.0%) | 0 (0.0%) |
| Firefighting & Prevention | 10 (100.0%) | 0 (0.0%) |
| Law Enforcement | 9 (100.0%) | 0 (0.0%) |
| Food Preparation & Serving | 348 (60.0%) | 232 (40.0%) |
| Cleaning & Maintenance | 135 (63.1%) | 79 (36.9%) |
| Personal Care & Service | 35 (21.9%) | 125 (78.1%) |
| Total (Category) | 575 (47.7%) | 630 (52.3%) |
| Total (Overall) | 3,277 (48.5%) | 3,473 (51.4%) |
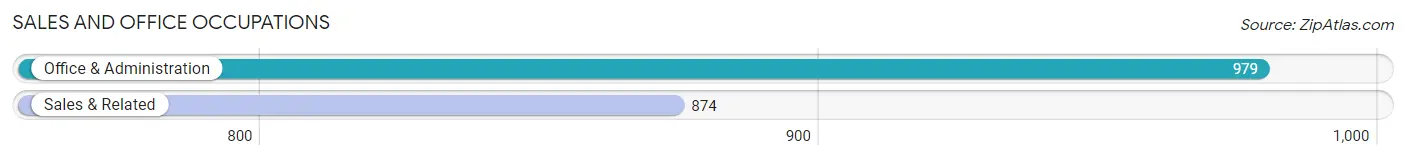
Sales and Office Occupations
The most common Sales and Office occupations in Goldenrod are Office & Administration (979 | 14.5%), and Sales & Related (874 | 13.0%).
Sales and Office Occupations by Sex
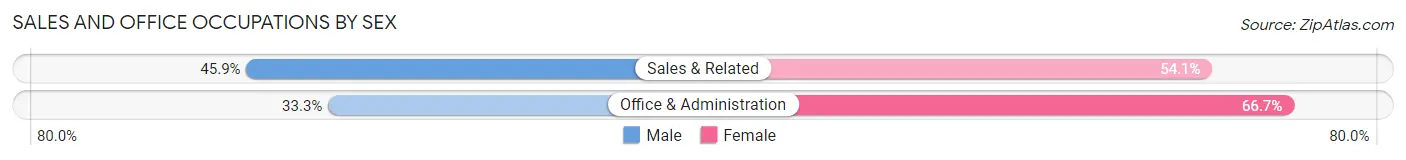
| Occupation | Male | Female |
| Sales & Related | 401 (45.9%) | 473 (54.1%) |
| Office & Administration | 326 (33.3%) | 653 (66.7%) |
| Total (Category) | 727 (39.2%) | 1,126 (60.8%) |
| Total (Overall) | 3,277 (48.5%) | 3,473 (51.4%) |
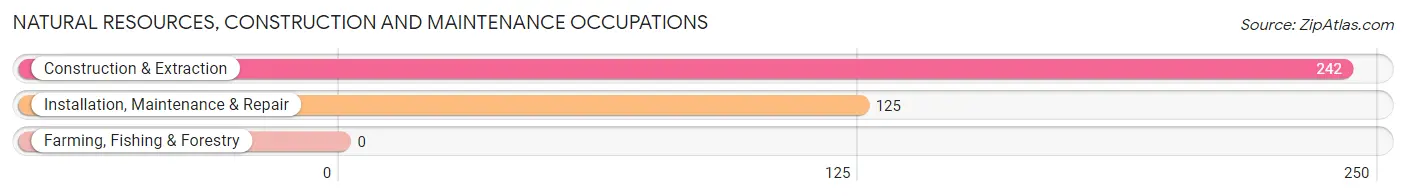
Natural Resources, Construction and Maintenance Occupations
The most common Natural Resources, Construction and Maintenance occupations in Goldenrod are Construction & Extraction (242 | 3.6%), and Installation, Maintenance & Repair (125 | 1.8%).
Natural Resources, Construction and Maintenance Occupations by Sex
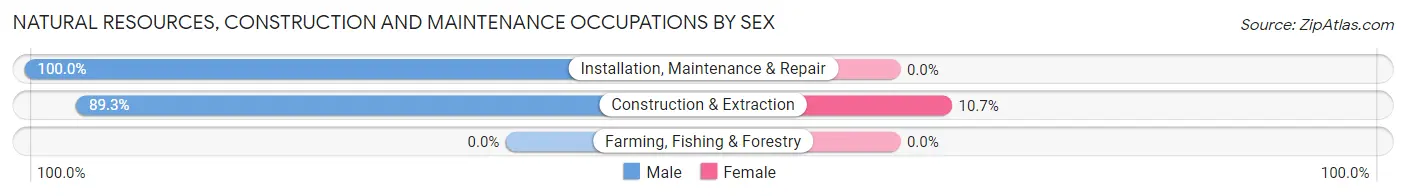
| Occupation | Male | Female |
| Farming, Fishing & Forestry | 0 (0.0%) | 0 (0.0%) |
| Construction & Extraction | 216 (89.3%) | 26 (10.7%) |
| Installation, Maintenance & Repair | 125 (100.0%) | 0 (0.0%) |
| Total (Category) | 341 (92.9%) | 26 (7.1%) |
| Total (Overall) | 3,277 (48.5%) | 3,473 (51.4%) |
Production, Transportation and Moving Occupations
The most common Production, Transportation and Moving occupations in Goldenrod are Transportation (222 | 3.3%), Material Moving (219 | 3.2%), and Production (198 | 2.9%).
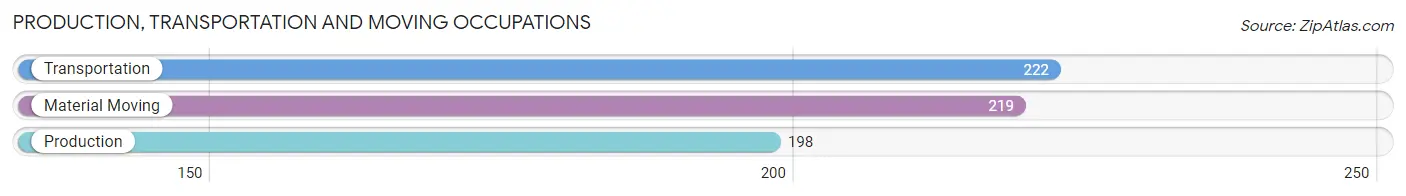
Production, Transportation and Moving Occupations by Sex
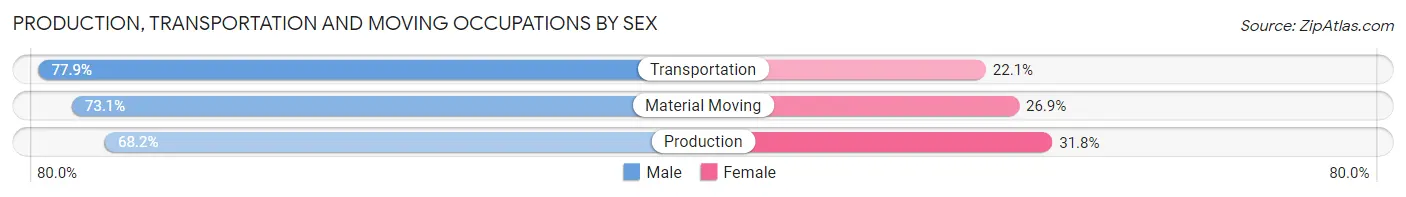
| Occupation | Male | Female |
| Production | 135 (68.2%) | 63 (31.8%) |
| Transportation | 173 (77.9%) | 49 (22.1%) |
| Material Moving | 160 (73.1%) | 59 (26.9%) |
| Total (Category) | 468 (73.2%) | 171 (26.8%) |
| Total (Overall) | 3,277 (48.5%) | 3,473 (51.4%) |
Employment Industries by Sex in Goldenrod
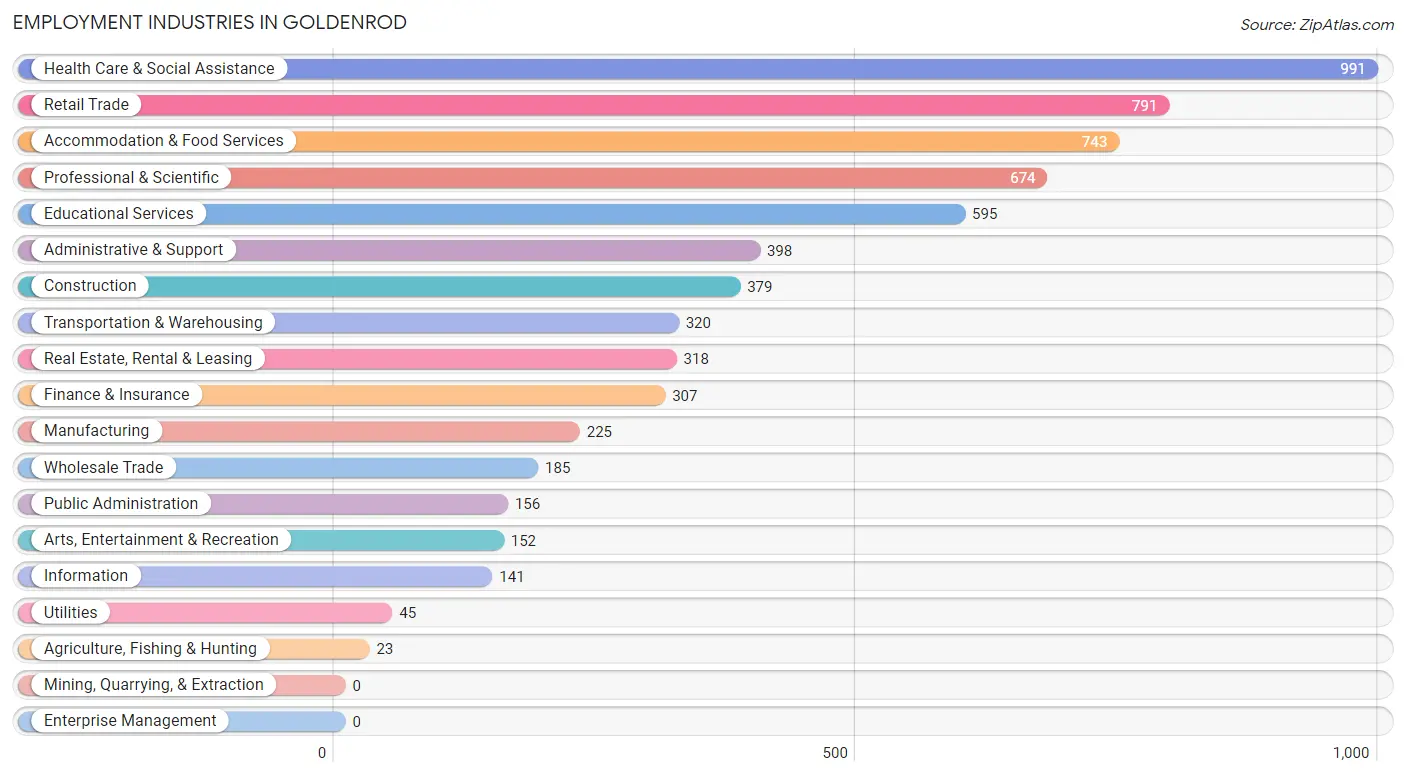
Employment Industries in Goldenrod
The major employment industries in Goldenrod include Health Care & Social Assistance (991 | 14.7%), Retail Trade (791 | 11.7%), Accommodation & Food Services (743 | 11.0%), Professional & Scientific (674 | 10.0%), and Educational Services (595 | 8.8%).
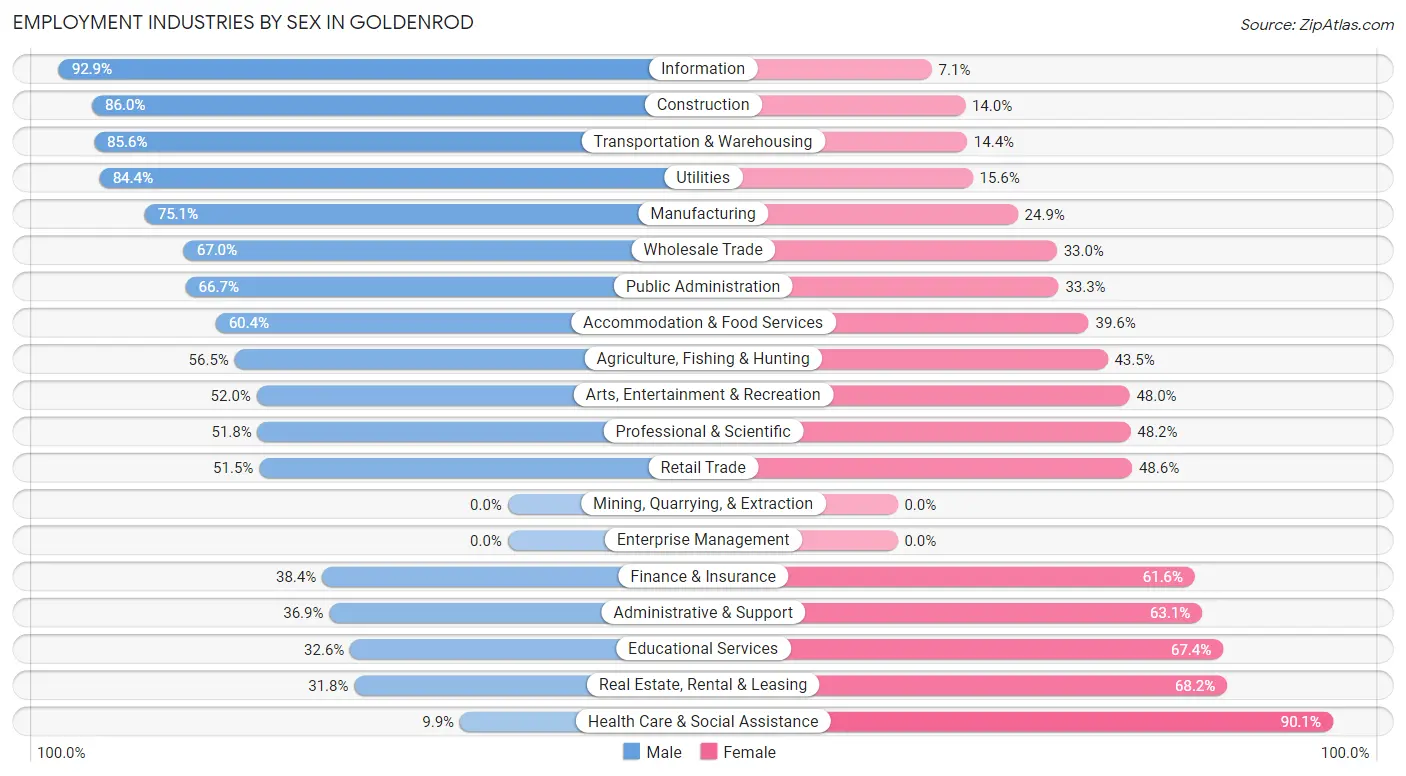
Employment Industries by Sex in Goldenrod
The Goldenrod industries that see more men than women are Information (92.9%), Construction (86.0%), and Transportation & Warehousing (85.6%), whereas the industries that tend to have a higher number of women are Health Care & Social Assistance (90.1%), Real Estate, Rental & Leasing (68.2%), and Educational Services (67.4%).
| Industry | Male | Female |
| Agriculture, Fishing & Hunting | 13 (56.5%) | 10 (43.5%) |
| Mining, Quarrying, & Extraction | 0 (0.0%) | 0 (0.0%) |
| Construction | 326 (86.0%) | 53 (14.0%) |
| Manufacturing | 169 (75.1%) | 56 (24.9%) |
| Wholesale Trade | 124 (67.0%) | 61 (33.0%) |
| Retail Trade | 407 (51.4%) | 384 (48.5%) |
| Transportation & Warehousing | 274 (85.6%) | 46 (14.4%) |
| Utilities | 38 (84.4%) | 7 (15.6%) |
| Information | 131 (92.9%) | 10 (7.1%) |
| Finance & Insurance | 118 (38.4%) | 189 (61.6%) |
| Real Estate, Rental & Leasing | 101 (31.8%) | 217 (68.2%) |
| Professional & Scientific | 349 (51.8%) | 325 (48.2%) |
| Enterprise Management | 0 (0.0%) | 0 (0.0%) |
| Administrative & Support | 147 (36.9%) | 251 (63.1%) |
| Educational Services | 194 (32.6%) | 401 (67.4%) |
| Health Care & Social Assistance | 98 (9.9%) | 893 (90.1%) |
| Arts, Entertainment & Recreation | 79 (52.0%) | 73 (48.0%) |
| Accommodation & Food Services | 449 (60.4%) | 294 (39.6%) |
| Public Administration | 104 (66.7%) | 52 (33.3%) |
| Total | 3,277 (48.5%) | 3,473 (51.4%) |
Education in Goldenrod
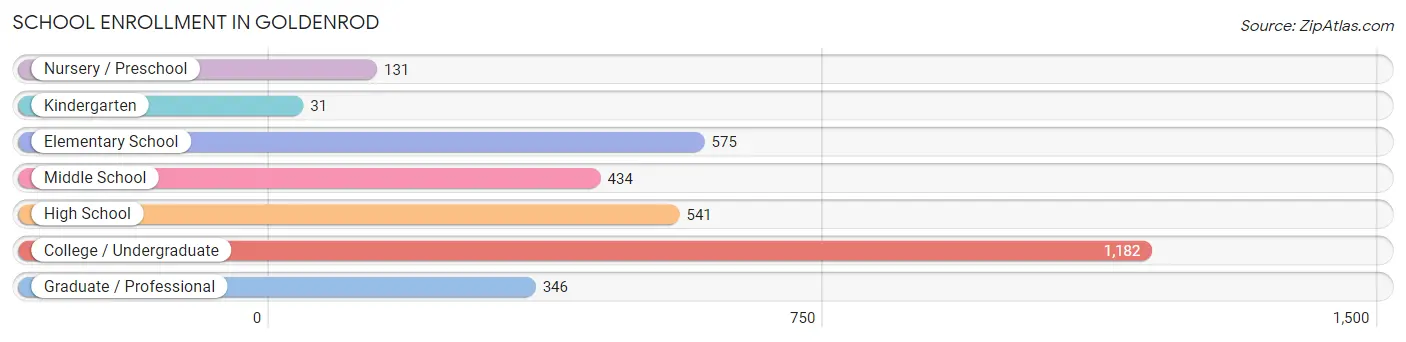
School Enrollment in Goldenrod
The most common levels of schooling among the 3,240 students in Goldenrod are college / undergraduate (1,182 | 36.5%), elementary school (575 | 17.7%), and high school (541 | 16.7%).
| School Level | # Students | % Students |
| Nursery / Preschool | 131 | 4.0% |
| Kindergarten | 31 | 1.0% |
| Elementary School | 575 | 17.7% |
| Middle School | 434 | 13.4% |
| High School | 541 | 16.7% |
| College / Undergraduate | 1,182 | 36.5% |
| Graduate / Professional | 346 | 10.7% |
| Total | 3,240 | 100.0% |
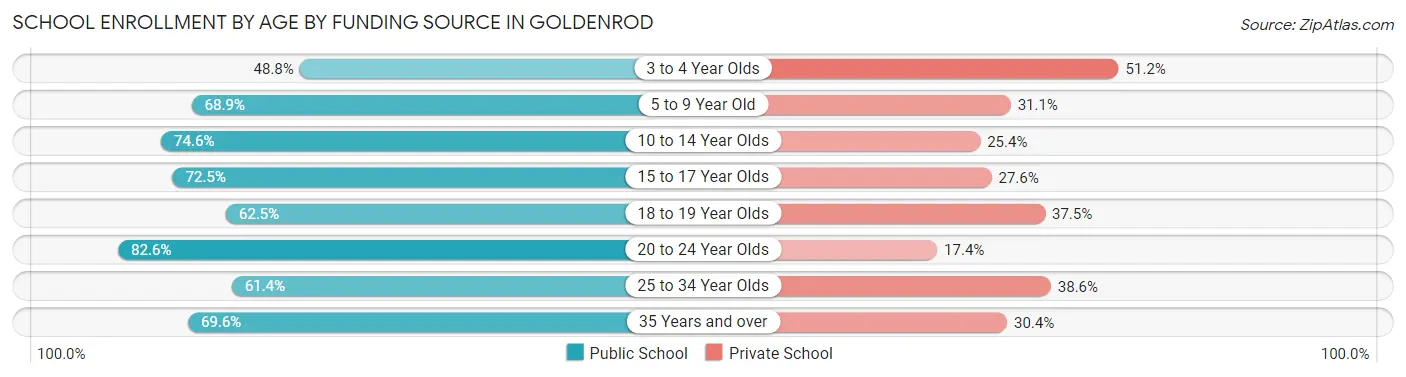
School Enrollment by Age by Funding Source in Goldenrod
Out of a total of 3,240 students who are enrolled in schools in Goldenrod, 936 (28.9%) attend a private institution, while the remaining 2,304 (71.1%) are enrolled in public schools. The age group of 3 to 4 year olds has the highest likelihood of being enrolled in private schools, with 42 (51.2% in the age bracket) enrolled. Conversely, the age group of 20 to 24 year olds has the lowest likelihood of being enrolled in a private school, with 631 (82.6% in the age bracket) attending a public institution.
| Age Bracket | Public School | Private School |
| 3 to 4 Year Olds | 40 (48.8%) | 42 (51.2%) |
| 5 to 9 Year Old | 403 (68.9%) | 182 (31.1%) |
| 10 to 14 Year Olds | 419 (74.6%) | 143 (25.4%) |
| 15 to 17 Year Olds | 234 (72.5%) | 89 (27.6%) |
| 18 to 19 Year Olds | 175 (62.5%) | 105 (37.5%) |
| 20 to 24 Year Olds | 631 (82.6%) | 133 (17.4%) |
| 25 to 34 Year Olds | 339 (61.4%) | 213 (38.6%) |
| 35 Years and over | 64 (69.6%) | 28 (30.4%) |
| Total | 2,304 (71.1%) | 936 (28.9%) |
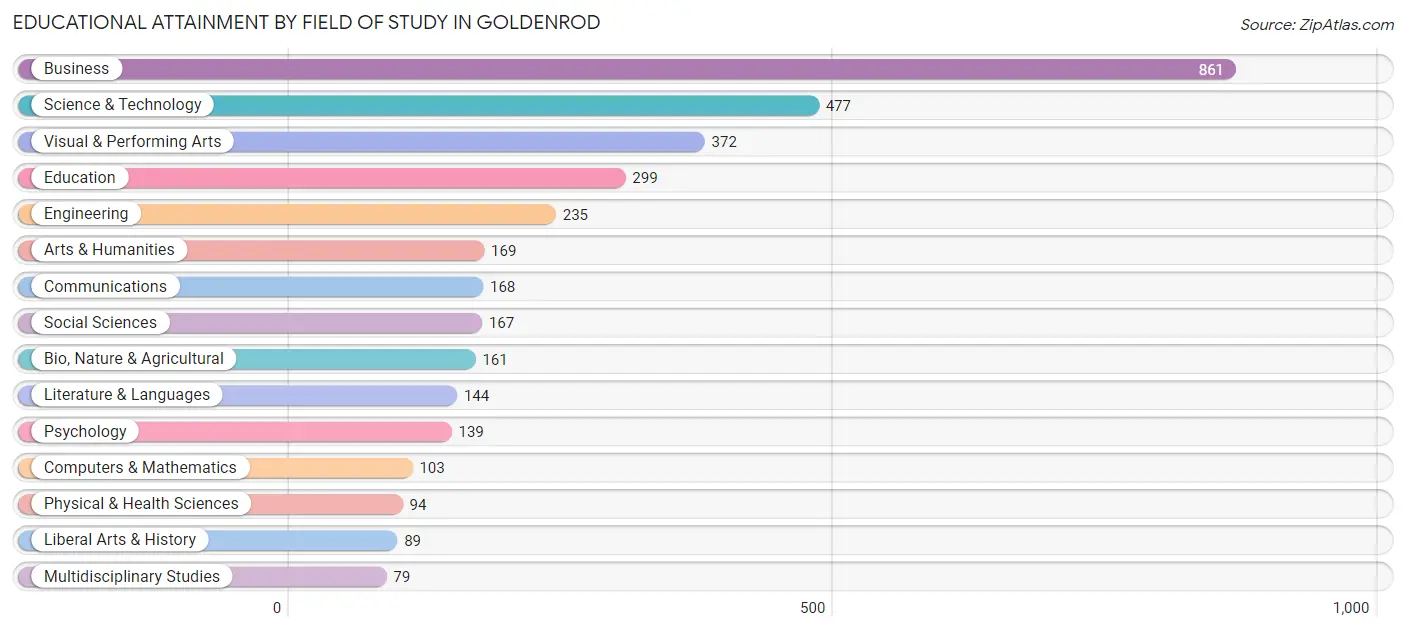
Educational Attainment by Field of Study in Goldenrod
Business (861 | 24.2%), science & technology (477 | 13.4%), visual & performing arts (372 | 10.5%), education (299 | 8.4%), and engineering (235 | 6.6%) are the most common fields of study among 3,557 individuals in Goldenrod who have obtained a bachelor's degree or higher.
| Field of Study | # Graduates | % Graduates |
| Computers & Mathematics | 103 | 2.9% |
| Bio, Nature & Agricultural | 161 | 4.5% |
| Physical & Health Sciences | 94 | 2.6% |
| Psychology | 139 | 3.9% |
| Social Sciences | 167 | 4.7% |
| Engineering | 235 | 6.6% |
| Multidisciplinary Studies | 79 | 2.2% |
| Science & Technology | 477 | 13.4% |
| Business | 861 | 24.2% |
| Education | 299 | 8.4% |
| Literature & Languages | 144 | 4.1% |
| Liberal Arts & History | 89 | 2.5% |
| Visual & Performing Arts | 372 | 10.5% |
| Communications | 168 | 4.7% |
| Arts & Humanities | 169 | 4.8% |
| Total | 3,557 | 100.0% |
Transportation & Commute in Goldenrod
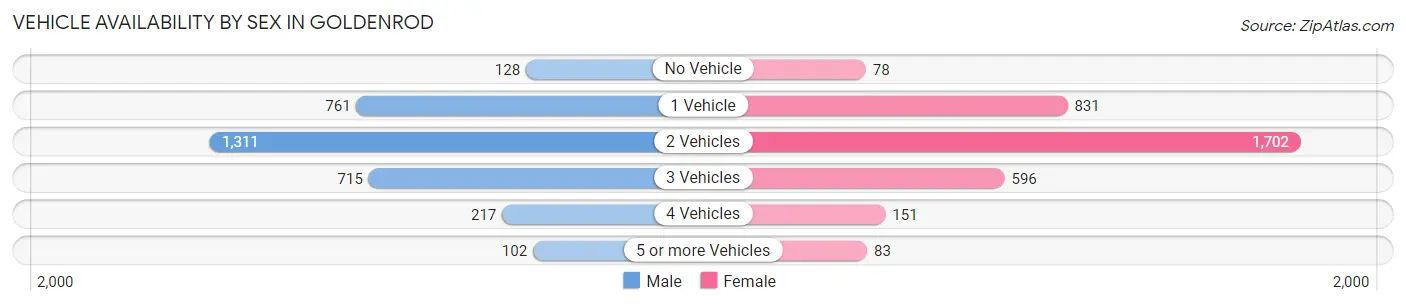
Vehicle Availability by Sex in Goldenrod
The most prevalent vehicle ownership categories in Goldenrod are males with 2 vehicles (1,311, accounting for 40.5%) and females with 2 vehicles (1,702, making up 38.1%).
| Vehicles Available | Male | Female |
| No Vehicle | 128 (4.0%) | 78 (2.3%) |
| 1 Vehicle | 761 (23.5%) | 831 (24.1%) |
| 2 Vehicles | 1,311 (40.5%) | 1,702 (49.5%) |
| 3 Vehicles | 715 (22.1%) | 596 (17.3%) |
| 4 Vehicles | 217 (6.7%) | 151 (4.4%) |
| 5 or more Vehicles | 102 (3.2%) | 83 (2.4%) |
| Total | 3,234 (100.0%) | 3,441 (100.0%) |
Commute Time in Goldenrod
The most frequently occuring commute durations in Goldenrod are 30 to 34 minutes (1,301 commuters, 22.1%), 20 to 24 minutes (1,159 commuters, 19.7%), and 15 to 19 minutes (797 commuters, 13.5%).
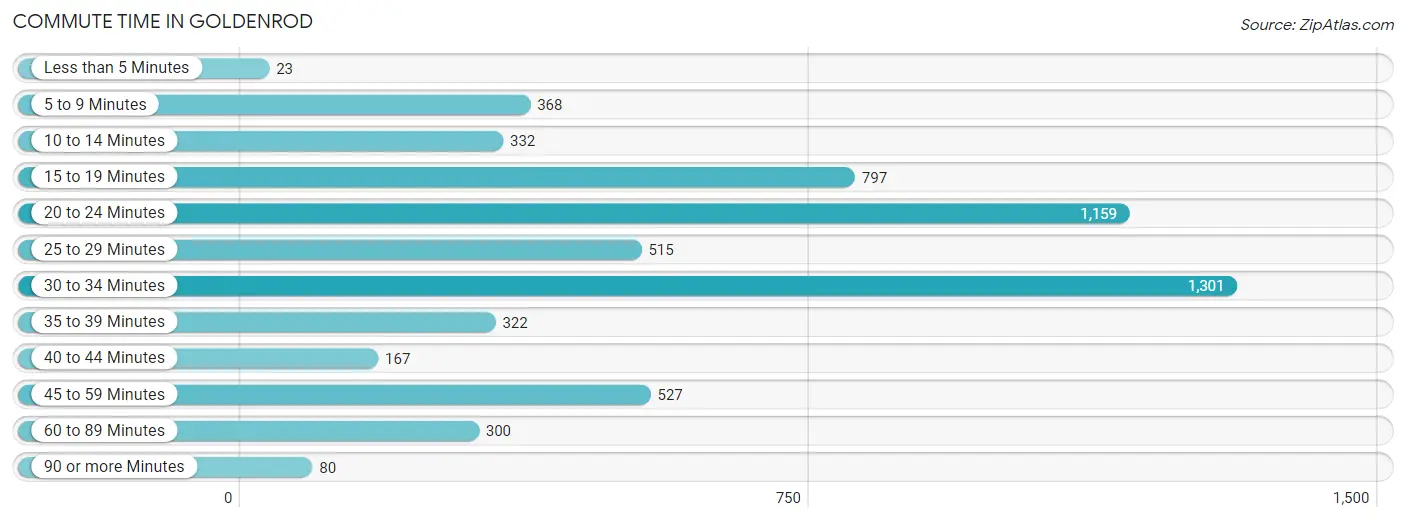
| Commute Time | # Commuters | % Commuters |
| Less than 5 Minutes | 23 | 0.4% |
| 5 to 9 Minutes | 368 | 6.2% |
| 10 to 14 Minutes | 332 | 5.6% |
| 15 to 19 Minutes | 797 | 13.5% |
| 20 to 24 Minutes | 1,159 | 19.7% |
| 25 to 29 Minutes | 515 | 8.7% |
| 30 to 34 Minutes | 1,301 | 22.1% |
| 35 to 39 Minutes | 322 | 5.5% |
| 40 to 44 Minutes | 167 | 2.8% |
| 45 to 59 Minutes | 527 | 8.9% |
| 60 to 89 Minutes | 300 | 5.1% |
| 90 or more Minutes | 80 | 1.4% |
Commute Time by Sex in Goldenrod
The most common commute times in Goldenrod are 20 to 24 minutes (564 commuters, 20.1%) for males and 30 to 34 minutes (860 commuters, 27.9%) for females.
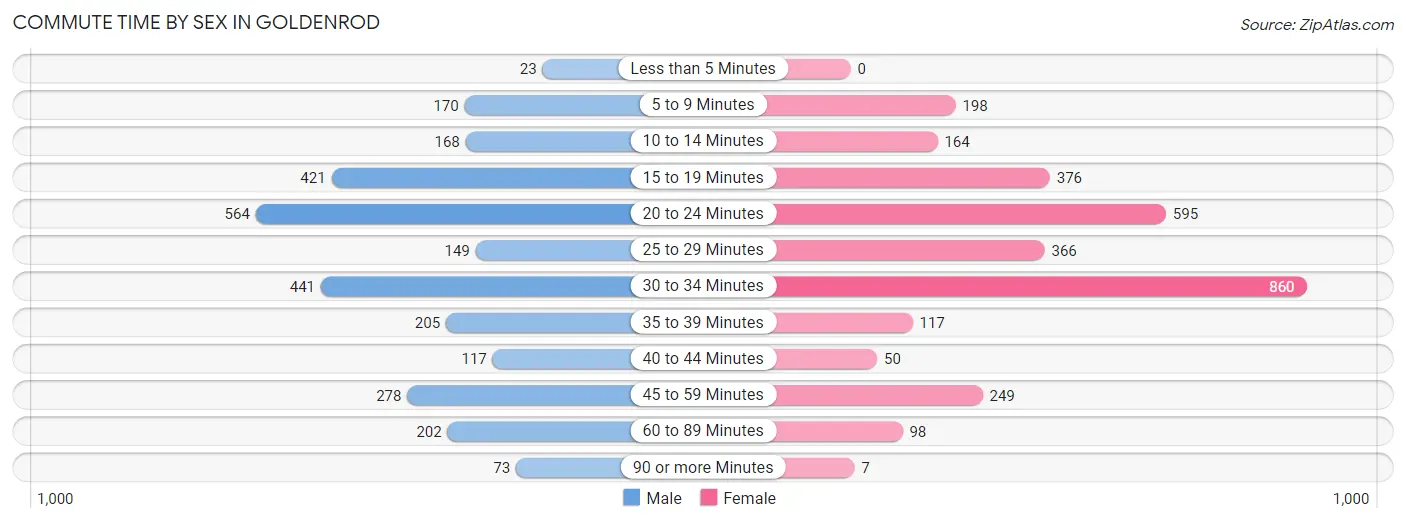
| Commute Time | Male | Female |
| Less than 5 Minutes | 23 (0.8%) | 0 (0.0%) |
| 5 to 9 Minutes | 170 (6.0%) | 198 (6.4%) |
| 10 to 14 Minutes | 168 (6.0%) | 164 (5.3%) |
| 15 to 19 Minutes | 421 (15.0%) | 376 (12.2%) |
| 20 to 24 Minutes | 564 (20.1%) | 595 (19.3%) |
| 25 to 29 Minutes | 149 (5.3%) | 366 (11.9%) |
| 30 to 34 Minutes | 441 (15.7%) | 860 (27.9%) |
| 35 to 39 Minutes | 205 (7.3%) | 117 (3.8%) |
| 40 to 44 Minutes | 117 (4.2%) | 50 (1.6%) |
| 45 to 59 Minutes | 278 (9.9%) | 249 (8.1%) |
| 60 to 89 Minutes | 202 (7.2%) | 98 (3.2%) |
| 90 or more Minutes | 73 (2.6%) | 7 (0.2%) |
Time of Departure to Work by Sex in Goldenrod
The most frequent times of departure to work in Goldenrod are 7:00 AM to 7:29 AM (404, 14.4%) for males and 8:00 AM to 8:29 AM (704, 22.9%) for females.
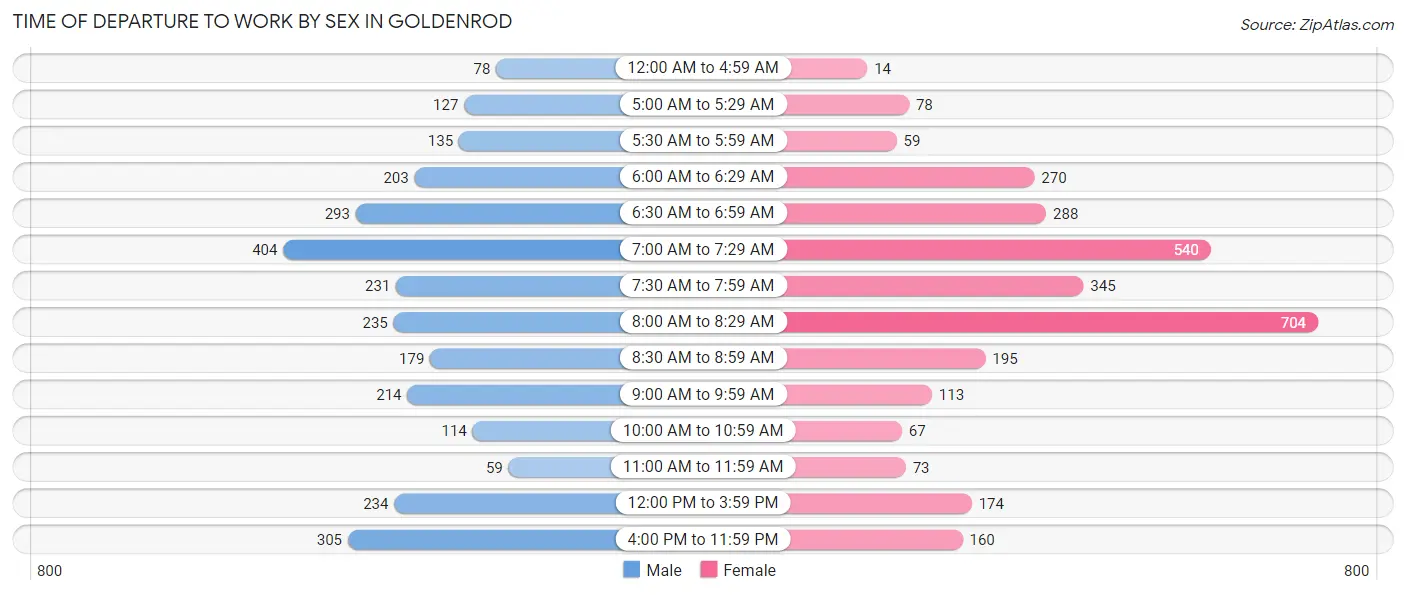
| Time of Departure | Male | Female |
| 12:00 AM to 4:59 AM | 78 (2.8%) | 14 (0.4%) |
| 5:00 AM to 5:29 AM | 127 (4.5%) | 78 (2.5%) |
| 5:30 AM to 5:59 AM | 135 (4.8%) | 59 (1.9%) |
| 6:00 AM to 6:29 AM | 203 (7.2%) | 270 (8.8%) |
| 6:30 AM to 6:59 AM | 293 (10.4%) | 288 (9.3%) |
| 7:00 AM to 7:29 AM | 404 (14.4%) | 540 (17.5%) |
| 7:30 AM to 7:59 AM | 231 (8.2%) | 345 (11.2%) |
| 8:00 AM to 8:29 AM | 235 (8.4%) | 704 (22.9%) |
| 8:30 AM to 8:59 AM | 179 (6.4%) | 195 (6.3%) |
| 9:00 AM to 9:59 AM | 214 (7.6%) | 113 (3.7%) |
| 10:00 AM to 10:59 AM | 114 (4.1%) | 67 (2.2%) |
| 11:00 AM to 11:59 AM | 59 (2.1%) | 73 (2.4%) |
| 12:00 PM to 3:59 PM | 234 (8.3%) | 174 (5.7%) |
| 4:00 PM to 11:59 PM | 305 (10.8%) | 160 (5.2%) |
| Total | 2,811 (100.0%) | 3,080 (100.0%) |
Housing Occupancy in Goldenrod
Occupancy by Ownership in Goldenrod
Of the total 5,247 dwellings in Goldenrod, owner-occupied units account for 2,571 (49.0%), while renter-occupied units make up 2,676 (51.0%).
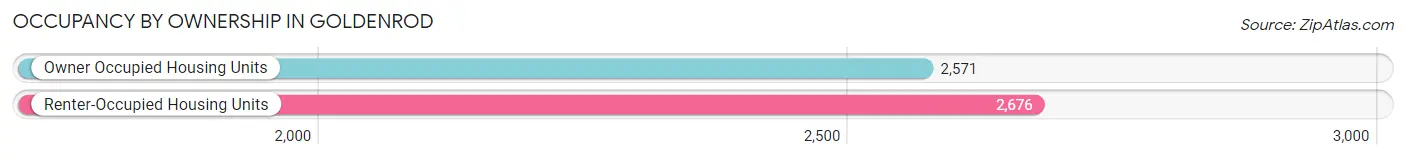
| Occupancy | # Housing Units | % Housing Units |
| Owner Occupied Housing Units | 2,571 | 49.0% |
| Renter-Occupied Housing Units | 2,676 | 51.0% |
| Total Occupied Housing Units | 5,247 | 100.0% |
Occupancy by Household Size in Goldenrod
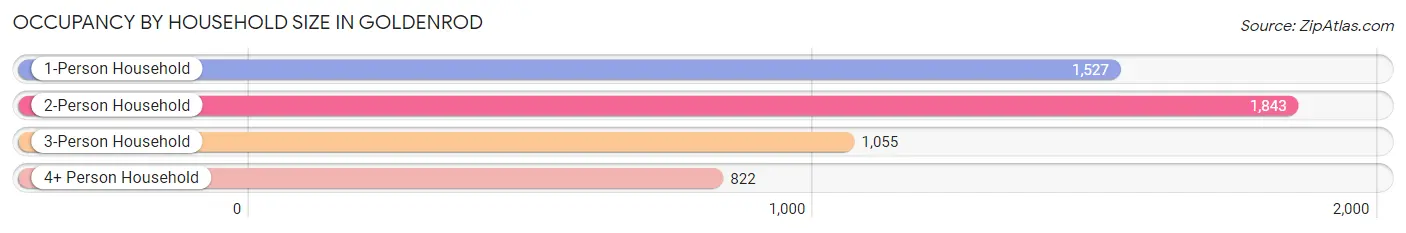
| Household Size | # Housing Units | % Housing Units |
| 1-Person Household | 1,527 | 29.1% |
| 2-Person Household | 1,843 | 35.1% |
| 3-Person Household | 1,055 | 20.1% |
| 4+ Person Household | 822 | 15.7% |
| Total Housing Units | 5,247 | 100.0% |
Occupancy by Ownership by Household Size in Goldenrod
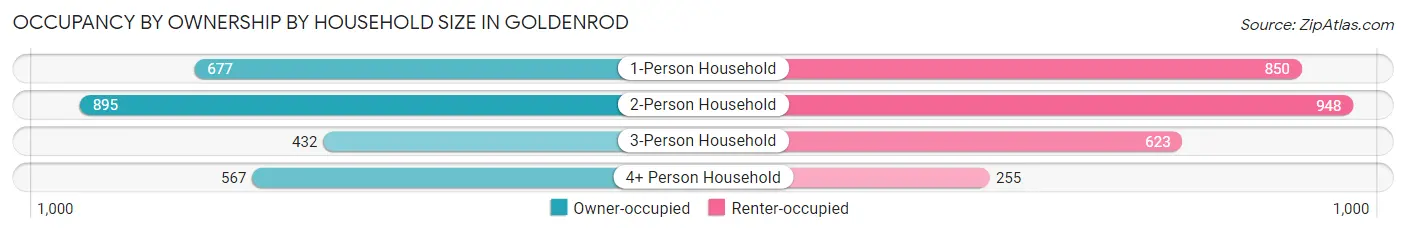
| Household Size | Owner-occupied | Renter-occupied |
| 1-Person Household | 677 (44.3%) | 850 (55.7%) |
| 2-Person Household | 895 (48.6%) | 948 (51.4%) |
| 3-Person Household | 432 (40.9%) | 623 (59.1%) |
| 4+ Person Household | 567 (69.0%) | 255 (31.0%) |
| Total Housing Units | 2,571 (49.0%) | 2,676 (51.0%) |
Occupancy by Educational Attainment in Goldenrod
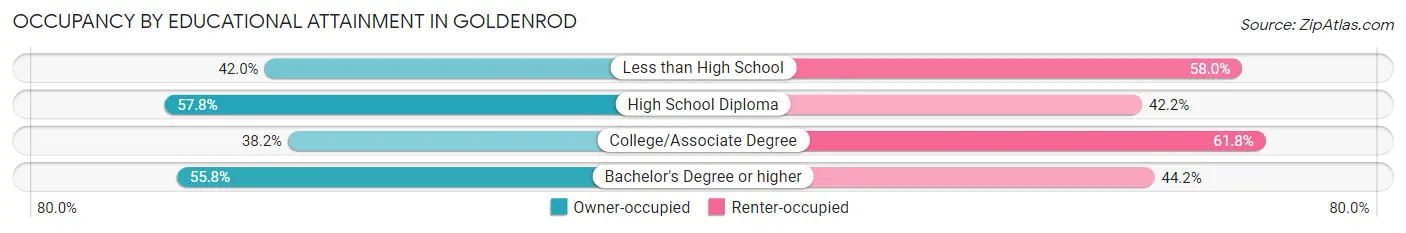
| Household Size | Owner-occupied | Renter-occupied |
| Less than High School | 133 (42.0%) | 184 (58.0%) |
| High School Diploma | 543 (57.8%) | 396 (42.2%) |
| College/Associate Degree | 724 (38.2%) | 1,170 (61.8%) |
| Bachelor's Degree or higher | 1,171 (55.8%) | 926 (44.2%) |
Occupancy by Age of Householder in Goldenrod
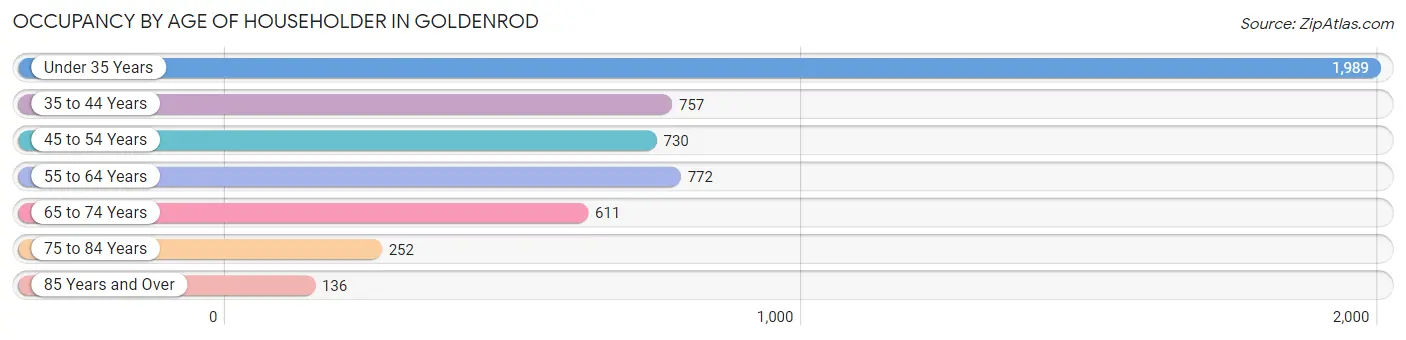
| Age Bracket | # Households | % Households |
| Under 35 Years | 1,989 | 37.9% |
| 35 to 44 Years | 757 | 14.4% |
| 45 to 54 Years | 730 | 13.9% |
| 55 to 64 Years | 772 | 14.7% |
| 65 to 74 Years | 611 | 11.6% |
| 75 to 84 Years | 252 | 4.8% |
| 85 Years and Over | 136 | 2.6% |
| Total | 5,247 | 100.0% |
Housing Finances in Goldenrod
Median Income by Occupancy in Goldenrod
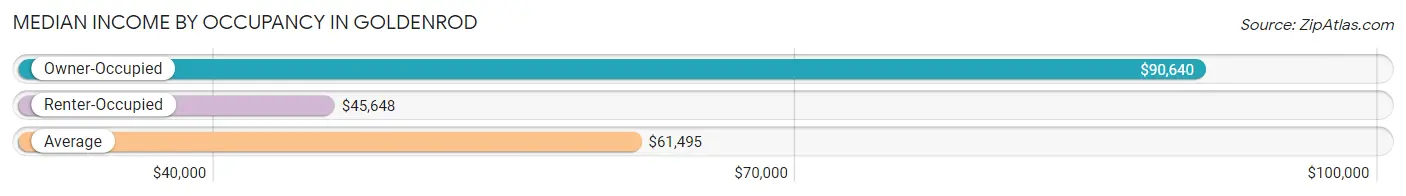
| Occupancy Type | # Households | Median Income |
| Owner-Occupied | 2,571 (49.0%) | $90,640 |
| Renter-Occupied | 2,676 (51.0%) | $45,648 |
| Average | 5,247 (100.0%) | $61,495 |
Occupancy by Householder Income Bracket in Goldenrod
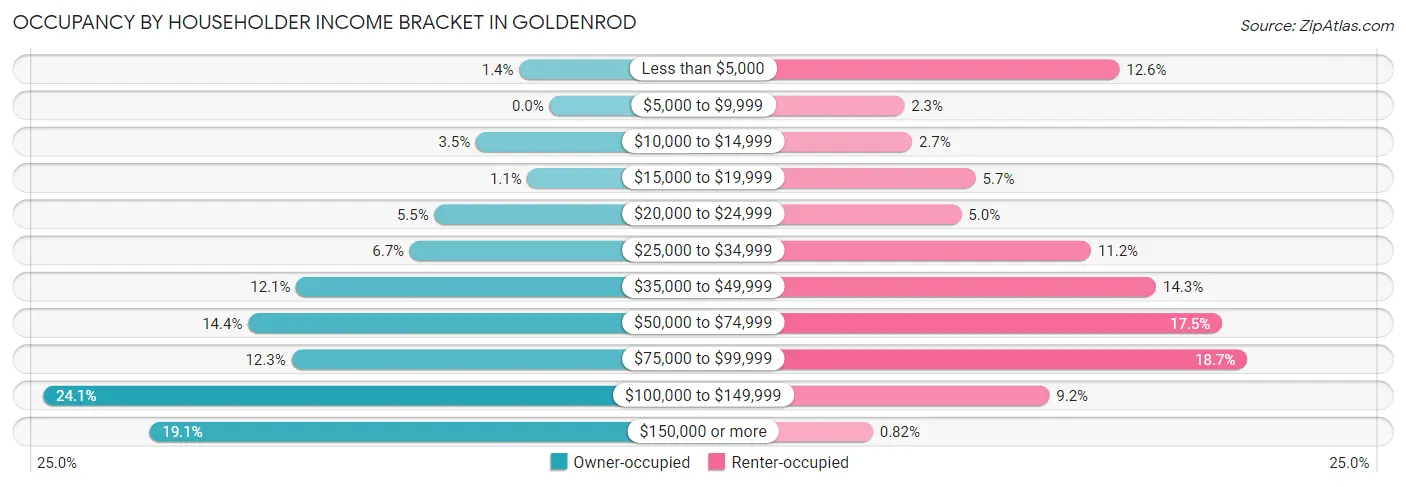
| Income Bracket | Owner-occupied | Renter-occupied |
| Less than $5,000 | 37 (1.4%) | 336 (12.6%) |
| $5,000 to $9,999 | 0 (0.0%) | 62 (2.3%) |
| $10,000 to $14,999 | 90 (3.5%) | 72 (2.7%) |
| $15,000 to $19,999 | 27 (1.1%) | 153 (5.7%) |
| $20,000 to $24,999 | 141 (5.5%) | 135 (5.0%) |
| $25,000 to $34,999 | 171 (6.7%) | 300 (11.2%) |
| $35,000 to $49,999 | 310 (12.1%) | 383 (14.3%) |
| $50,000 to $74,999 | 369 (14.3%) | 467 (17.4%) |
| $75,000 to $99,999 | 316 (12.3%) | 499 (18.6%) |
| $100,000 to $149,999 | 620 (24.1%) | 247 (9.2%) |
| $150,000 or more | 490 (19.1%) | 22 (0.8%) |
| Total | 2,571 (100.0%) | 2,676 (100.0%) |
Monthly Housing Cost Tiers in Goldenrod
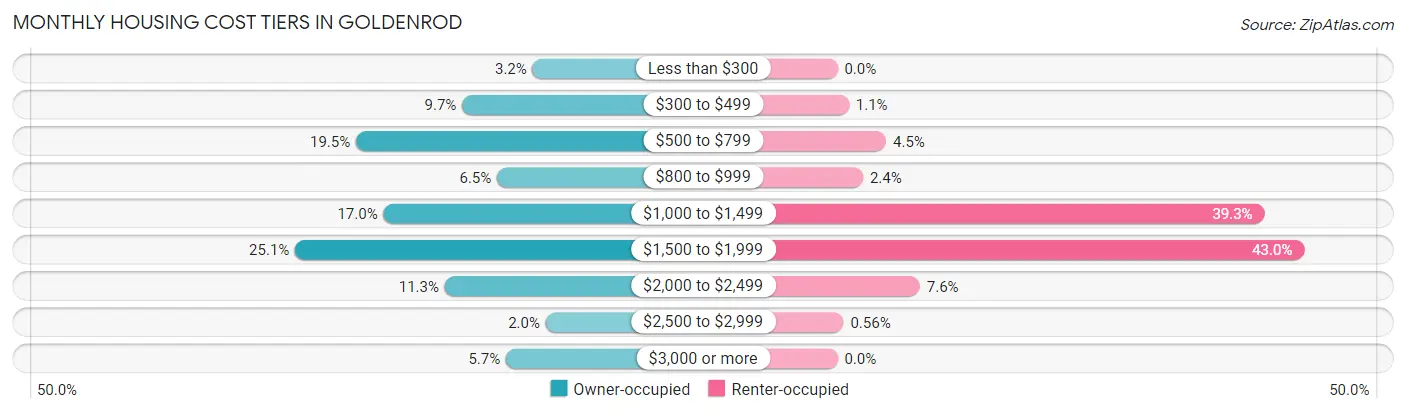
| Monthly Cost | Owner-occupied | Renter-occupied |
| Less than $300 | 83 (3.2%) | 0 (0.0%) |
| $300 to $499 | 250 (9.7%) | 28 (1.1%) |
| $500 to $799 | 501 (19.5%) | 120 (4.5%) |
| $800 to $999 | 167 (6.5%) | 63 (2.4%) |
| $1,000 to $1,499 | 436 (17.0%) | 1,052 (39.3%) |
| $1,500 to $1,999 | 645 (25.1%) | 1,150 (43.0%) |
| $2,000 to $2,499 | 291 (11.3%) | 203 (7.6%) |
| $2,500 to $2,999 | 52 (2.0%) | 15 (0.6%) |
| $3,000 or more | 146 (5.7%) | 0 (0.0%) |
| Total | 2,571 (100.0%) | 2,676 (100.0%) |
Physical Housing Characteristics in Goldenrod
Housing Structures in Goldenrod
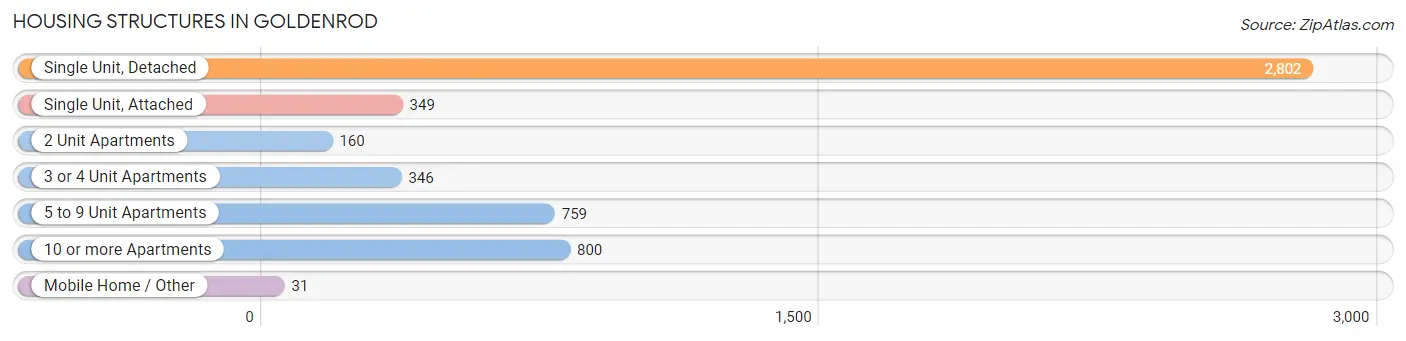
| Structure Type | # Housing Units | % Housing Units |
| Single Unit, Detached | 2,802 | 53.4% |
| Single Unit, Attached | 349 | 6.7% |
| 2 Unit Apartments | 160 | 3.0% |
| 3 or 4 Unit Apartments | 346 | 6.6% |
| 5 to 9 Unit Apartments | 759 | 14.5% |
| 10 or more Apartments | 800 | 15.2% |
| Mobile Home / Other | 31 | 0.6% |
| Total | 5,247 | 100.0% |
Housing Structures by Occupancy in Goldenrod
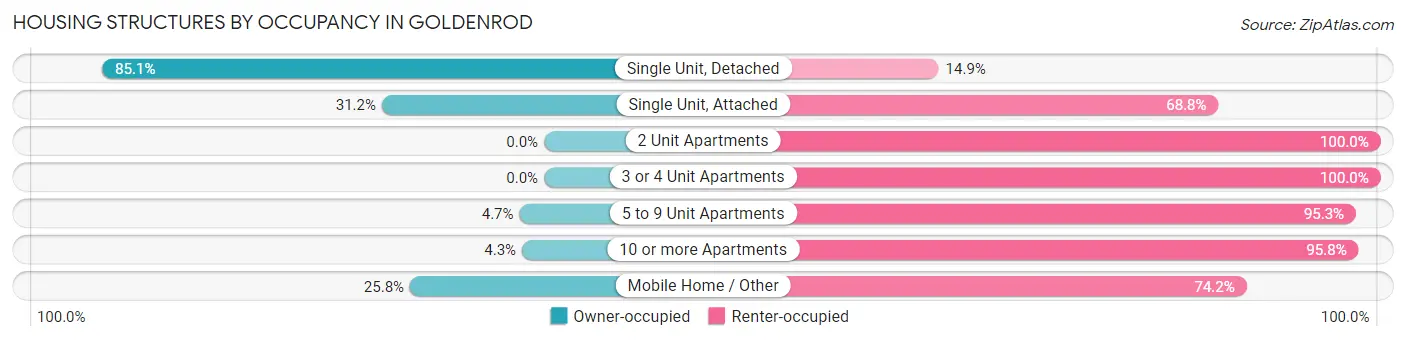
| Structure Type | Owner-occupied | Renter-occupied |
| Single Unit, Detached | 2,384 (85.1%) | 418 (14.9%) |
| Single Unit, Attached | 109 (31.2%) | 240 (68.8%) |
| 2 Unit Apartments | 0 (0.0%) | 160 (100.0%) |
| 3 or 4 Unit Apartments | 0 (0.0%) | 346 (100.0%) |
| 5 to 9 Unit Apartments | 36 (4.7%) | 723 (95.3%) |
| 10 or more Apartments | 34 (4.3%) | 766 (95.8%) |
| Mobile Home / Other | 8 (25.8%) | 23 (74.2%) |
| Total | 2,571 (49.0%) | 2,676 (51.0%) |
Housing Structures by Number of Rooms in Goldenrod
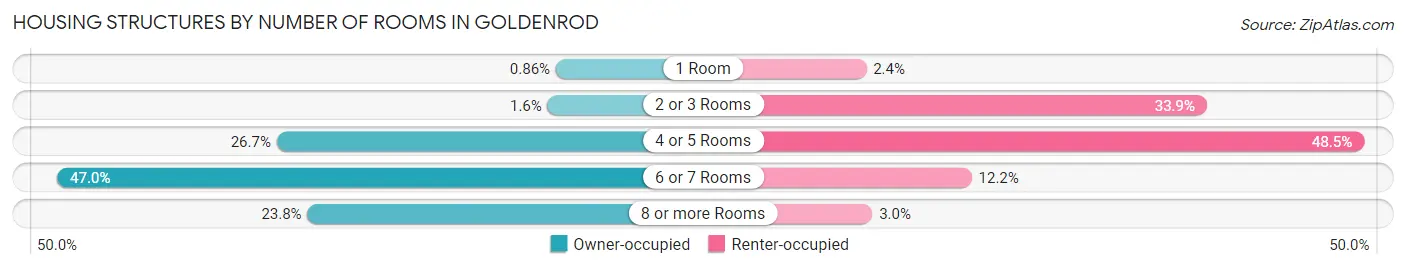
| Number of Rooms | Owner-occupied | Renter-occupied |
| 1 Room | 22 (0.9%) | 65 (2.4%) |
| 2 or 3 Rooms | 42 (1.6%) | 908 (33.9%) |
| 4 or 5 Rooms | 686 (26.7%) | 1,297 (48.5%) |
| 6 or 7 Rooms | 1,208 (47.0%) | 326 (12.2%) |
| 8 or more Rooms | 613 (23.8%) | 80 (3.0%) |
| Total | 2,571 (100.0%) | 2,676 (100.0%) |
Housing Structure by Heating Type in Goldenrod
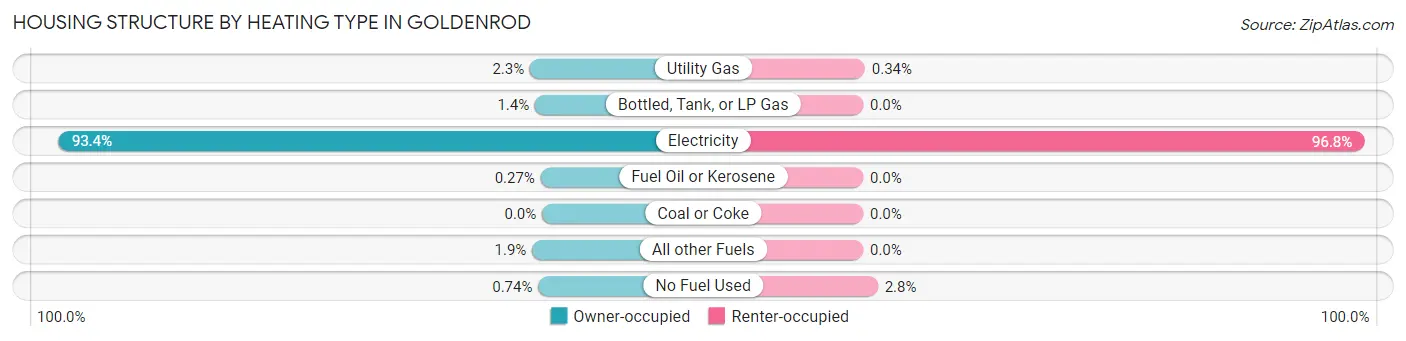
| Heating Type | Owner-occupied | Renter-occupied |
| Utility Gas | 60 (2.3%) | 9 (0.3%) |
| Bottled, Tank, or LP Gas | 35 (1.4%) | 0 (0.0%) |
| Electricity | 2,401 (93.4%) | 2,591 (96.8%) |
| Fuel Oil or Kerosene | 7 (0.3%) | 0 (0.0%) |
| Coal or Coke | 0 (0.0%) | 0 (0.0%) |
| All other Fuels | 49 (1.9%) | 0 (0.0%) |
| No Fuel Used | 19 (0.7%) | 76 (2.8%) |
| Total | 2,571 (100.0%) | 2,676 (100.0%) |
Household Vehicle Usage in Goldenrod
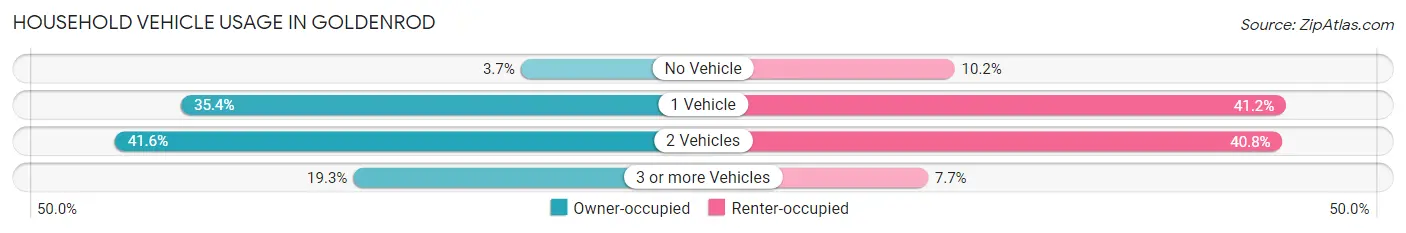
| Vehicles per Household | Owner-occupied | Renter-occupied |
| No Vehicle | 95 (3.7%) | 274 (10.2%) |
| 1 Vehicle | 910 (35.4%) | 1,102 (41.2%) |
| 2 Vehicles | 1,069 (41.6%) | 1,093 (40.8%) |
| 3 or more Vehicles | 497 (19.3%) | 207 (7.7%) |
| Total | 2,571 (100.0%) | 2,676 (100.0%) |
Real Estate & Mortgages in Goldenrod
Real Estate and Mortgage Overview in Goldenrod
| Characteristic | Without Mortgage | With Mortgage |
| Housing Units | 902 | 1,669 |
| Median Property Value | $308,500 | $311,600 |
| Median Household Income | $57,321 | $363 |
| Monthly Housing Costs | $555 | $146 |
| Real Estate Taxes | $1,547 | $65 |
Property Value by Mortgage Status in Goldenrod
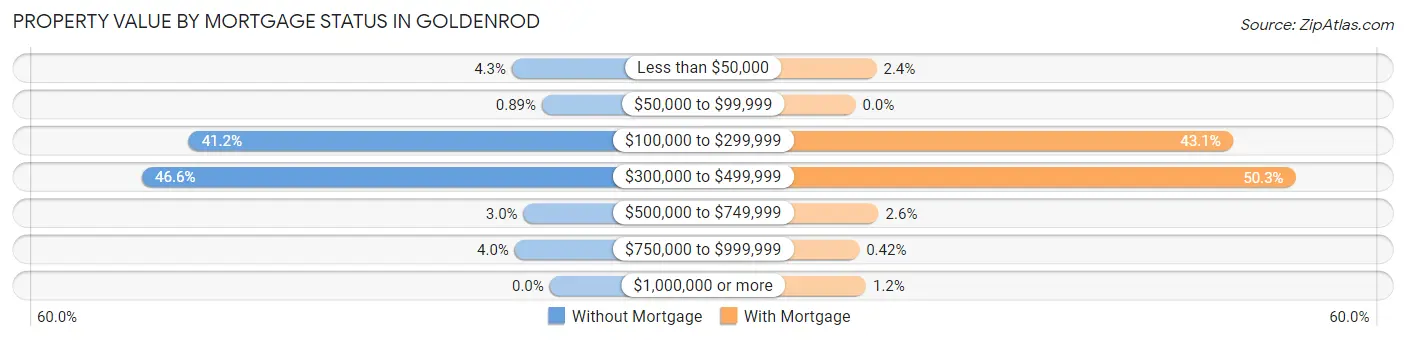
| Property Value | Without Mortgage | With Mortgage |
| Less than $50,000 | 39 (4.3%) | 40 (2.4%) |
| $50,000 to $99,999 | 8 (0.9%) | 0 (0.0%) |
| $100,000 to $299,999 | 372 (41.2%) | 719 (43.1%) |
| $300,000 to $499,999 | 420 (46.6%) | 839 (50.3%) |
| $500,000 to $749,999 | 27 (3.0%) | 44 (2.6%) |
| $750,000 to $999,999 | 36 (4.0%) | 7 (0.4%) |
| $1,000,000 or more | 0 (0.0%) | 20 (1.2%) |
| Total | 902 (100.0%) | 1,669 (100.0%) |
Household Income by Mortgage Status in Goldenrod
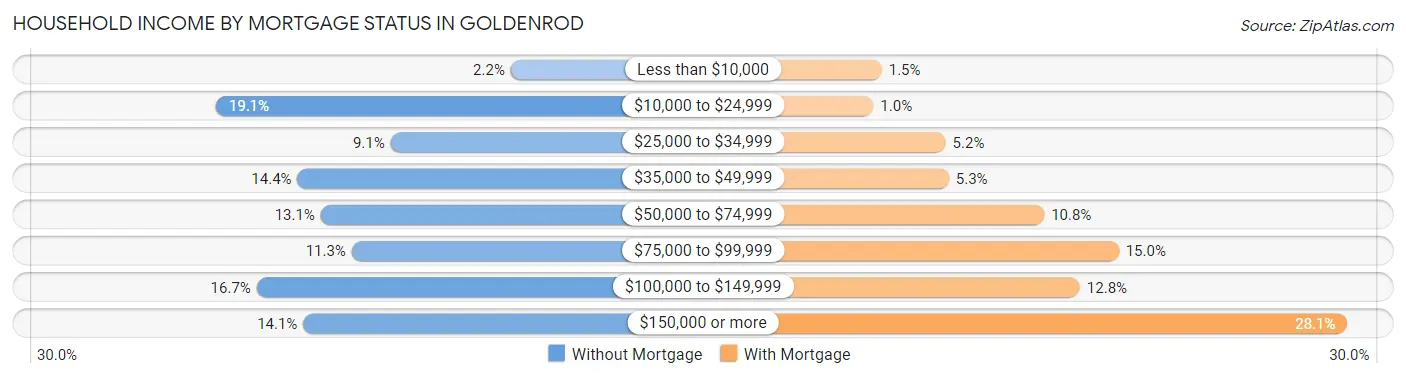
| Household Income | Without Mortgage | With Mortgage |
| Less than $10,000 | 20 (2.2%) | 25 (1.5%) |
| $10,000 to $24,999 | 172 (19.1%) | 17 (1.0%) |
| $25,000 to $34,999 | 82 (9.1%) | 86 (5.1%) |
| $35,000 to $49,999 | 130 (14.4%) | 89 (5.3%) |
| $50,000 to $74,999 | 118 (13.1%) | 180 (10.8%) |
| $75,000 to $99,999 | 102 (11.3%) | 251 (15.0%) |
| $100,000 to $149,999 | 151 (16.7%) | 214 (12.8%) |
| $150,000 or more | 127 (14.1%) | 469 (28.1%) |
| Total | 902 (100.0%) | 1,669 (100.0%) |
Property Value to Household Income Ratio in Goldenrod
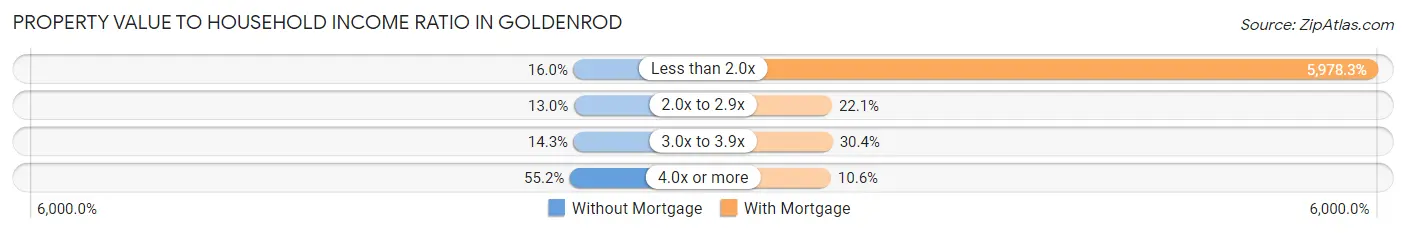
| Value-to-Income Ratio | Without Mortgage | With Mortgage |
| Less than 2.0x | 144 (16.0%) | 99,777 (5,978.2%) |
| 2.0x to 2.9x | 117 (13.0%) | 369 (22.1%) |
| 3.0x to 3.9x | 129 (14.3%) | 507 (30.4%) |
| 4.0x or more | 498 (55.2%) | 177 (10.6%) |
| Total | 902 (100.0%) | 1,669 (100.0%) |
Real Estate Taxes by Mortgage Status in Goldenrod
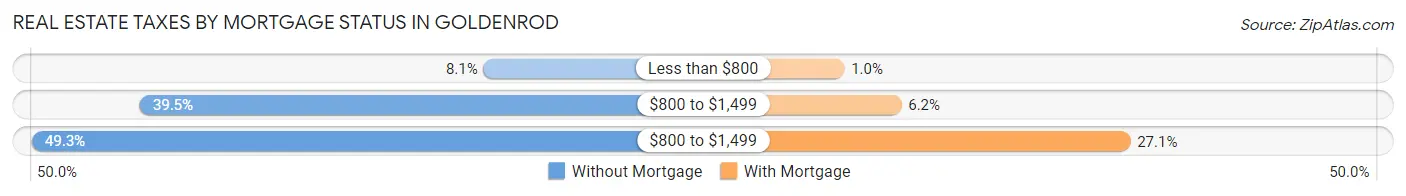
| Property Taxes | Without Mortgage | With Mortgage |
| Less than $800 | 73 (8.1%) | 17 (1.0%) |
| $800 to $1,499 | 356 (39.5%) | 104 (6.2%) |
| $800 to $1,499 | 445 (49.3%) | 453 (27.1%) |
| Total | 902 (100.0%) | 1,669 (100.0%) |
Health & Disability in Goldenrod
Health Insurance Coverage by Age in Goldenrod
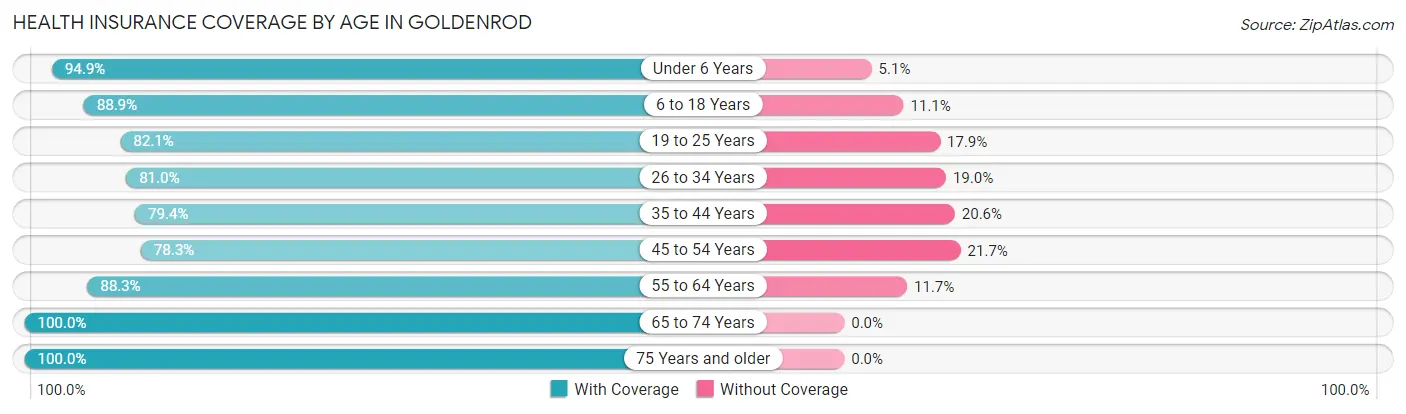
| Age Bracket | With Coverage | Without Coverage |
| Under 6 Years | 577 (94.9%) | 31 (5.1%) |
| 6 to 18 Years | 1,536 (88.9%) | 191 (11.1%) |
| 19 to 25 Years | 1,701 (82.1%) | 370 (17.9%) |
| 26 to 34 Years | 1,894 (81.0%) | 443 (19.0%) |
| 35 to 44 Years | 1,224 (79.4%) | 318 (20.6%) |
| 45 to 54 Years | 992 (78.3%) | 275 (21.7%) |
| 55 to 64 Years | 1,206 (88.3%) | 160 (11.7%) |
| 65 to 74 Years | 944 (100.0%) | 0 (0.0%) |
| 75 Years and older | 614 (100.0%) | 0 (0.0%) |
| Total | 10,688 (85.7%) | 1,788 (14.3%) |
Health Insurance Coverage by Citizenship Status in Goldenrod
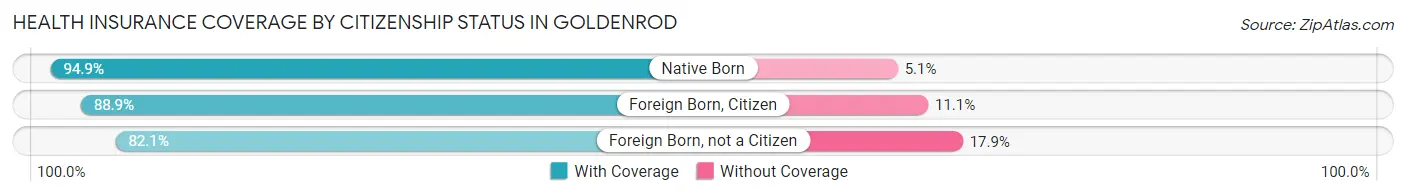
| Citizenship Status | With Coverage | Without Coverage |
| Native Born | 577 (94.9%) | 31 (5.1%) |
| Foreign Born, Citizen | 1,536 (88.9%) | 191 (11.1%) |
| Foreign Born, not a Citizen | 1,701 (82.1%) | 370 (17.9%) |
Health Insurance Coverage by Household Income in Goldenrod
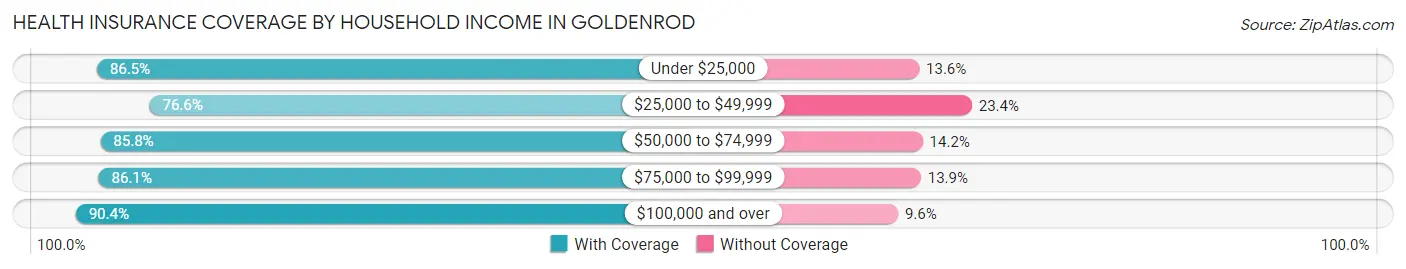
| Household Income | With Coverage | Without Coverage |
| Under $25,000 | 1,397 (86.5%) | 219 (13.6%) |
| $25,000 to $49,999 | 1,910 (76.6%) | 584 (23.4%) |
| $50,000 to $74,999 | 1,715 (85.8%) | 284 (14.2%) |
| $75,000 to $99,999 | 1,850 (86.1%) | 298 (13.9%) |
| $100,000 and over | 3,800 (90.4%) | 403 (9.6%) |
Public vs Private Health Insurance Coverage by Age in Goldenrod
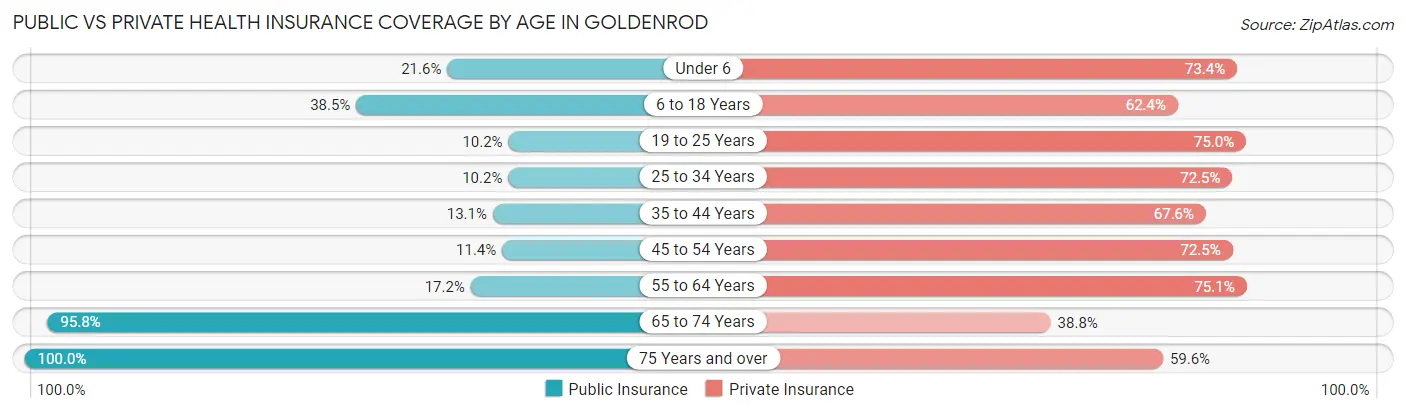
| Age Bracket | Public Insurance | Private Insurance |
| Under 6 | 131 (21.5%) | 446 (73.4%) |
| 6 to 18 Years | 664 (38.5%) | 1,077 (62.4%) |
| 19 to 25 Years | 211 (10.2%) | 1,554 (75.0%) |
| 25 to 34 Years | 239 (10.2%) | 1,694 (72.5%) |
| 35 to 44 Years | 202 (13.1%) | 1,042 (67.6%) |
| 45 to 54 Years | 144 (11.4%) | 919 (72.5%) |
| 55 to 64 Years | 235 (17.2%) | 1,026 (75.1%) |
| 65 to 74 Years | 904 (95.8%) | 366 (38.8%) |
| 75 Years and over | 614 (100.0%) | 366 (59.6%) |
| Total | 3,344 (26.8%) | 8,490 (68.0%) |
Disability Status by Sex by Age in Goldenrod
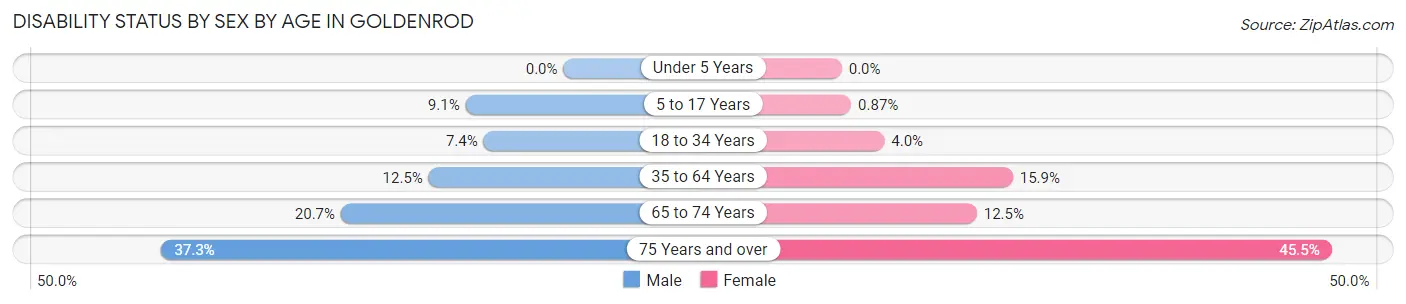
| Age Bracket | Male | Female |
| Under 5 Years | 0 (0.0%) | 0 (0.0%) |
| 5 to 17 Years | 70 (9.1%) | 7 (0.9%) |
| 18 to 34 Years | 187 (7.4%) | 83 (4.0%) |
| 35 to 64 Years | 243 (12.5%) | 354 (15.9%) |
| 65 to 74 Years | 101 (20.6%) | 57 (12.5%) |
| 75 Years and over | 69 (37.3%) | 195 (45.5%) |
Disability Class by Sex by Age in Goldenrod
Disability Class: Hearing Difficulty
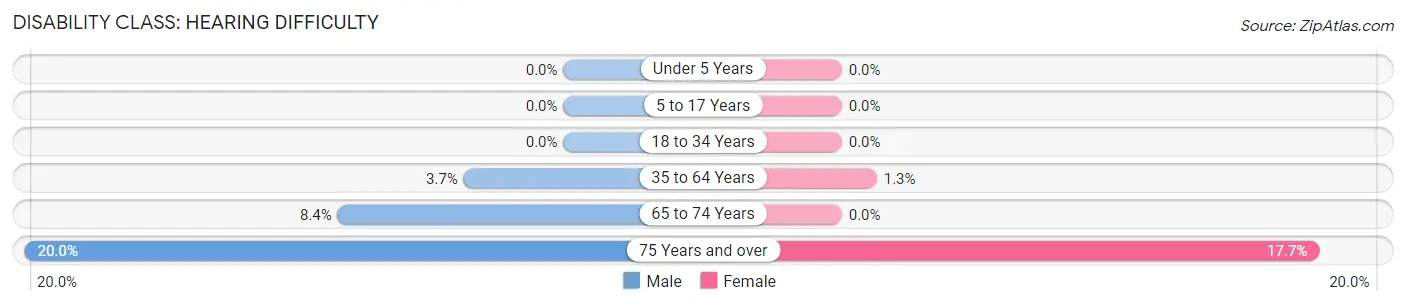
| Age Bracket | Male | Female |
| Under 5 Years | 0 (0.0%) | 0 (0.0%) |
| 5 to 17 Years | 0 (0.0%) | 0 (0.0%) |
| 18 to 34 Years | 0 (0.0%) | 0 (0.0%) |
| 35 to 64 Years | 72 (3.7%) | 29 (1.3%) |
| 65 to 74 Years | 41 (8.4%) | 0 (0.0%) |
| 75 Years and over | 37 (20.0%) | 76 (17.7%) |
Disability Class: Vision Difficulty
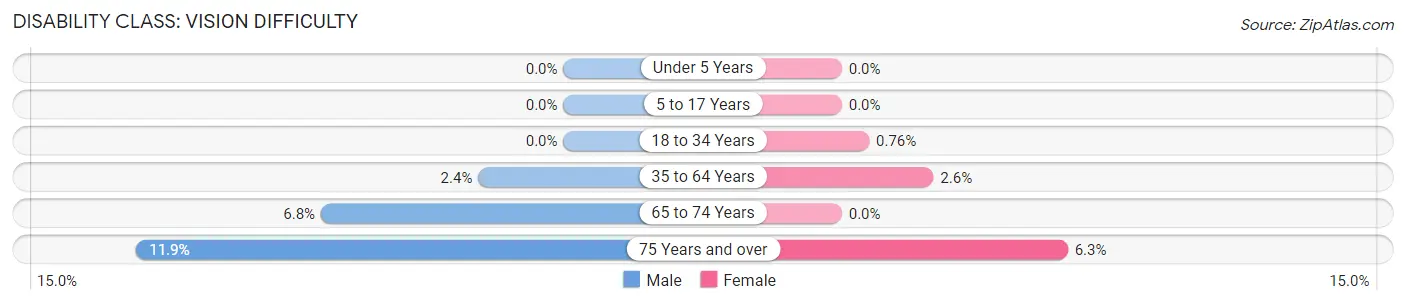
| Age Bracket | Male | Female |
| Under 5 Years | 0 (0.0%) | 0 (0.0%) |
| 5 to 17 Years | 0 (0.0%) | 0 (0.0%) |
| 18 to 34 Years | 0 (0.0%) | 16 (0.8%) |
| 35 to 64 Years | 46 (2.4%) | 57 (2.5%) |
| 65 to 74 Years | 33 (6.8%) | 0 (0.0%) |
| 75 Years and over | 22 (11.9%) | 27 (6.3%) |
Disability Class: Cognitive Difficulty
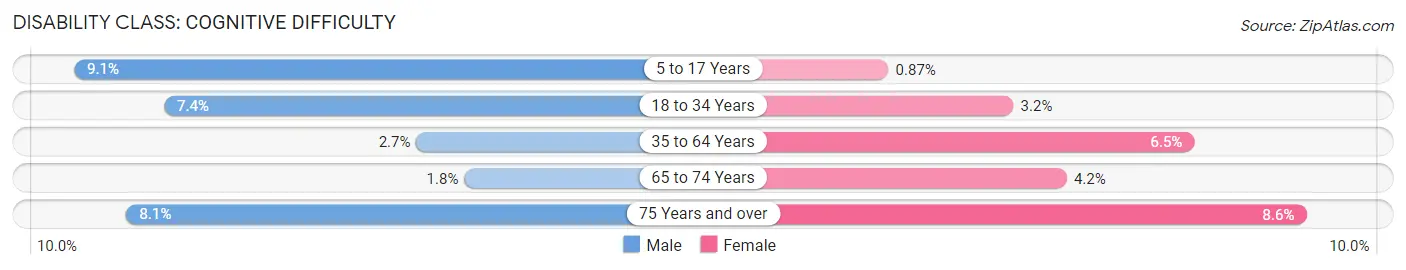
| Age Bracket | Male | Female |
| 5 to 17 Years | 70 (9.1%) | 7 (0.9%) |
| 18 to 34 Years | 187 (7.4%) | 67 (3.2%) |
| 35 to 64 Years | 53 (2.7%) | 146 (6.5%) |
| 65 to 74 Years | 9 (1.8%) | 19 (4.2%) |
| 75 Years and over | 15 (8.1%) | 37 (8.6%) |
Disability Class: Ambulatory Difficulty
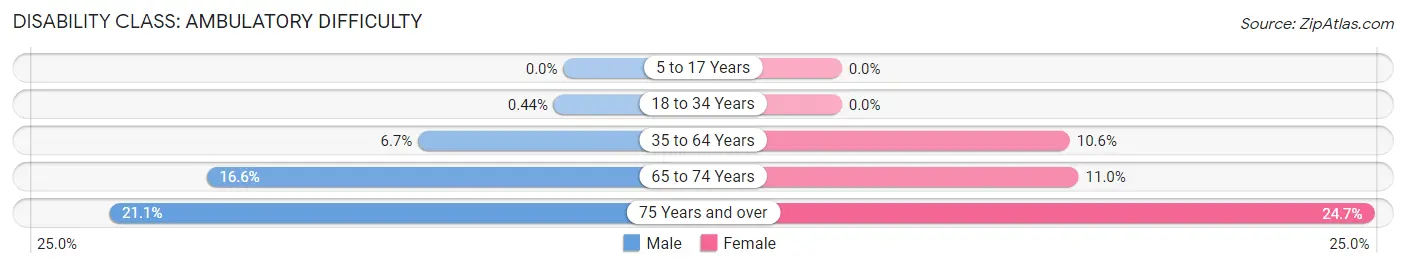
| Age Bracket | Male | Female |
| 5 to 17 Years | 0 (0.0%) | 0 (0.0%) |
| 18 to 34 Years | 11 (0.4%) | 0 (0.0%) |
| 35 to 64 Years | 131 (6.7%) | 236 (10.6%) |
| 65 to 74 Years | 81 (16.6%) | 50 (11.0%) |
| 75 Years and over | 39 (21.1%) | 106 (24.7%) |
Disability Class: Self-Care Difficulty
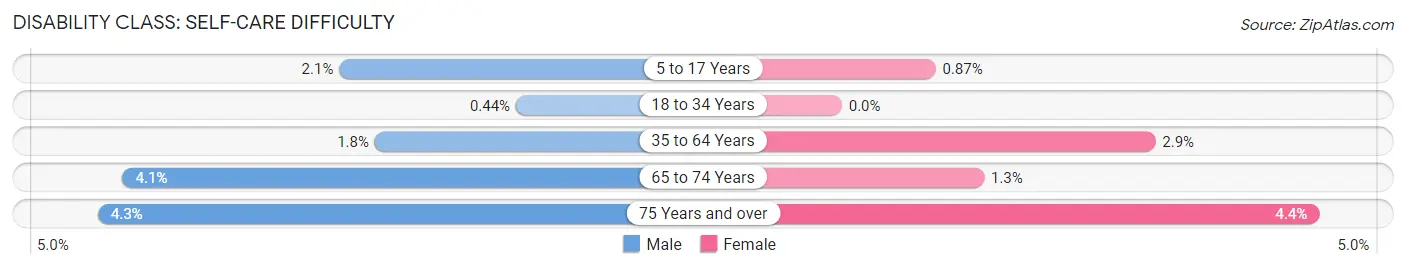
| Age Bracket | Male | Female |
| 5 to 17 Years | 16 (2.1%) | 7 (0.9%) |
| 18 to 34 Years | 11 (0.4%) | 0 (0.0%) |
| 35 to 64 Years | 34 (1.8%) | 65 (2.9%) |
| 65 to 74 Years | 20 (4.1%) | 6 (1.3%) |
| 75 Years and over | 8 (4.3%) | 19 (4.4%) |
Technology Access in Goldenrod
Computing Device Access in Goldenrod
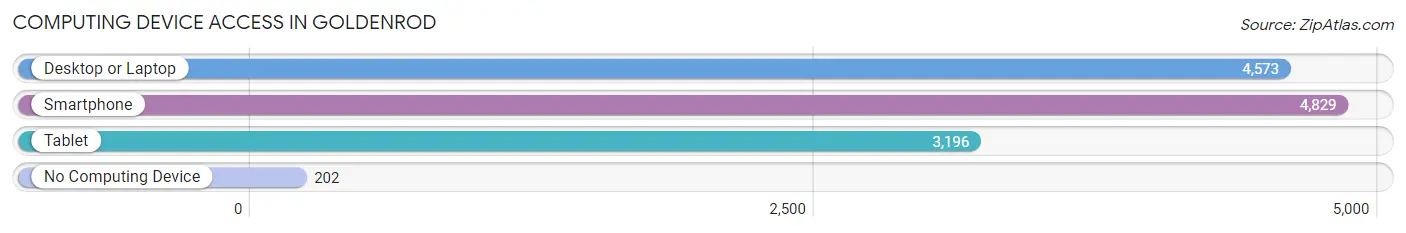
| Device Type | # Households | % Households |
| Desktop or Laptop | 4,573 | 87.2% |
| Smartphone | 4,829 | 92.0% |
| Tablet | 3,196 | 60.9% |
| No Computing Device | 202 | 3.8% |
| Total | 5,247 | 100.0% |
Internet Access in Goldenrod
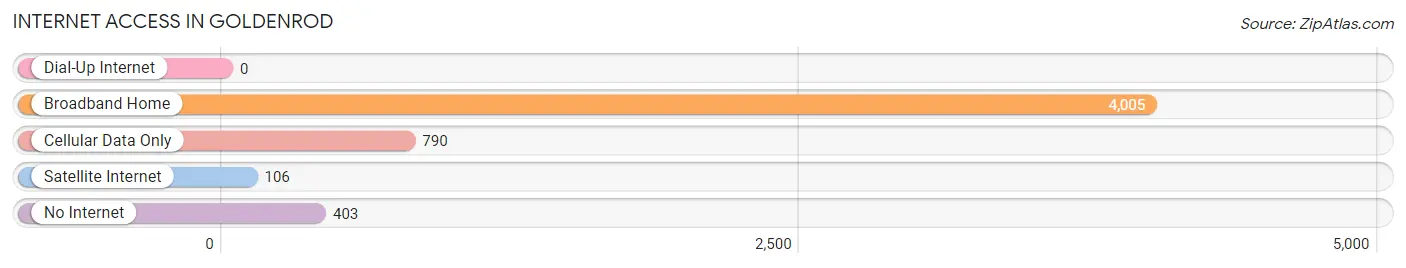
| Internet Type | # Households | % Households |
| Dial-Up Internet | 0 | 0.0% |
| Broadband Home | 4,005 | 76.3% |
| Cellular Data Only | 790 | 15.1% |
| Satellite Internet | 106 | 2.0% |
| No Internet | 403 | 7.7% |
| Total | 5,247 | 100.0% |
Goldenrod Summary
History
Goldenrod is a small unincorporated community located in Orange County, Florida. It is situated between the cities of Winter Park and Casselberry, and is part of the Orlando–Kissimmee–Sanford Metropolitan Statistical Area. The area was first settled in the late 19th century by a group of settlers from Georgia, who named the area after the goldenrod flowers that grew in abundance in the area.
The area was originally a farming community, with citrus groves and vegetable farms being the main sources of income. In the early 20th century, the area began to develop as a residential community, with the construction of several homes and businesses. The area was officially incorporated as a town in 1925, and the first mayor was elected in 1926.
In the 1950s, the area began to experience rapid growth, as the population of Orlando and the surrounding area began to increase. This growth was fueled by the construction of the nearby Orlando International Airport, which opened in 1959. The airport brought an influx of new residents and businesses to the area, and Goldenrod quickly became a popular destination for tourists and business travelers.
Geography
Goldenrod is located in Orange County, Florida, and is situated between the cities of Winter Park and Casselberry. The area is part of the Orlando–Kissimmee–Sanford Metropolitan Statistical Area. The community is located on the northern edge of the Orlando metropolitan area, and is approximately 15 miles from downtown Orlando.
The area is characterized by rolling hills and flatlands, with the highest point in the area being located at an elevation of approximately 100 feet. The area is home to several lakes, including Lake Goldenrod, Lake Howell, and Lake Sybelia. The area is also home to several parks, including Goldenrod Park, which is located in the center of the community.
Economy
The economy of Goldenrod is largely based on tourism and retail. The area is home to several hotels and resorts, as well as a variety of restaurants and shops. The area is also home to several corporate offices, including those of the Orlando International Airport.
The area is also home to several manufacturing and industrial businesses, including a large printing plant and a manufacturing facility for medical equipment. The area is also home to several technology companies, including a software development firm and a web design company.
Demographics
As of the 2010 census, the population of Goldenrod was 8,719. The racial makeup of the area was 79.3% White, 11.2% African American, 0.7% Native American, 2.2% Asian, 0.1% Pacific Islander, 4.2% from other races, and 2.5% from two or more races. Hispanic or Latino of any race were 11.2% of the population.
The median household income in Goldenrod was $45,813, and the median family income was $50,945. The per capita income for the area was $22,845. About 8.3% of families and 10.2% of the population were below the poverty line, including 14.2% of those under age 18 and 6.2% of those age 65 or over.
Common Questions
What is Per Capita Income in Goldenrod?
Per Capita income in Goldenrod is $33,795.
What is the Median Family Income in Goldenrod?
Median Family Income in Goldenrod is $90,125.
What is the Median Household income in Goldenrod?
Median Household Income in Goldenrod is $61,495.
What is Income or Wage Gap in Goldenrod?
Income or Wage Gap in Goldenrod is 1.4%.
Women in Goldenrod earn 98.6 cents for every dollar earned by a man.
What is Family Income Deficit in Goldenrod?
Family Income Deficit in Goldenrod is $7,059.
Families that are below poverty line in Goldenrod earn $7,059 less on average than the poverty threshold level.
What is Inequality or Gini Index in Goldenrod?
Inequality or Gini Index in Goldenrod is 0.45.
What is the Total Population of Goldenrod?
Total Population of Goldenrod is 12,496.
What is the Total Male Population of Goldenrod?
Total Male Population of Goldenrod is 6,179.
What is the Total Female Population of Goldenrod?
Total Female Population of Goldenrod is 6,317.
What is the Ratio of Males per 100 Females in Goldenrod?
There are 97.82 Males per 100 Females in Goldenrod.
What is the Ratio of Females per 100 Males in Goldenrod?
There are 102.23 Females per 100 Males in Goldenrod.
What is the Median Population Age in Goldenrod?
Median Population Age in Goldenrod is 32.3 Years.
What is the Average Family Size in Goldenrod
Average Family Size in Goldenrod is 3.0 People.
What is the Average Household Size in Goldenrod
Average Household Size in Goldenrod is 2.4 People.
How Large is the Labor Force in Goldenrod?
There are 7,393 People in the Labor Forcein in Goldenrod.
What is the Percentage of People in the Labor Force in Goldenrod?
69.9% of People are in the Labor Force in Goldenrod.
What is the Unemployment Rate in Goldenrod?
Unemployment Rate in Goldenrod is 8.8%.