Sebastian, FL Map & Demographics
Sebastian Map
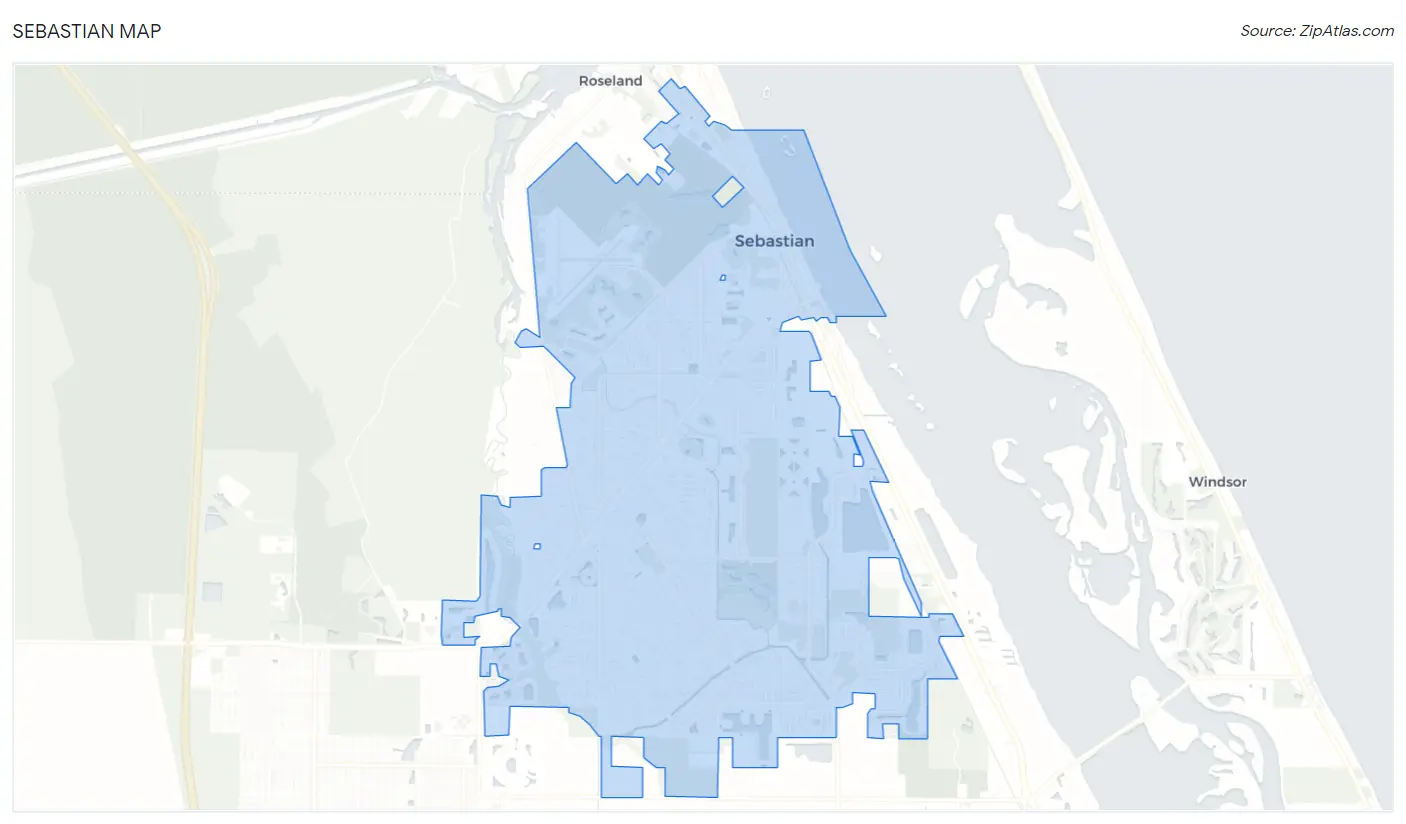
Sebastian Overview
$39,802
PER CAPITA INCOME
$74,826
AVG FAMILY INCOME
$65,650
AVG HOUSEHOLD INCOME
1.3%
WAGE / INCOME GAP [ % ]
98.7¢/ $1
WAGE / INCOME GAP [ $ ]
0.44
INEQUALITY / GINI INDEX
25,266
TOTAL POPULATION
12,389
MALE POPULATION
12,877
FEMALE POPULATION
96.21
MALES / 100 FEMALES
103.94
FEMALES / 100 MALES
57.5
MEDIAN AGE
2.8
AVG FAMILY SIZE
2.3
AVG HOUSEHOLD SIZE
10,682
LABOR FORCE [ PEOPLE ]
47.8%
PERCENT IN LABOR FORCE
9.6%
UNEMPLOYMENT RATE
Sebastian Area Codes
Income in Sebastian
Income Overview in Sebastian
Per Capita Income in Sebastian is $39,802, while median incomes of families and households are $74,826 and $65,650 respectively.
| Characteristic | Number | Measure |
| Per Capita Income | 25,266 | $39,802 |
| Median Family Income | 7,110 | $74,826 |
| Mean Family Income | 7,110 | $96,515 |
| Median Household Income | 10,946 | $65,650 |
| Mean Household Income | 10,946 | $84,870 |
| Income Deficit | 7,110 | $0 |
| Wage / Income Gap (%) | 25,266 | 1.29% |
| Wage / Income Gap ($) | 25,266 | 98.71¢ per $1 |
| Gini / Inequality Index | 25,266 | 0.44 |
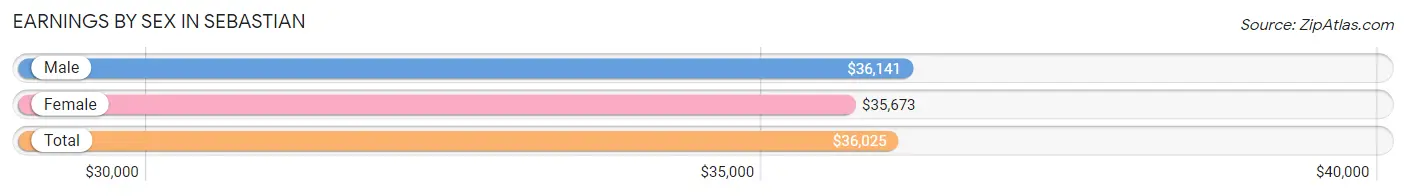
Earnings by Sex in Sebastian
Average Earnings in Sebastian are $36,025, $36,141 for men and $35,673 for women, a difference of 1.3%.
| Sex | Number | Average Earnings |
| Male | 6,271 (56.3%) | $36,141 |
| Female | 4,861 (43.7%) | $35,673 |
| Total | 11,132 (100.0%) | $36,025 |
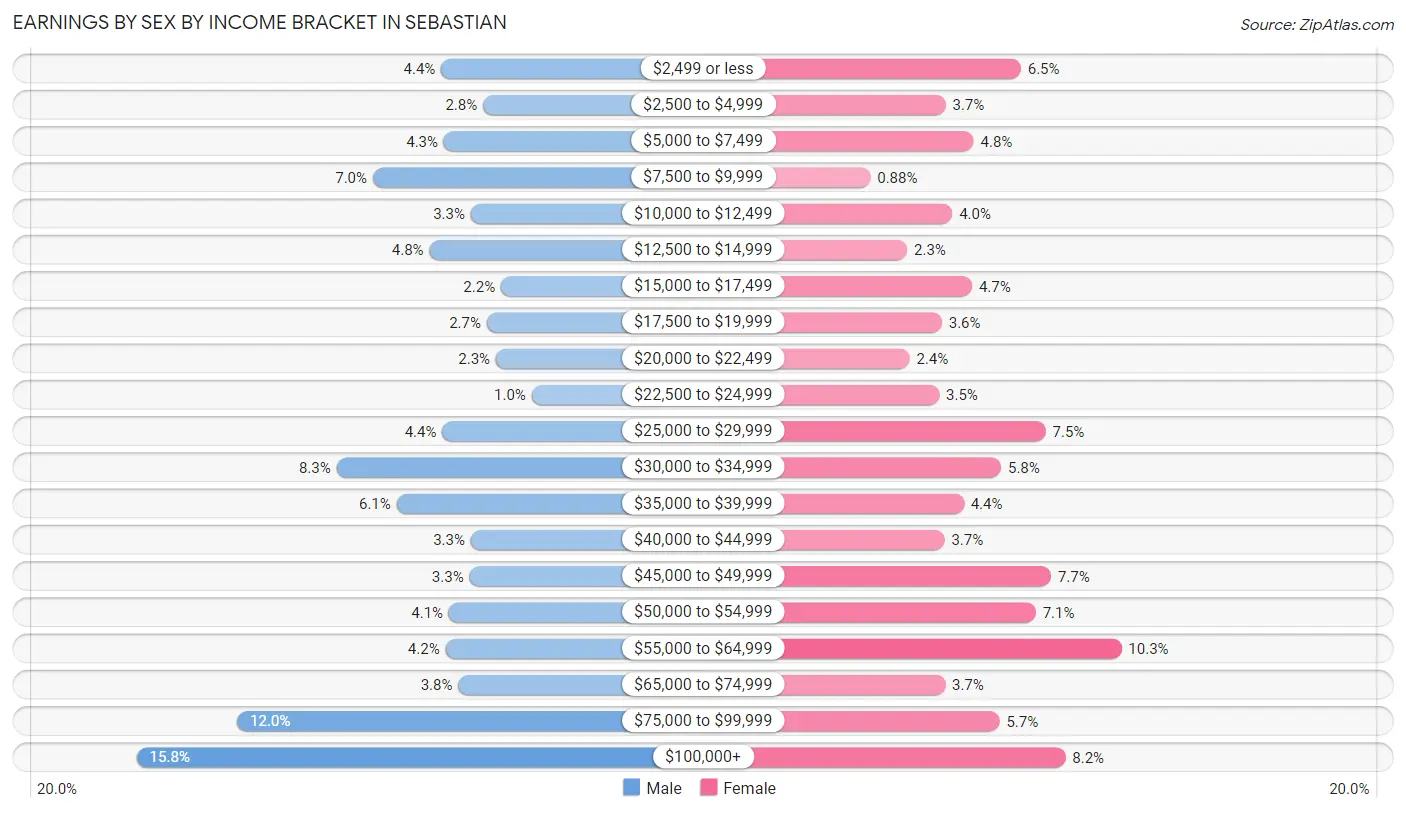
Earnings by Sex by Income Bracket in Sebastian
The most common earnings brackets in Sebastian are $100,000+ for men (991 | 15.8%) and $55,000 to $64,999 for women (500 | 10.3%).
| Income | Male | Female |
| $2,499 or less | 275 (4.4%) | 317 (6.5%) |
| $2,500 to $4,999 | 177 (2.8%) | 180 (3.7%) |
| $5,000 to $7,499 | 269 (4.3%) | 231 (4.8%) |
| $7,500 to $9,999 | 436 (7.0%) | 43 (0.9%) |
| $10,000 to $12,499 | 206 (3.3%) | 192 (4.0%) |
| $12,500 to $14,999 | 303 (4.8%) | 110 (2.3%) |
| $15,000 to $17,499 | 135 (2.1%) | 228 (4.7%) |
| $17,500 to $19,999 | 168 (2.7%) | 173 (3.6%) |
| $20,000 to $22,499 | 147 (2.3%) | 114 (2.4%) |
| $22,500 to $24,999 | 63 (1.0%) | 168 (3.5%) |
| $25,000 to $29,999 | 273 (4.3%) | 362 (7.4%) |
| $30,000 to $34,999 | 521 (8.3%) | 281 (5.8%) |
| $35,000 to $39,999 | 380 (6.1%) | 213 (4.4%) |
| $40,000 to $44,999 | 206 (3.3%) | 178 (3.7%) |
| $45,000 to $49,999 | 209 (3.3%) | 372 (7.6%) |
| $50,000 to $54,999 | 257 (4.1%) | 344 (7.1%) |
| $55,000 to $64,999 | 265 (4.2%) | 500 (10.3%) |
| $65,000 to $74,999 | 235 (3.7%) | 179 (3.7%) |
| $75,000 to $99,999 | 755 (12.0%) | 278 (5.7%) |
| $100,000+ | 991 (15.8%) | 398 (8.2%) |
| Total | 6,271 (100.0%) | 4,861 (100.0%) |
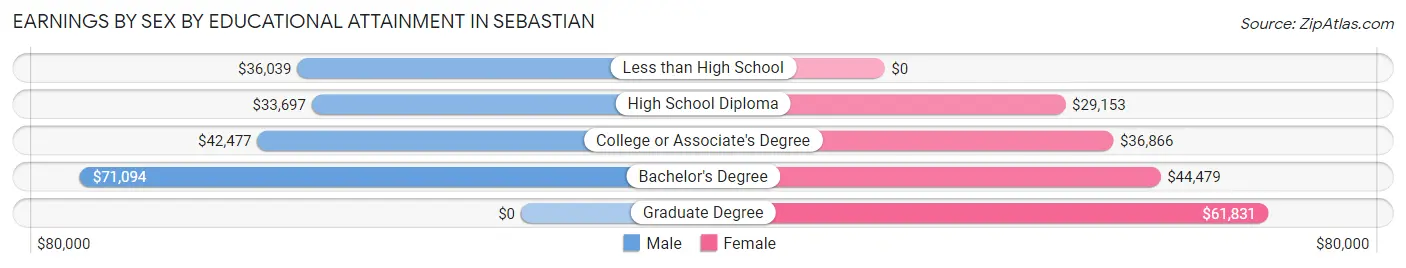
Earnings by Sex by Educational Attainment in Sebastian
Average earnings in Sebastian are $41,161 for men and $39,857 for women, a difference of 3.2%. Men with an educational attainment of bachelor's degree enjoy the highest average annual earnings of $71,094, while those with high school diploma education earn the least with $33,697. Women with an educational attainment of graduate degree earn the most with the average annual earnings of $61,831, while those with high school diploma education have the smallest earnings of $29,153.
| Educational Attainment | Male Income | Female Income |
| Less than High School | $36,039 | $0 |
| High School Diploma | $33,697 | $29,153 |
| College or Associate's Degree | $42,477 | $36,866 |
| Bachelor's Degree | $71,094 | $44,479 |
| Graduate Degree | - | - |
| Total | $41,161 | $39,857 |
Family Income in Sebastian
Family Income Brackets in Sebastian
According to the Sebastian family income data, there are 1,507 families falling into the $50,000 to $74,999 income range, which is the most common income bracket and makes up 21.2% of all families. Conversely, the $10,000 to $14,999 income bracket is the least frequent group with only 92 families (1.3%) belonging to this category.
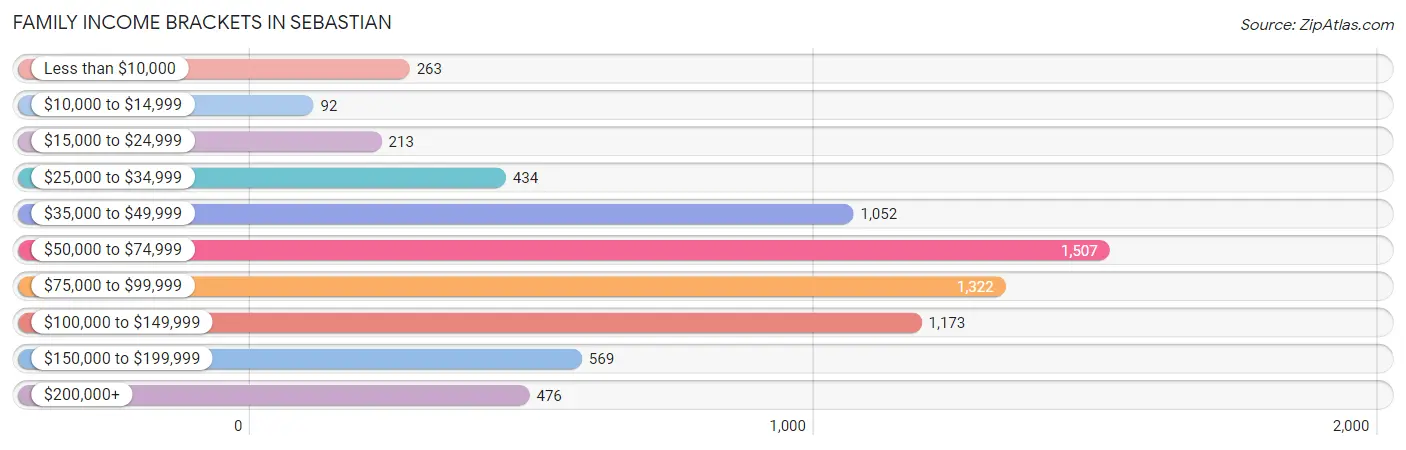
| Income Bracket | # Families | % Families |
| Less than $10,000 | 263 | 3.7% |
| $10,000 to $14,999 | 92 | 1.3% |
| $15,000 to $24,999 | 213 | 3.0% |
| $25,000 to $34,999 | 434 | 6.1% |
| $35,000 to $49,999 | 1,052 | 14.8% |
| $50,000 to $74,999 | 1,507 | 21.2% |
| $75,000 to $99,999 | 1,322 | 18.6% |
| $100,000 to $149,999 | 1,173 | 16.5% |
| $150,000 to $199,999 | 569 | 8.0% |
| $200,000+ | 476 | 6.7% |
Family Income by Famaliy Size in Sebastian
7+ person families (58 | 0.8%) account for the highest median family income in Sebastian with $250,001 per family, while 7+ person families (58 | 0.8%) have the highest median income of $35,714 per family member.
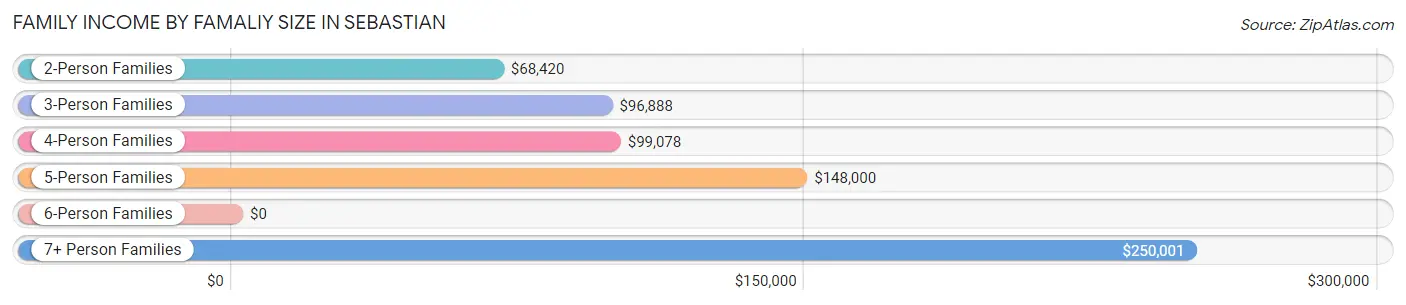
| Income Bracket | # Families | Median Income |
| 2-Person Families | 5,236 (73.6%) | $68,420 |
| 3-Person Families | 854 (12.0%) | $96,888 |
| 4-Person Families | 761 (10.7%) | $99,078 |
| 5-Person Families | 186 (2.6%) | $148,000 |
| 6-Person Families | 15 (0.2%) | $0 |
| 7+ Person Families | 58 (0.8%) | $250,001 |
| Total | 7,110 (100.0%) | $74,826 |
Family Income by Number of Earners in Sebastian
The median family income in Sebastian is $74,826, with families comprising 3+ earners (440) having the highest median family income of $97,225, while families with no earners (2,396) have the lowest median family income of $57,567, accounting for 6.2% and 33.7% of families, respectively.
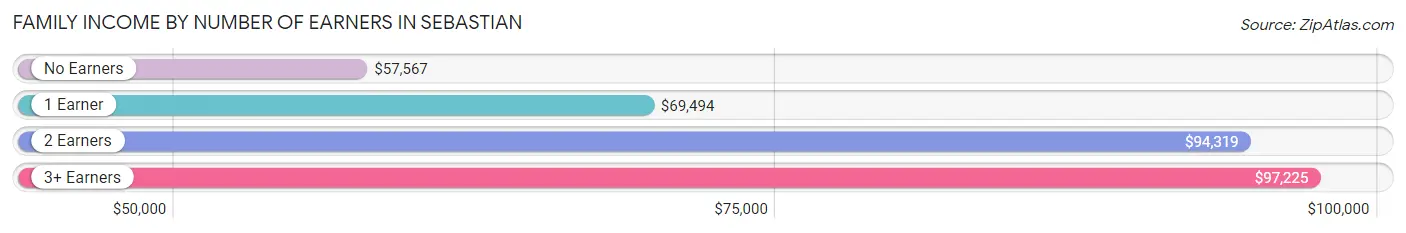
| Number of Earners | # Families | Median Income |
| No Earners | 2,396 (33.7%) | $57,567 |
| 1 Earner | 2,333 (32.8%) | $69,494 |
| 2 Earners | 1,941 (27.3%) | $94,319 |
| 3+ Earners | 440 (6.2%) | $97,225 |
| Total | 7,110 (100.0%) | $74,826 |
Household Income in Sebastian
Household Income Brackets in Sebastian
With 2,244 households falling in the category, the $50,000 to $74,999 income range is the most frequent in Sebastian, accounting for 20.5% of all households. In contrast, only 186 households (1.7%) fall into the $10,000 to $14,999 income bracket, making it the least populous group.
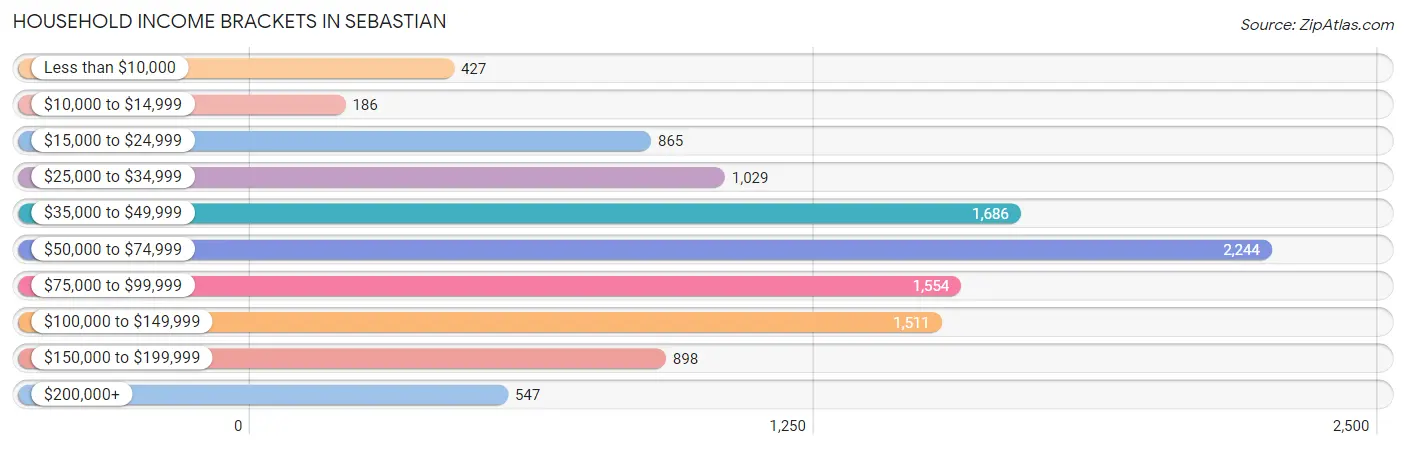
| Income Bracket | # Households | % Households |
| Less than $10,000 | 427 | 3.9% |
| $10,000 to $14,999 | 186 | 1.7% |
| $15,000 to $24,999 | 865 | 7.9% |
| $25,000 to $34,999 | 1,029 | 9.4% |
| $35,000 to $49,999 | 1,686 | 15.4% |
| $50,000 to $74,999 | 2,244 | 20.5% |
| $75,000 to $99,999 | 1,554 | 14.2% |
| $100,000 to $149,999 | 1,511 | 13.8% |
| $150,000 to $199,999 | 898 | 8.2% |
| $200,000+ | 547 | 5.0% |
Household Income by Householder Age in Sebastian
The median household income in Sebastian is $65,650, with the highest median household income of $81,747 found in the 45 to 64 years age bracket for the primary householder. A total of 4,077 households (37.2%) fall into this category. Meanwhile, the 15 to 24 years age bracket for the primary householder has the lowest median household income of $0, with 18 households (0.2%) in this group.
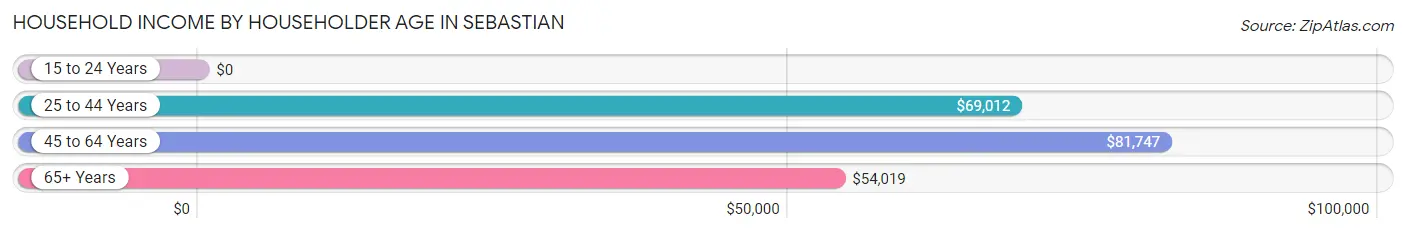
| Income Bracket | # Households | Median Income |
| 15 to 24 Years | 18 (0.2%) | $0 |
| 25 to 44 Years | 1,631 (14.9%) | $69,012 |
| 45 to 64 Years | 4,077 (37.2%) | $81,747 |
| 65+ Years | 5,220 (47.7%) | $54,019 |
| Total | 10,946 (100.0%) | $65,650 |
Poverty in Sebastian
Income Below Poverty by Sex and Age in Sebastian
With 8.4% poverty level for males and 9.2% for females among the residents of Sebastian, 16 and 17 year old males and 15 year old females are the most vulnerable to poverty, with 177 males (48.8%) and 55 females (100.0%) in their respective age groups living below the poverty level.
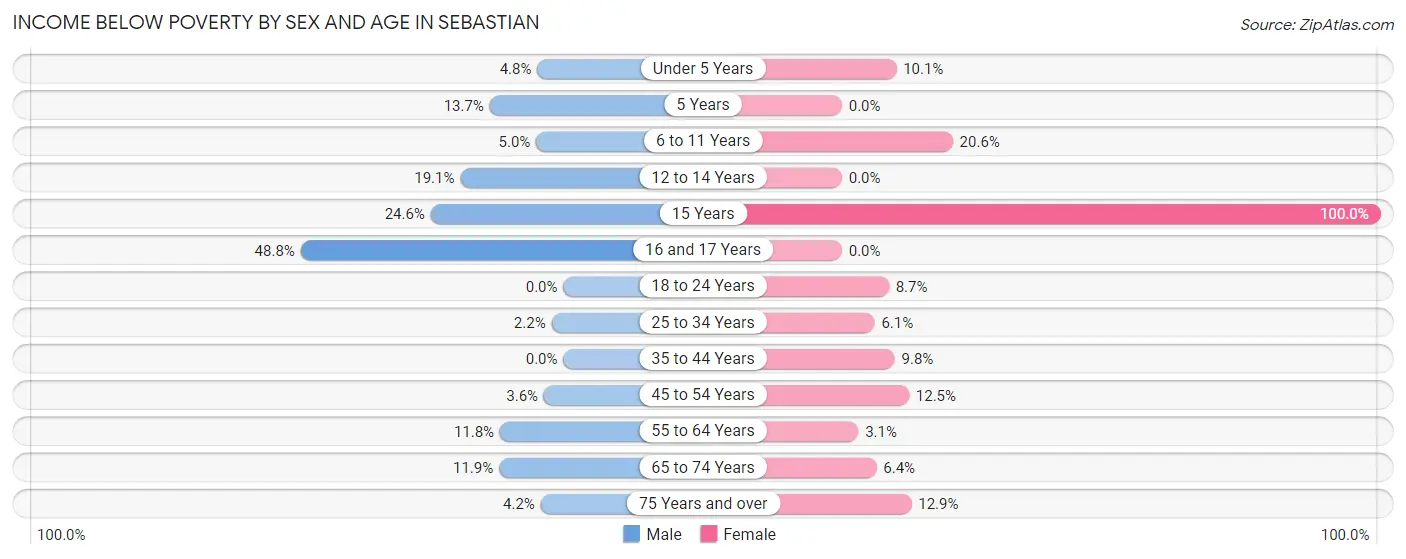
| Age Bracket | Male | Female |
| Under 5 Years | 12 (4.8%) | 40 (10.1%) |
| 5 Years | 19 (13.7%) | 0 (0.0%) |
| 6 to 11 Years | 23 (5.0%) | 128 (20.6%) |
| 12 to 14 Years | 61 (19.1%) | 0 (0.0%) |
| 15 Years | 49 (24.6%) | 55 (100.0%) |
| 16 and 17 Years | 177 (48.8%) | 0 (0.0%) |
| 18 to 24 Years | 0 (0.0%) | 29 (8.7%) |
| 25 to 34 Years | 24 (2.2%) | 53 (6.1%) |
| 35 to 44 Years | 0 (0.0%) | 99 (9.8%) |
| 45 to 54 Years | 47 (3.6%) | 226 (12.4%) |
| 55 to 64 Years | 277 (11.8%) | 62 (3.0%) |
| 65 to 74 Years | 279 (11.9%) | 170 (6.4%) |
| 75 Years and over | 74 (4.2%) | 319 (12.9%) |
| Total | 1,042 (8.4%) | 1,181 (9.2%) |
Income Above Poverty by Sex and Age in Sebastian
According to the poverty statistics in Sebastian, males aged 18 to 24 years and females aged 5 years are the age groups that are most secure financially, with 100.0% of males and 100.0% of females in these age groups living above the poverty line.
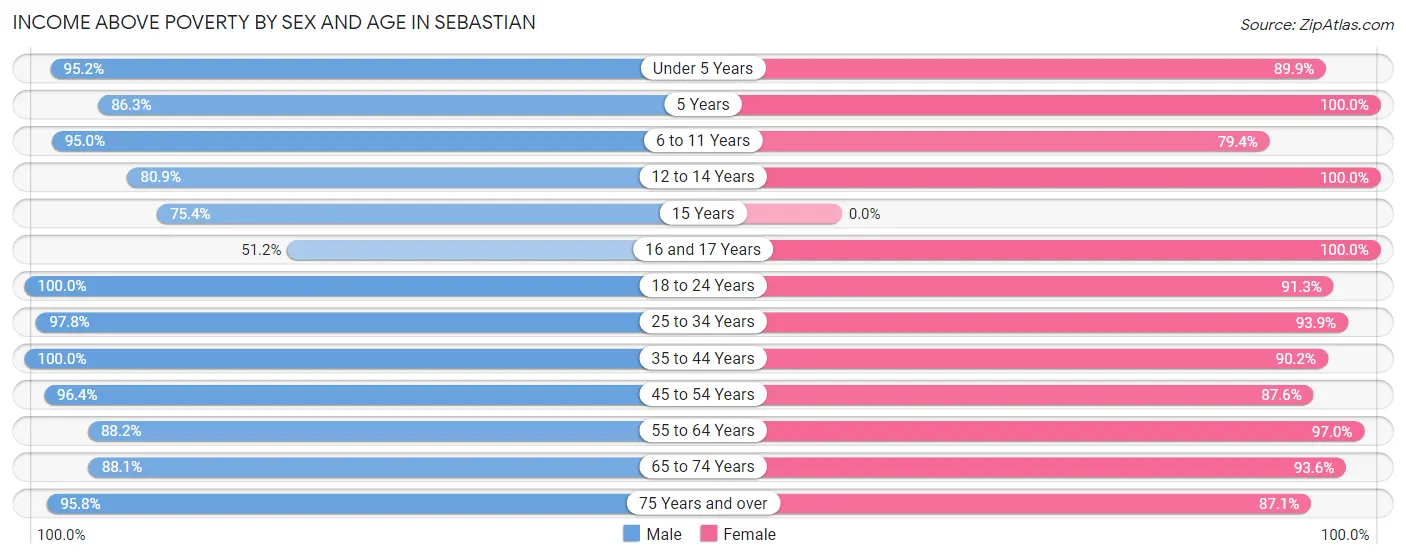
| Age Bracket | Male | Female |
| Under 5 Years | 236 (95.2%) | 356 (89.9%) |
| 5 Years | 120 (86.3%) | 114 (100.0%) |
| 6 to 11 Years | 433 (95.0%) | 494 (79.4%) |
| 12 to 14 Years | 258 (80.9%) | 308 (100.0%) |
| 15 Years | 150 (75.4%) | 0 (0.0%) |
| 16 and 17 Years | 186 (51.2%) | 151 (100.0%) |
| 18 to 24 Years | 614 (100.0%) | 304 (91.3%) |
| 25 to 34 Years | 1,065 (97.8%) | 822 (93.9%) |
| 35 to 44 Years | 1,189 (100.0%) | 911 (90.2%) |
| 45 to 54 Years | 1,256 (96.4%) | 1,589 (87.5%) |
| 55 to 64 Years | 2,077 (88.2%) | 1,970 (97.0%) |
| 65 to 74 Years | 2,060 (88.1%) | 2,481 (93.6%) |
| 75 Years and over | 1,683 (95.8%) | 2,153 (87.1%) |
| Total | 11,327 (91.6%) | 11,653 (90.8%) |
Income Below Poverty Among Married-Couple Families in Sebastian
The poverty statistics for married-couple families in Sebastian show that 4.5% or 271 of the total 5,972 families live below the poverty line. Families with no children have the highest poverty rate of 5.1%, comprising of 253 families. On the other hand, families with 3 or 4 children have the lowest poverty rate of 0.0%, which includes 0 families.
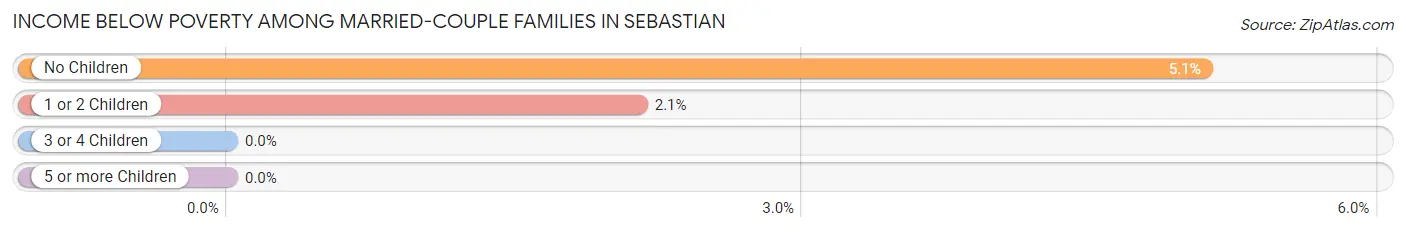
| Children | Above Poverty | Below Poverty |
| No Children | 4,715 (94.9%) | 253 (5.1%) |
| 1 or 2 Children | 822 (97.9%) | 18 (2.1%) |
| 3 or 4 Children | 137 (100.0%) | 0 (0.0%) |
| 5 or more Children | 27 (100.0%) | 0 (0.0%) |
| Total | 5,701 (95.5%) | 271 (4.5%) |
Income Below Poverty Among Single-Parent Households in Sebastian
According to the poverty data in Sebastian, 22.5% or 107 single-father households and 15.3% or 101 single-mother households are living below the poverty line. Among single-father households, those with no children have the highest poverty rate, with 93 households (28.9%) experiencing poverty. Likewise, among single-mother households, those with 3 or 4 children have the highest poverty rate, with 31 households (88.6%) falling below the poverty line.
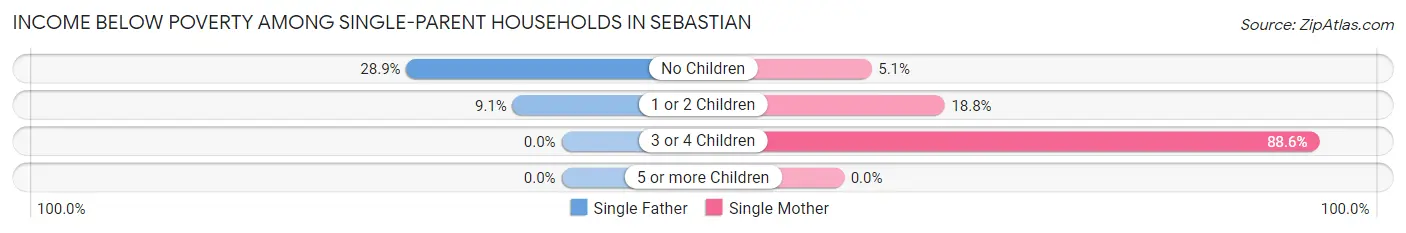
| Children | Single Father | Single Mother |
| No Children | 93 (28.9%) | 18 (5.1%) |
| 1 or 2 Children | 14 (9.1%) | 52 (18.8%) |
| 3 or 4 Children | 0 (0.0%) | 31 (88.6%) |
| 5 or more Children | 0 (0.0%) | 0 (0.0%) |
| Total | 107 (22.5%) | 101 (15.3%) |
Income Below Poverty Among Married-Couple vs Single-Parent Households in Sebastian
The poverty data for Sebastian shows that 271 of the married-couple family households (4.5%) and 208 of the single-parent households (18.3%) are living below the poverty level. Within the married-couple family households, those with no children have the highest poverty rate, with 253 households (5.1%) falling below the poverty line. Among the single-parent households, those with 3 or 4 children have the highest poverty rate, with 31 household (88.6%) living below poverty.
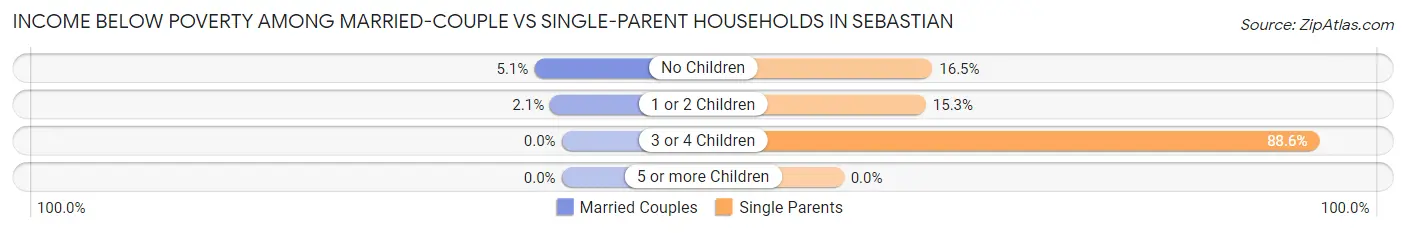
| Children | Married-Couple Families | Single-Parent Households |
| No Children | 253 (5.1%) | 111 (16.5%) |
| 1 or 2 Children | 18 (2.1%) | 66 (15.3%) |
| 3 or 4 Children | 0 (0.0%) | 31 (88.6%) |
| 5 or more Children | 0 (0.0%) | 0 (0.0%) |
| Total | 271 (4.5%) | 208 (18.3%) |
Race in Sebastian
The most populous races in Sebastian are White / Caucasian (21,667 | 85.8%), Hispanic or Latino (2,216 | 8.8%), and Two or more Races (2,040 | 8.1%).
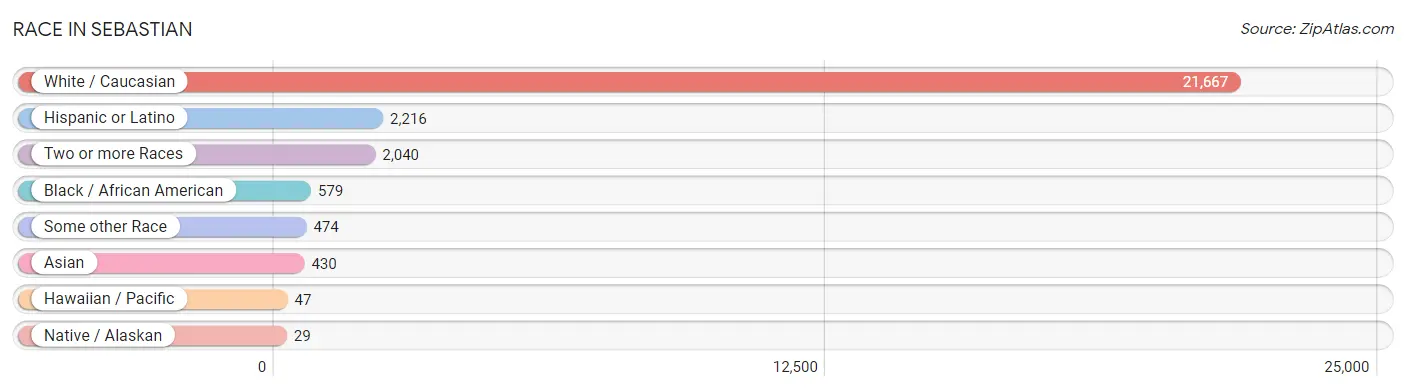
| Race | # Population | % Population |
| Asian | 430 | 1.7% |
| Black / African American | 579 | 2.3% |
| Hawaiian / Pacific | 47 | 0.2% |
| Hispanic or Latino | 2,216 | 8.8% |
| Native / Alaskan | 29 | 0.1% |
| White / Caucasian | 21,667 | 85.8% |
| Two or more Races | 2,040 | 8.1% |
| Some other Race | 474 | 1.9% |
| Total | 25,266 | 100.0% |
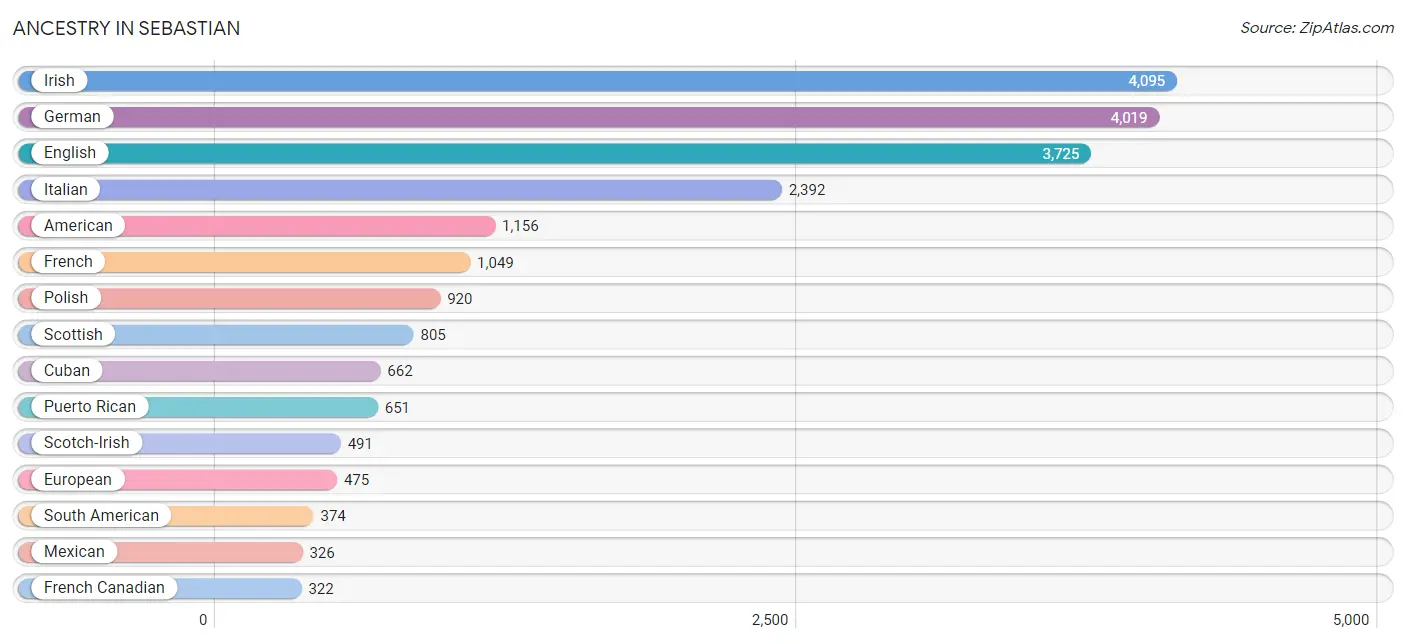
Ancestry in Sebastian
The most populous ancestries reported in Sebastian are Irish (4,095 | 16.2%), German (4,019 | 15.9%), English (3,725 | 14.7%), Italian (2,392 | 9.5%), and American (1,156 | 4.6%), together accounting for 60.9% of all Sebastian residents.
| Ancestry | # Population | % Population |
| Albanian | 6 | 0.0% |
| American | 1,156 | 4.6% |
| Arab | 75 | 0.3% |
| Armenian | 21 | 0.1% |
| Assyrian / Chaldean / Syriac | 20 | 0.1% |
| Austrian | 180 | 0.7% |
| Bangladeshi | 83 | 0.3% |
| Basque | 24 | 0.1% |
| Bhutanese | 41 | 0.2% |
| Brazilian | 117 | 0.5% |
| British | 172 | 0.7% |
| Canadian | 66 | 0.3% |
| Celtic | 37 | 0.2% |
| Central American | 145 | 0.6% |
| Central American Indian | 160 | 0.6% |
| Cherokee | 8 | 0.0% |
| Choctaw | 5 | 0.0% |
| Colombian | 178 | 0.7% |
| Cuban | 662 | 2.6% |
| Czech | 90 | 0.4% |
| Czechoslovakian | 33 | 0.1% |
| Danish | 32 | 0.1% |
| Dominican | 28 | 0.1% |
| Dutch | 189 | 0.7% |
| Dutch West Indian | 12 | 0.1% |
| Eastern European | 35 | 0.1% |
| Ecuadorian | 181 | 0.7% |
| English | 3,725 | 14.7% |
| Estonian | 71 | 0.3% |
| European | 475 | 1.9% |
| Finnish | 35 | 0.1% |
| French | 1,049 | 4.2% |
| French Canadian | 322 | 1.3% |
| German | 4,019 | 15.9% |
| Greek | 106 | 0.4% |
| Guatemalan | 132 | 0.5% |
| Hungarian | 106 | 0.4% |
| Indian (Asian) | 1 | 0.0% |
| Irish | 4,095 | 16.2% |
| Italian | 2,392 | 9.5% |
| Jamaican | 97 | 0.4% |
| Korean | 132 | 0.5% |
| Lithuanian | 137 | 0.5% |
| Maltese | 12 | 0.1% |
| Mexican | 326 | 1.3% |
| Native Hawaiian | 21 | 0.1% |
| Nicaraguan | 13 | 0.1% |
| Northern European | 17 | 0.1% |
| Norwegian | 171 | 0.7% |
| Pakistani | 34 | 0.1% |
| Pennsylvania German | 15 | 0.1% |
| Peruvian | 15 | 0.1% |
| Polish | 920 | 3.6% |
| Portuguese | 108 | 0.4% |
| Puerto Rican | 651 | 2.6% |
| Romanian | 9 | 0.0% |
| Russian | 139 | 0.5% |
| Scandinavian | 52 | 0.2% |
| Scotch-Irish | 491 | 1.9% |
| Scottish | 805 | 3.2% |
| Sioux | 10 | 0.0% |
| Slavic | 59 | 0.2% |
| Slovak | 13 | 0.1% |
| South American | 374 | 1.5% |
| Spaniard | 20 | 0.1% |
| Sri Lankan | 14 | 0.1% |
| Swedish | 258 | 1.0% |
| Swiss | 29 | 0.1% |
| Syrian | 47 | 0.2% |
| Thai | 204 | 0.8% |
| Ukrainian | 149 | 0.6% |
| Welsh | 102 | 0.4% |
| Yugoslavian | 20 | 0.1% | View All 73 Rows |
Immigrants in Sebastian
The most numerous immigrant groups reported in Sebastian came from Latin America (782 | 3.1%), Europe (649 | 2.6%), South America (353 | 1.4%), Asia (320 | 1.3%), and Eastern Europe (317 | 1.3%), together accounting for 9.6% of all Sebastian residents.
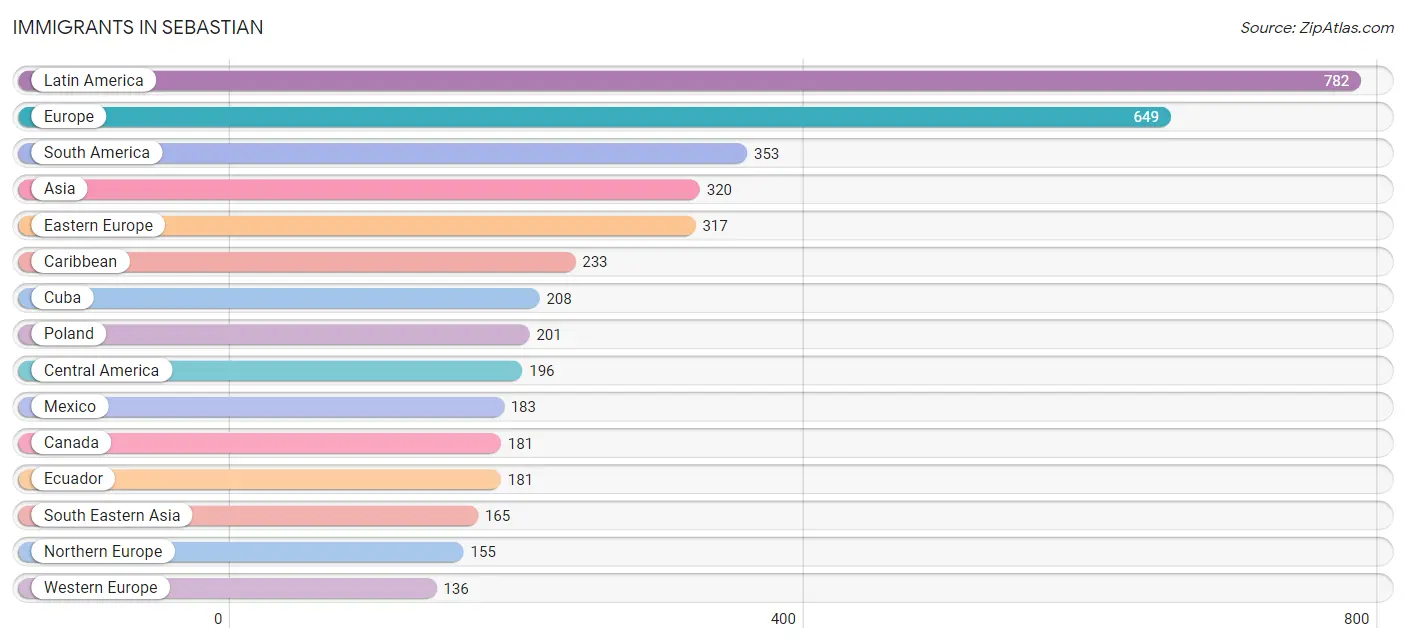
| Immigration Origin | # Population | % Population |
| Argentina | 21 | 0.1% |
| Asia | 320 | 1.3% |
| Brazil | 73 | 0.3% |
| Canada | 181 | 0.7% |
| Caribbean | 233 | 0.9% |
| Central America | 196 | 0.8% |
| China | 40 | 0.2% |
| Colombia | 63 | 0.3% |
| Cuba | 208 | 0.8% |
| Dominican Republic | 14 | 0.1% |
| Eastern Asia | 89 | 0.4% |
| Eastern Europe | 317 | 1.3% |
| Ecuador | 181 | 0.7% |
| England | 86 | 0.3% |
| Europe | 649 | 2.6% |
| Germany | 123 | 0.5% |
| India | 25 | 0.1% |
| Iraq | 41 | 0.2% |
| Ireland | 1 | 0.0% |
| Italy | 41 | 0.2% |
| Japan | 49 | 0.2% |
| Latin America | 782 | 3.1% |
| Mexico | 183 | 0.7% |
| Nicaragua | 13 | 0.1% |
| Northern Europe | 155 | 0.6% |
| Peru | 15 | 0.1% |
| Philippines | 34 | 0.1% |
| Poland | 201 | 0.8% |
| Scotland | 49 | 0.2% |
| South America | 353 | 1.4% |
| South Central Asia | 25 | 0.1% |
| South Eastern Asia | 165 | 0.6% |
| Southern Europe | 41 | 0.2% |
| St. Vincent and the Grenadines | 11 | 0.0% |
| Switzerland | 13 | 0.1% |
| Thailand | 117 | 0.5% |
| Ukraine | 17 | 0.1% |
| Vietnam | 14 | 0.1% |
| Western Asia | 41 | 0.2% |
| Western Europe | 136 | 0.5% | View All 40 Rows |
Sex and Age in Sebastian
Sex and Age in Sebastian
The most populous age groups in Sebastian are 65 to 69 Years (1,321 | 10.7%) for men and 65 to 69 Years (1,595 | 12.4%) for women.
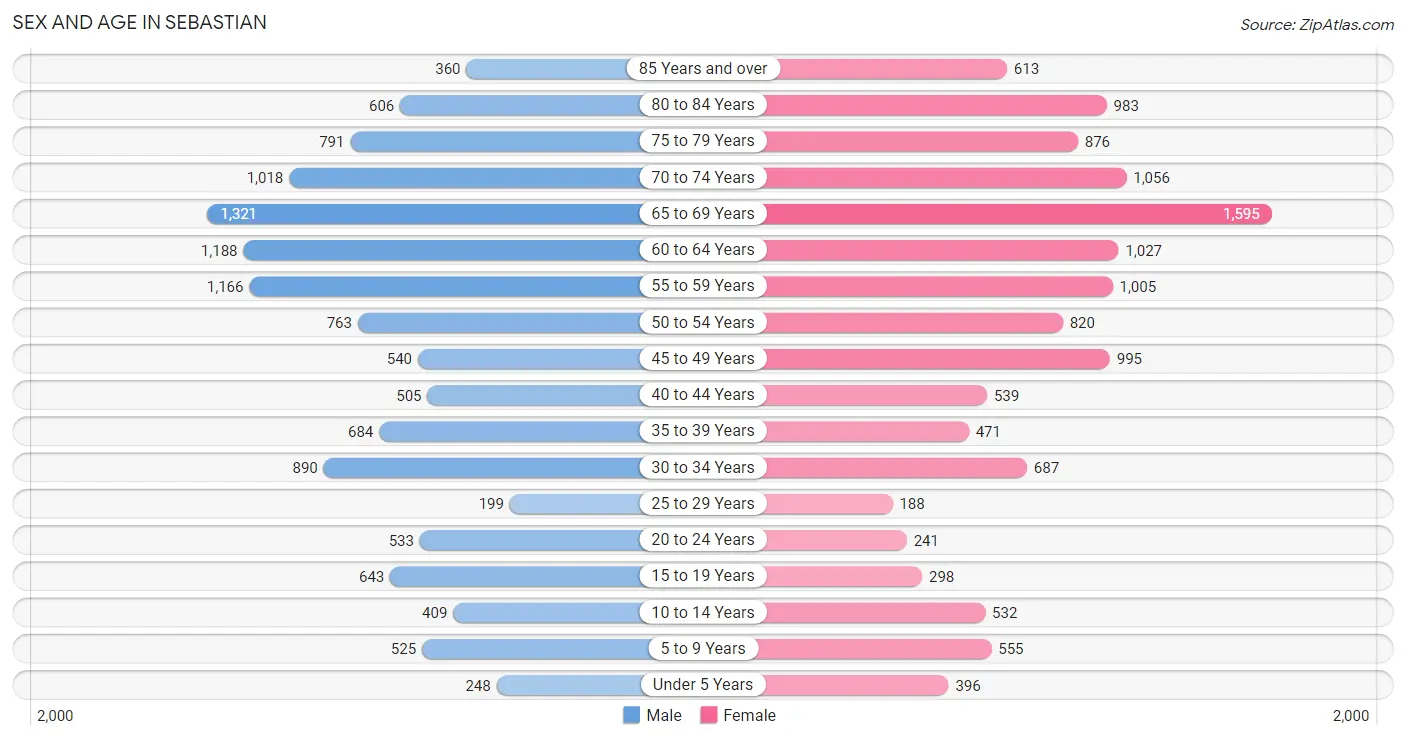
| Age Bracket | Male | Female |
| Under 5 Years | 248 (2.0%) | 396 (3.1%) |
| 5 to 9 Years | 525 (4.2%) | 555 (4.3%) |
| 10 to 14 Years | 409 (3.3%) | 532 (4.1%) |
| 15 to 19 Years | 643 (5.2%) | 298 (2.3%) |
| 20 to 24 Years | 533 (4.3%) | 241 (1.9%) |
| 25 to 29 Years | 199 (1.6%) | 188 (1.5%) |
| 30 to 34 Years | 890 (7.2%) | 687 (5.3%) |
| 35 to 39 Years | 684 (5.5%) | 471 (3.7%) |
| 40 to 44 Years | 505 (4.1%) | 539 (4.2%) |
| 45 to 49 Years | 540 (4.4%) | 995 (7.7%) |
| 50 to 54 Years | 763 (6.2%) | 820 (6.4%) |
| 55 to 59 Years | 1,166 (9.4%) | 1,005 (7.8%) |
| 60 to 64 Years | 1,188 (9.6%) | 1,027 (8.0%) |
| 65 to 69 Years | 1,321 (10.7%) | 1,595 (12.4%) |
| 70 to 74 Years | 1,018 (8.2%) | 1,056 (8.2%) |
| 75 to 79 Years | 791 (6.4%) | 876 (6.8%) |
| 80 to 84 Years | 606 (4.9%) | 983 (7.6%) |
| 85 Years and over | 360 (2.9%) | 613 (4.8%) |
| Total | 12,389 (100.0%) | 12,877 (100.0%) |
Families and Households in Sebastian
Median Family Size in Sebastian
The median family size in Sebastian is 2.84 persons per family, with single female/mother families (662 | 9.3%) accounting for the largest median family size of 3.64 persons per family. On the other hand, married-couple families (5,972 | 84.0%) represent the smallest median family size with 2.72 persons per family.
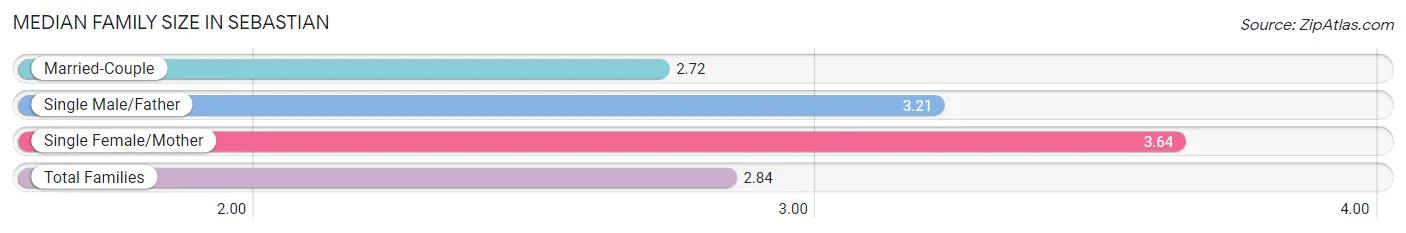
| Family Type | # Families | Family Size |
| Married-Couple | 5,972 (84.0%) | 2.72 |
| Single Male/Father | 476 (6.7%) | 3.21 |
| Single Female/Mother | 662 (9.3%) | 3.64 |
| Total Families | 7,110 (100.0%) | 2.84 |
Median Household Size in Sebastian
The median household size in Sebastian is 2.31 persons per household, with single female/mother households (662 | 6.0%) accounting for the largest median household size of 4.09 persons per household. non-family households (3,836 | 35.0%) represent the smallest median household size with 1.12 persons per household.
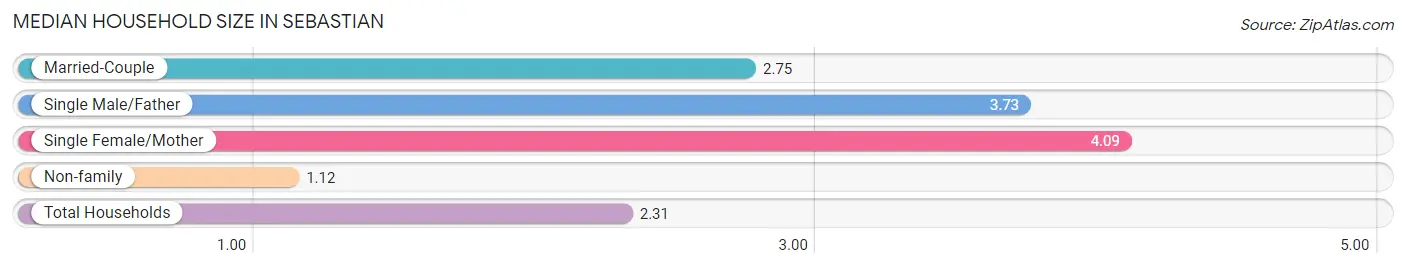
| Household Type | # Households | Household Size |
| Married-Couple | 5,972 (54.6%) | 2.75 |
| Single Male/Father | 476 (4.3%) | 3.73 |
| Single Female/Mother | 662 (6.0%) | 4.09 |
| Non-family | 3,836 (35.0%) | 1.12 |
| Total Households | 10,946 (100.0%) | 2.31 |
Household Size by Marriage Status in Sebastian
Out of a total of 10,946 households in Sebastian, 7,110 (65.0%) are family households, while 3,836 (35.0%) are nonfamily households. The most numerous type of family households are 2-person households, comprising 4,932, and the most common type of nonfamily households are 1-person households, comprising 3,467.
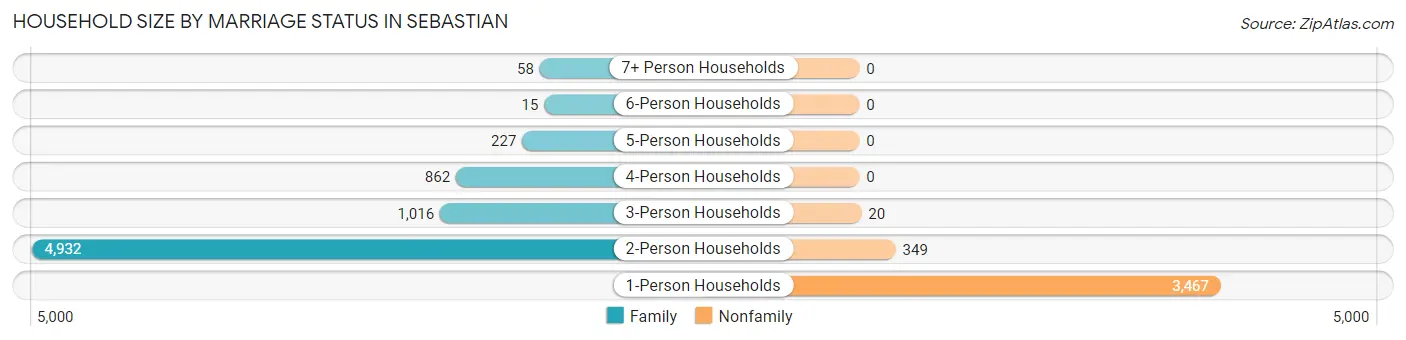
| Household Size | Family Households | Nonfamily Households |
| 1-Person Households | - | 3,467 (31.7%) |
| 2-Person Households | 4,932 (45.1%) | 349 (3.2%) |
| 3-Person Households | 1,016 (9.3%) | 20 (0.2%) |
| 4-Person Households | 862 (7.9%) | 0 (0.0%) |
| 5-Person Households | 227 (2.1%) | 0 (0.0%) |
| 6-Person Households | 15 (0.1%) | 0 (0.0%) |
| 7+ Person Households | 58 (0.5%) | 0 (0.0%) |
| Total | 7,110 (65.0%) | 3,836 (35.0%) |
Female Fertility in Sebastian
Fertility by Age in Sebastian
Average fertility rate in Sebastian is 28.0 births per 1,000 women. Women in the age bracket of 20 to 34 years have the highest fertility rate with 66.0 births per 1,000 women. Women in the age bracket of 20 to 34 years acount for 75.5% of all women with births.
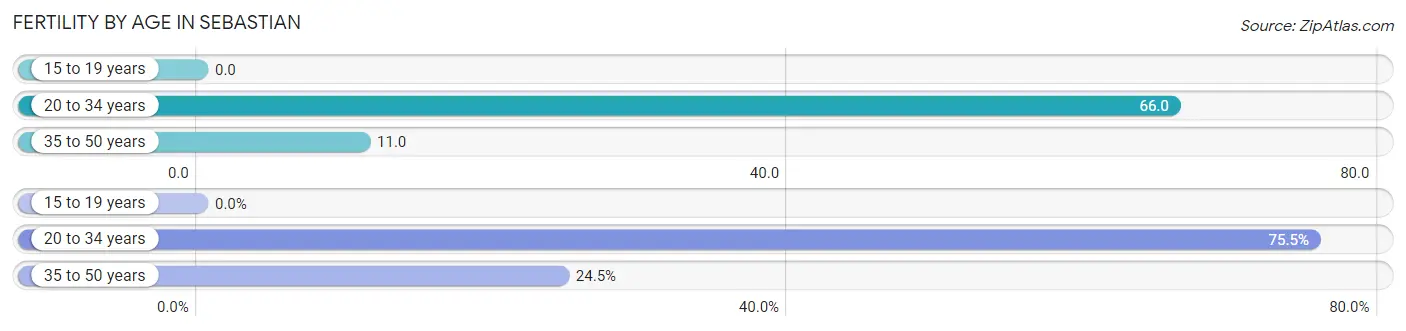
| Age Bracket | Women with Births | Births / 1,000 Women |
| 15 to 19 years | 0 (0.0%) | 0.0 |
| 20 to 34 years | 74 (75.5%) | 66.0 |
| 35 to 50 years | 24 (24.5%) | 11.0 |
| Total | 98 (100.0%) | 28.0 |
Fertility by Age by Marriage Status in Sebastian
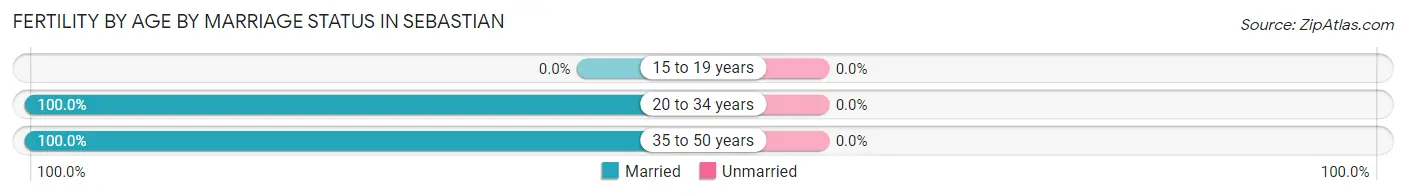
| Age Bracket | Married | Unmarried |
| 15 to 19 years | 0 (0.0%) | 0 (0.0%) |
| 20 to 34 years | 74 (100.0%) | 0 (0.0%) |
| 35 to 50 years | 24 (100.0%) | 0 (0.0%) |
| Total | 98 (100.0%) | 0 (0.0%) |
Fertility by Education in Sebastian
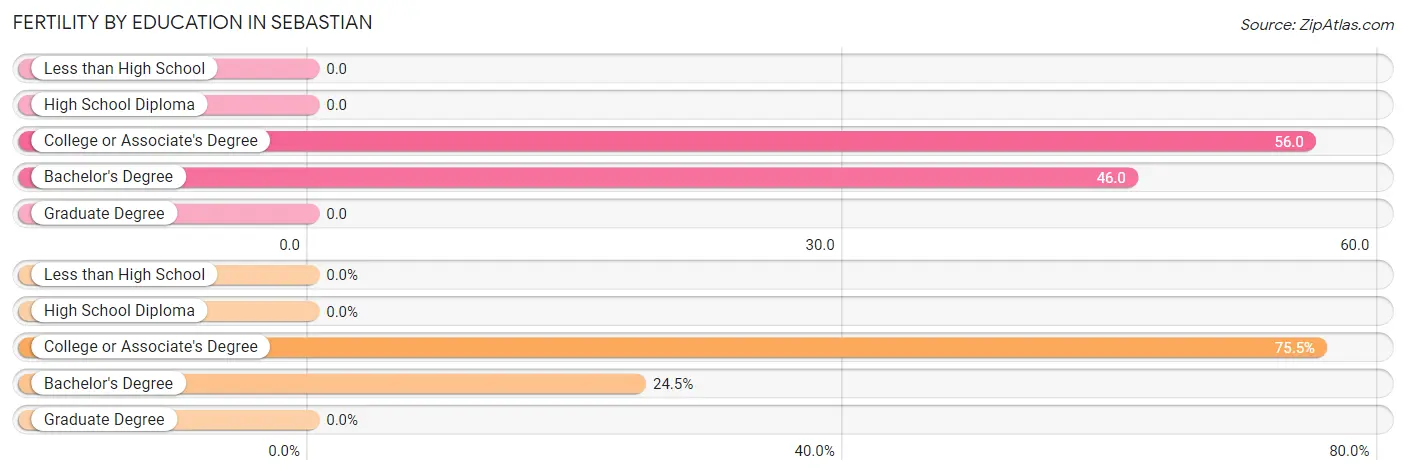
| Educational Attainment | Women with Births | Births / 1,000 Women |
| Less than High School | 0 (0.0%) | 0.0 |
| High School Diploma | 0 (0.0%) | 0.0 |
| College or Associate's Degree | 74 (75.5%) | 56.0 |
| Bachelor's Degree | 24 (24.5%) | 46.0 |
| Graduate Degree | 0 (0.0%) | 0.0 |
| Total | 98 (100.0%) | 28.0 |
Fertility by Education by Marriage Status in Sebastian
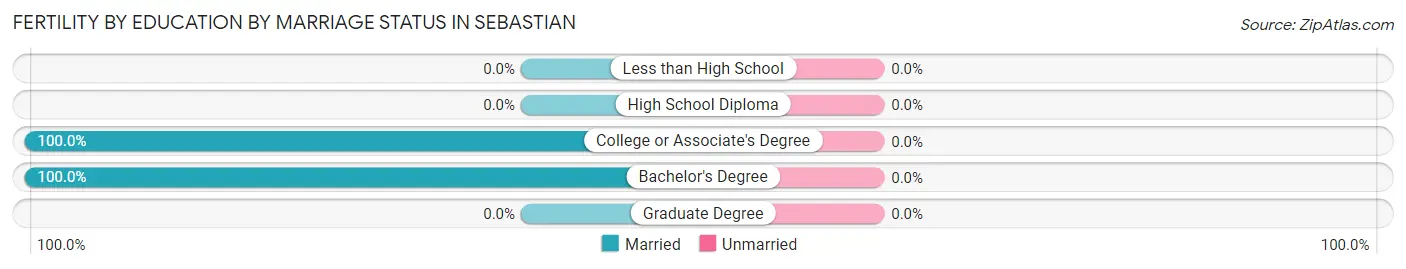
| Educational Attainment | Married | Unmarried |
| Less than High School | 0 (0.0%) | 0 (0.0%) |
| High School Diploma | 0 (0.0%) | 0 (0.0%) |
| College or Associate's Degree | 74 (100.0%) | 0 (0.0%) |
| Bachelor's Degree | 24 (100.0%) | 0 (0.0%) |
| Graduate Degree | 0 (0.0%) | 0 (0.0%) |
| Total | 98 (100.0%) | 0 (0.0%) |
Employment Characteristics in Sebastian
Employment by Class of Employer in Sebastian
Among the 9,489 employed individuals in Sebastian, private company employees (6,026 | 63.5%), not-for-profit organizations (824 | 8.7%), and local government employees (804 | 8.5%) make up the most common classes of employment.
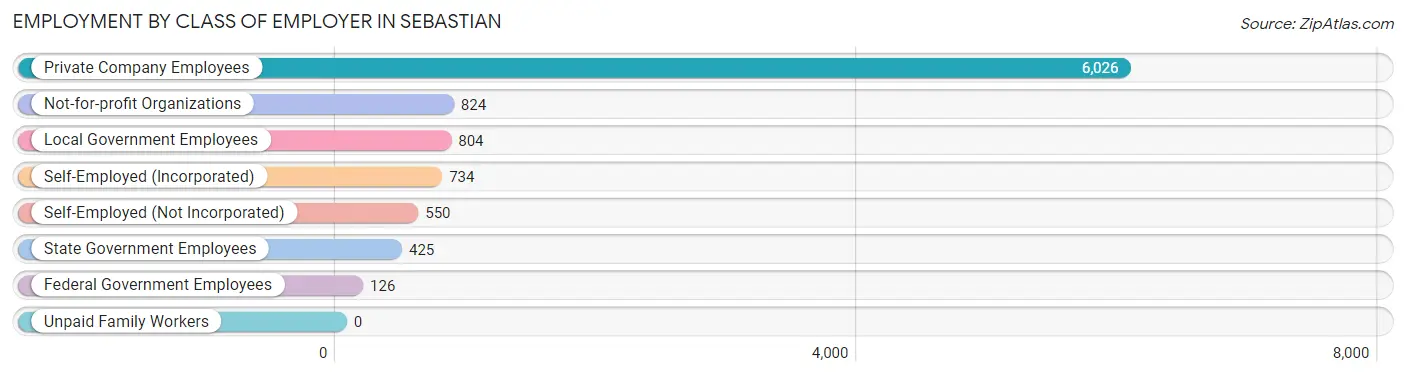
| Employer Class | # Employees | % Employees |
| Private Company Employees | 6,026 | 63.5% |
| Self-Employed (Incorporated) | 734 | 7.7% |
| Self-Employed (Not Incorporated) | 550 | 5.8% |
| Not-for-profit Organizations | 824 | 8.7% |
| Local Government Employees | 804 | 8.5% |
| State Government Employees | 425 | 4.5% |
| Federal Government Employees | 126 | 1.3% |
| Unpaid Family Workers | 0 | 0.0% |
| Total | 9,489 | 100.0% |
Employment Status by Age in Sebastian
According to the labor force statistics for Sebastian, out of the total population over 16 years of age (22,347), 47.8% or 10,682 individuals are in the labor force, with 9.6% or 1,025 of them unemployed. The age group with the highest labor force participation rate is 35 to 44 years, with 86.0% or 1,891 individuals in the labor force. Within the labor force, the 30 to 34 years age range has the highest percentage of unemployed individuals, with 17.6% or 228 of them being unemployed.
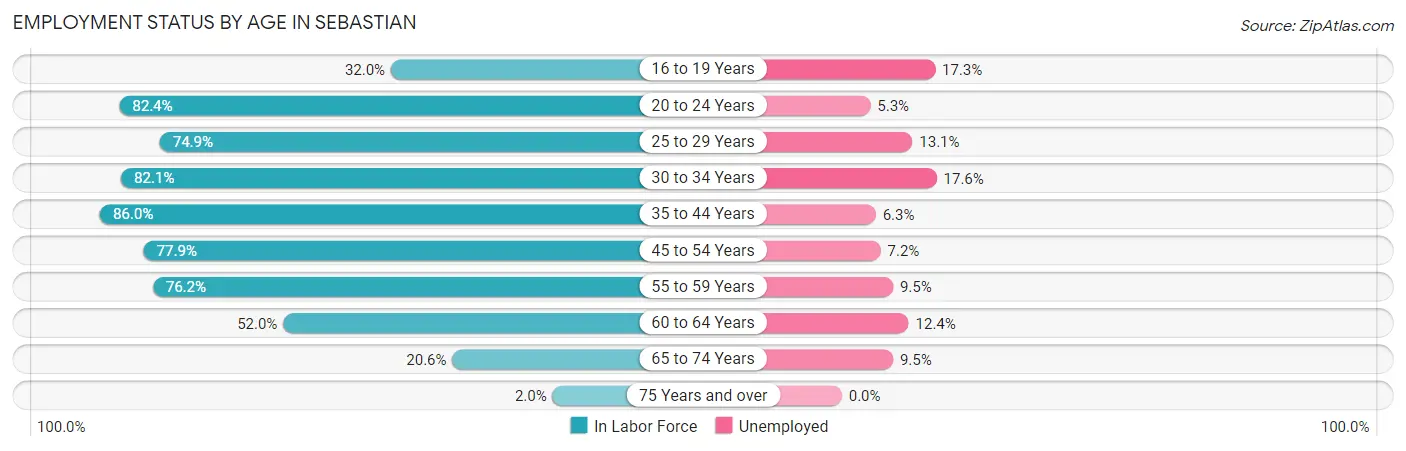
| Age Bracket | In Labor Force | Unemployed |
| 16 to 19 Years | 220 (32.0%) | 38 (17.3%) |
| 20 to 24 Years | 638 (82.4%) | 34 (5.3%) |
| 25 to 29 Years | 290 (74.9%) | 38 (13.1%) |
| 30 to 34 Years | 1,295 (82.1%) | 228 (17.6%) |
| 35 to 44 Years | 1,891 (86.0%) | 119 (6.3%) |
| 45 to 54 Years | 2,429 (77.9%) | 175 (7.2%) |
| 55 to 59 Years | 1,654 (76.2%) | 157 (9.5%) |
| 60 to 64 Years | 1,152 (52.0%) | 143 (12.4%) |
| 65 to 74 Years | 1,028 (20.6%) | 98 (9.5%) |
| 75 Years and over | 85 (2.0%) | 0 (0.0%) |
| Total | 10,682 (47.8%) | 1,025 (9.6%) |
Employment Status by Educational Attainment in Sebastian
According to labor force statistics for Sebastian, 74.6% of individuals (8,704) out of the total population between 25 and 64 years of age (11,667) are in the labor force, with 9.9% or 862 of them being unemployed. The group with the highest labor force participation rate are those with the educational attainment of bachelor's degree or higher, with 82.4% or 3,064 individuals in the labor force. Within the labor force, individuals with less than high school education have the highest percentage of unemployment, with 21.4% or 123 of them being unemployed.
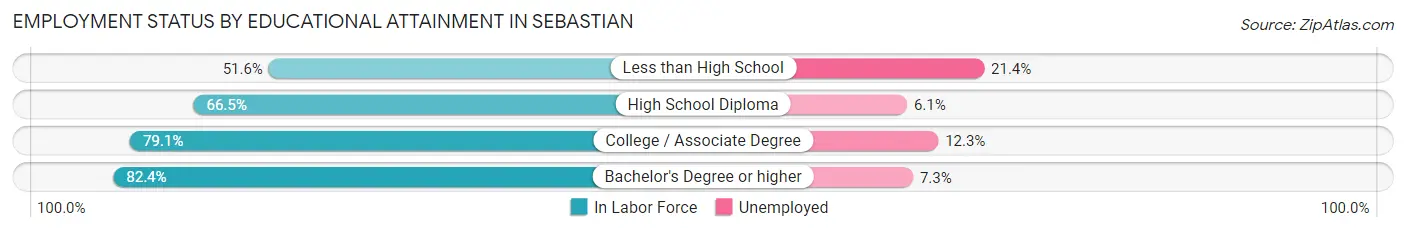
| Educational Attainment | In Labor Force | Unemployed |
| Less than High School | 575 (51.6%) | 238 (21.4%) |
| High School Diploma | 1,783 (66.5%) | 164 (6.1%) |
| College / Associate Degree | 3,285 (79.1%) | 511 (12.3%) |
| Bachelor's Degree or higher | 3,064 (82.4%) | 271 (7.3%) |
| Total | 8,704 (74.6%) | 1,155 (9.9%) |
Employment Occupations by Sex in Sebastian
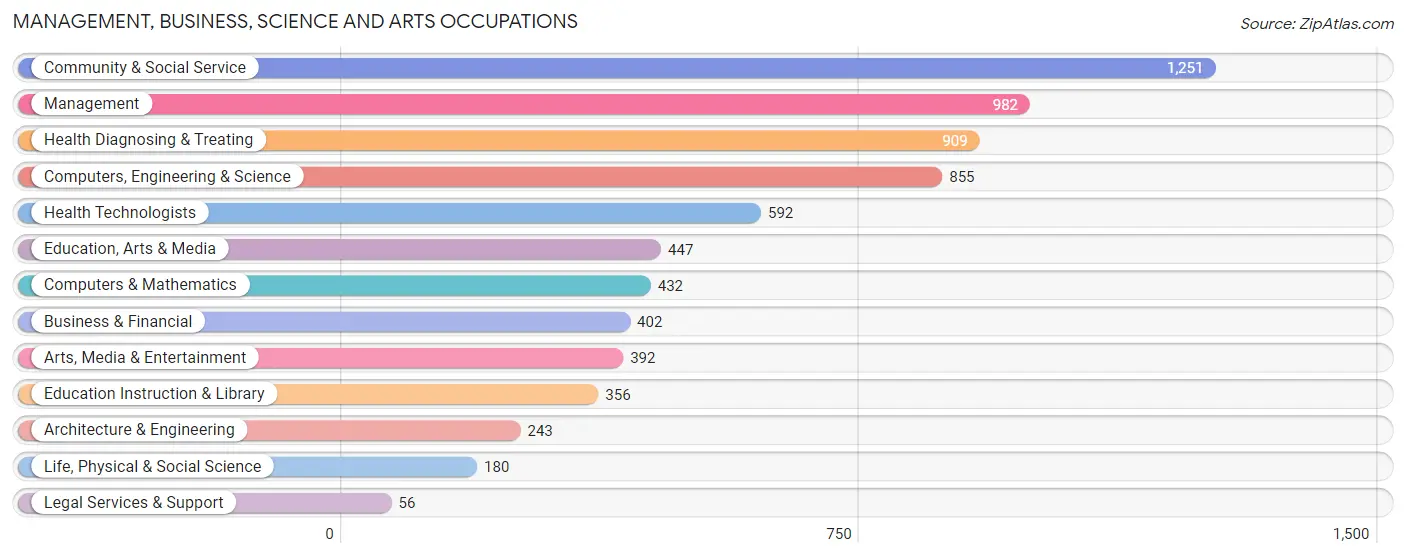
Management, Business, Science and Arts Occupations
The most common Management, Business, Science and Arts occupations in Sebastian are Community & Social Service (1,251 | 13.0%), Management (982 | 10.2%), Health Diagnosing & Treating (909 | 9.4%), Computers, Engineering & Science (855 | 8.9%), and Health Technologists (592 | 6.1%).
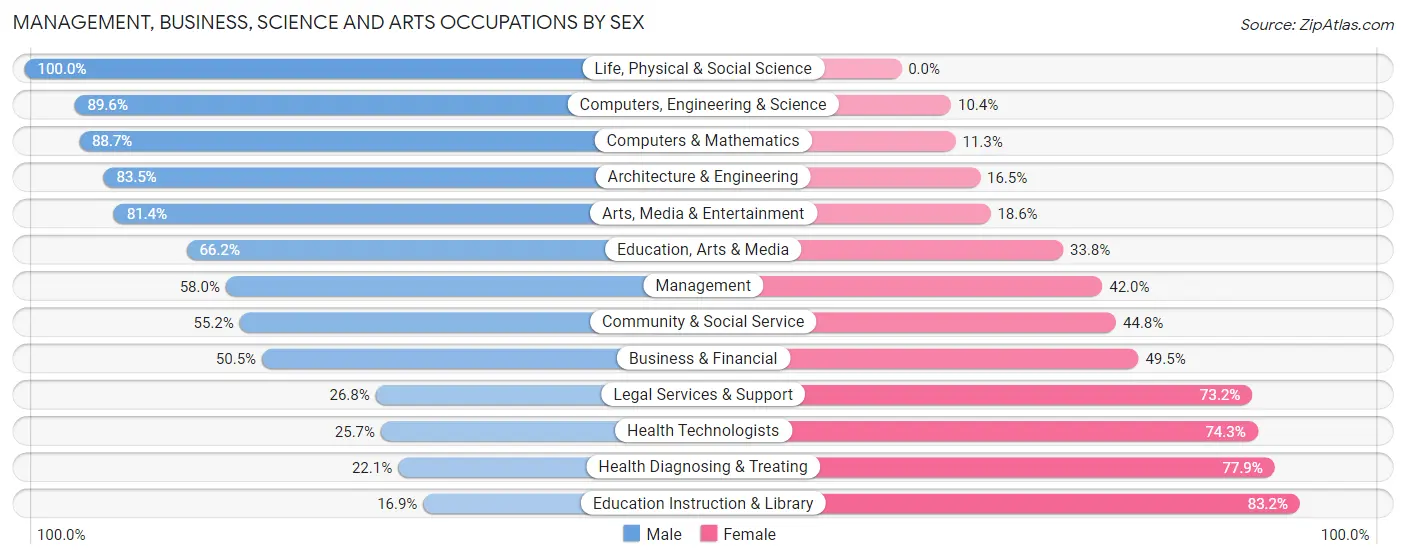
Management, Business, Science and Arts Occupations by Sex
Within the Management, Business, Science and Arts occupations in Sebastian, the most male-oriented occupations are Life, Physical & Social Science (100.0%), Computers, Engineering & Science (89.6%), and Computers & Mathematics (88.7%), while the most female-oriented occupations are Education Instruction & Library (83.2%), Health Diagnosing & Treating (77.9%), and Health Technologists (74.3%).
| Occupation | Male | Female |
| Management | 570 (58.0%) | 412 (42.0%) |
| Business & Financial | 203 (50.5%) | 199 (49.5%) |
| Computers, Engineering & Science | 766 (89.6%) | 89 (10.4%) |
| Computers & Mathematics | 383 (88.7%) | 49 (11.3%) |
| Architecture & Engineering | 203 (83.5%) | 40 (16.5%) |
| Life, Physical & Social Science | 180 (100.0%) | 0 (0.0%) |
| Community & Social Service | 690 (55.2%) | 561 (44.8%) |
| Education, Arts & Media | 296 (66.2%) | 151 (33.8%) |
| Legal Services & Support | 15 (26.8%) | 41 (73.2%) |
| Education Instruction & Library | 60 (16.9%) | 296 (83.2%) |
| Arts, Media & Entertainment | 319 (81.4%) | 73 (18.6%) |
| Health Diagnosing & Treating | 201 (22.1%) | 708 (77.9%) |
| Health Technologists | 152 (25.7%) | 440 (74.3%) |
| Total (Category) | 2,430 (55.2%) | 1,969 (44.8%) |
| Total (Overall) | 5,448 (56.5%) | 4,201 (43.5%) |
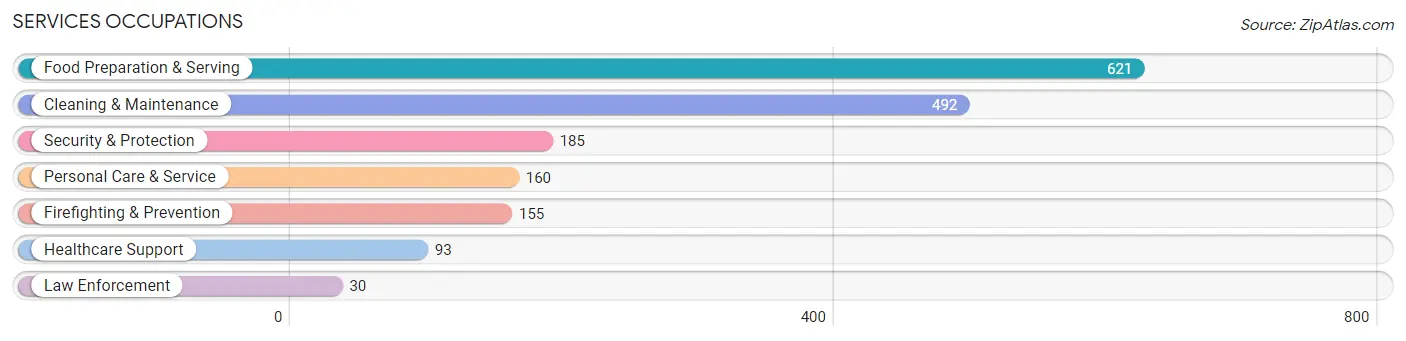
Services Occupations
The most common Services occupations in Sebastian are Food Preparation & Serving (621 | 6.4%), Cleaning & Maintenance (492 | 5.1%), Security & Protection (185 | 1.9%), Personal Care & Service (160 | 1.7%), and Firefighting & Prevention (155 | 1.6%).
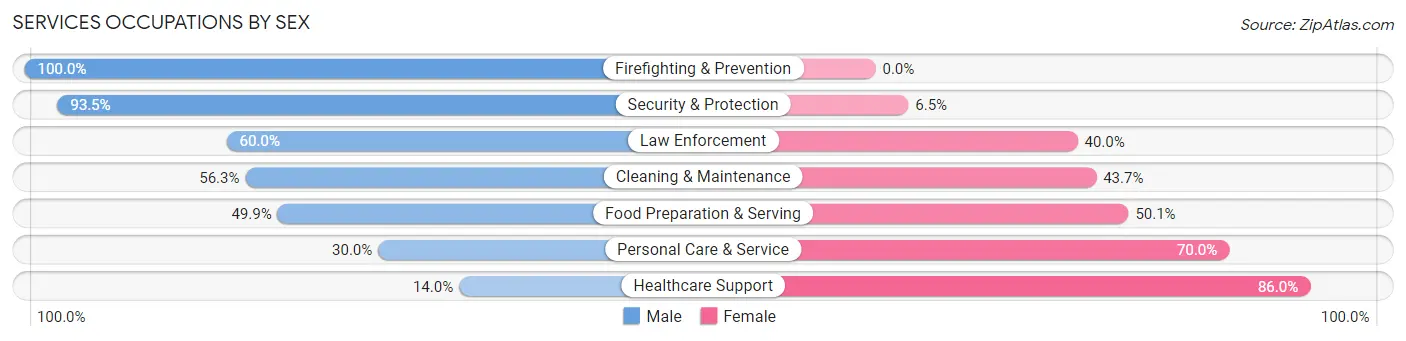
Services Occupations by Sex
Within the Services occupations in Sebastian, the most male-oriented occupations are Firefighting & Prevention (100.0%), Security & Protection (93.5%), and Law Enforcement (60.0%), while the most female-oriented occupations are Healthcare Support (86.0%), Personal Care & Service (70.0%), and Food Preparation & Serving (50.1%).
| Occupation | Male | Female |
| Healthcare Support | 13 (14.0%) | 80 (86.0%) |
| Security & Protection | 173 (93.5%) | 12 (6.5%) |
| Firefighting & Prevention | 155 (100.0%) | 0 (0.0%) |
| Law Enforcement | 18 (60.0%) | 12 (40.0%) |
| Food Preparation & Serving | 310 (49.9%) | 311 (50.1%) |
| Cleaning & Maintenance | 277 (56.3%) | 215 (43.7%) |
| Personal Care & Service | 48 (30.0%) | 112 (70.0%) |
| Total (Category) | 821 (52.9%) | 730 (47.1%) |
| Total (Overall) | 5,448 (56.5%) | 4,201 (43.5%) |
Sales and Office Occupations
The most common Sales and Office occupations in Sebastian are Office & Administration (1,215 | 12.6%), and Sales & Related (957 | 9.9%).
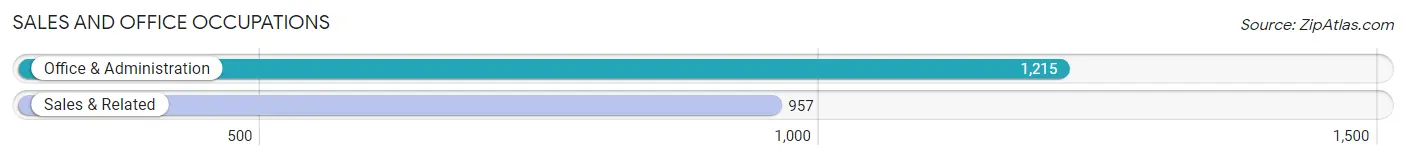
Sales and Office Occupations by Sex
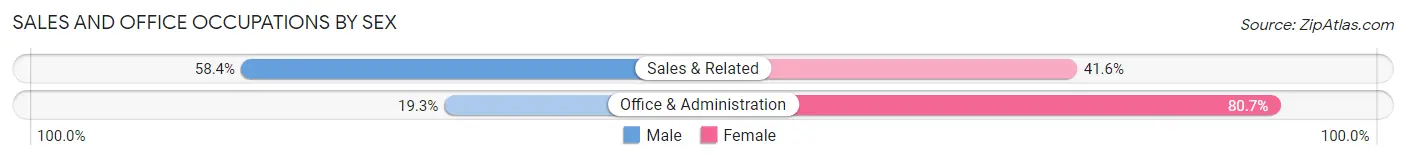
| Occupation | Male | Female |
| Sales & Related | 559 (58.4%) | 398 (41.6%) |
| Office & Administration | 235 (19.3%) | 980 (80.7%) |
| Total (Category) | 794 (36.6%) | 1,378 (63.4%) |
| Total (Overall) | 5,448 (56.5%) | 4,201 (43.5%) |
Natural Resources, Construction and Maintenance Occupations
The most common Natural Resources, Construction and Maintenance occupations in Sebastian are Installation, Maintenance & Repair (537 | 5.6%), Construction & Extraction (377 | 3.9%), and Farming, Fishing & Forestry (18 | 0.2%).
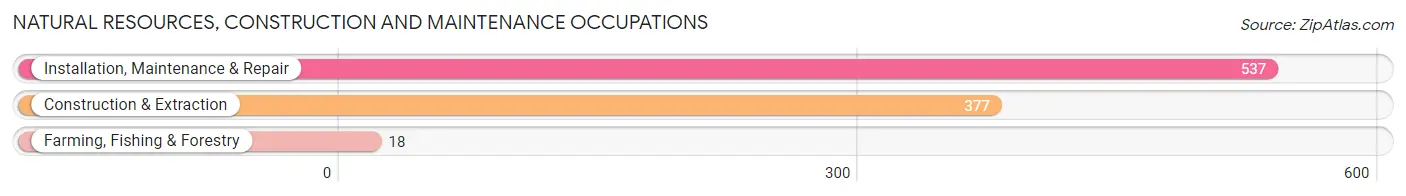
Natural Resources, Construction and Maintenance Occupations by Sex
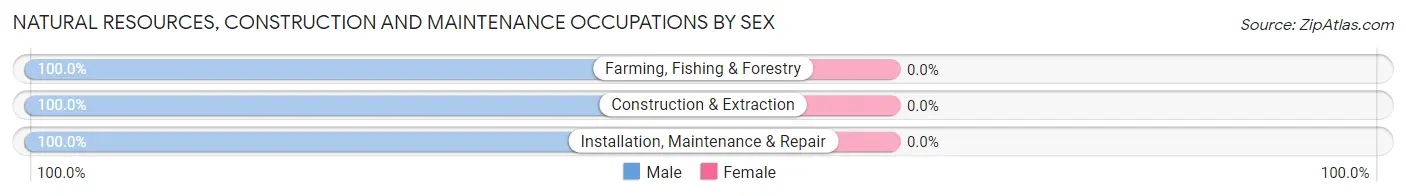
| Occupation | Male | Female |
| Farming, Fishing & Forestry | 18 (100.0%) | 0 (0.0%) |
| Construction & Extraction | 377 (100.0%) | 0 (0.0%) |
| Installation, Maintenance & Repair | 537 (100.0%) | 0 (0.0%) |
| Total (Category) | 932 (100.0%) | 0 (0.0%) |
| Total (Overall) | 5,448 (56.5%) | 4,201 (43.5%) |
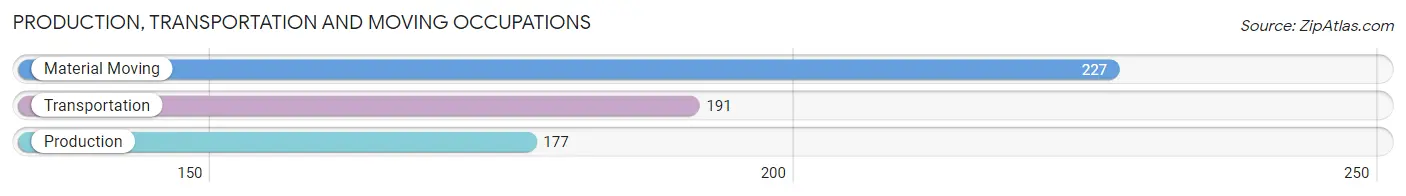
Production, Transportation and Moving Occupations
The most common Production, Transportation and Moving occupations in Sebastian are Material Moving (227 | 2.4%), Transportation (191 | 2.0%), and Production (177 | 1.8%).
Production, Transportation and Moving Occupations by Sex
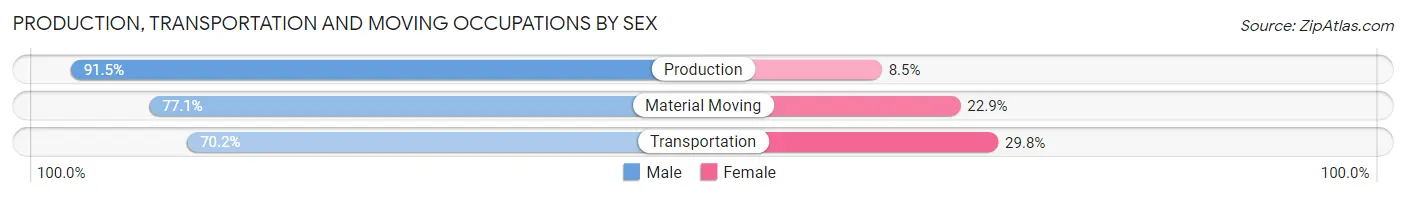
| Occupation | Male | Female |
| Production | 162 (91.5%) | 15 (8.5%) |
| Transportation | 134 (70.2%) | 57 (29.8%) |
| Material Moving | 175 (77.1%) | 52 (22.9%) |
| Total (Category) | 471 (79.2%) | 124 (20.8%) |
| Total (Overall) | 5,448 (56.5%) | 4,201 (43.5%) |
Employment Industries by Sex in Sebastian
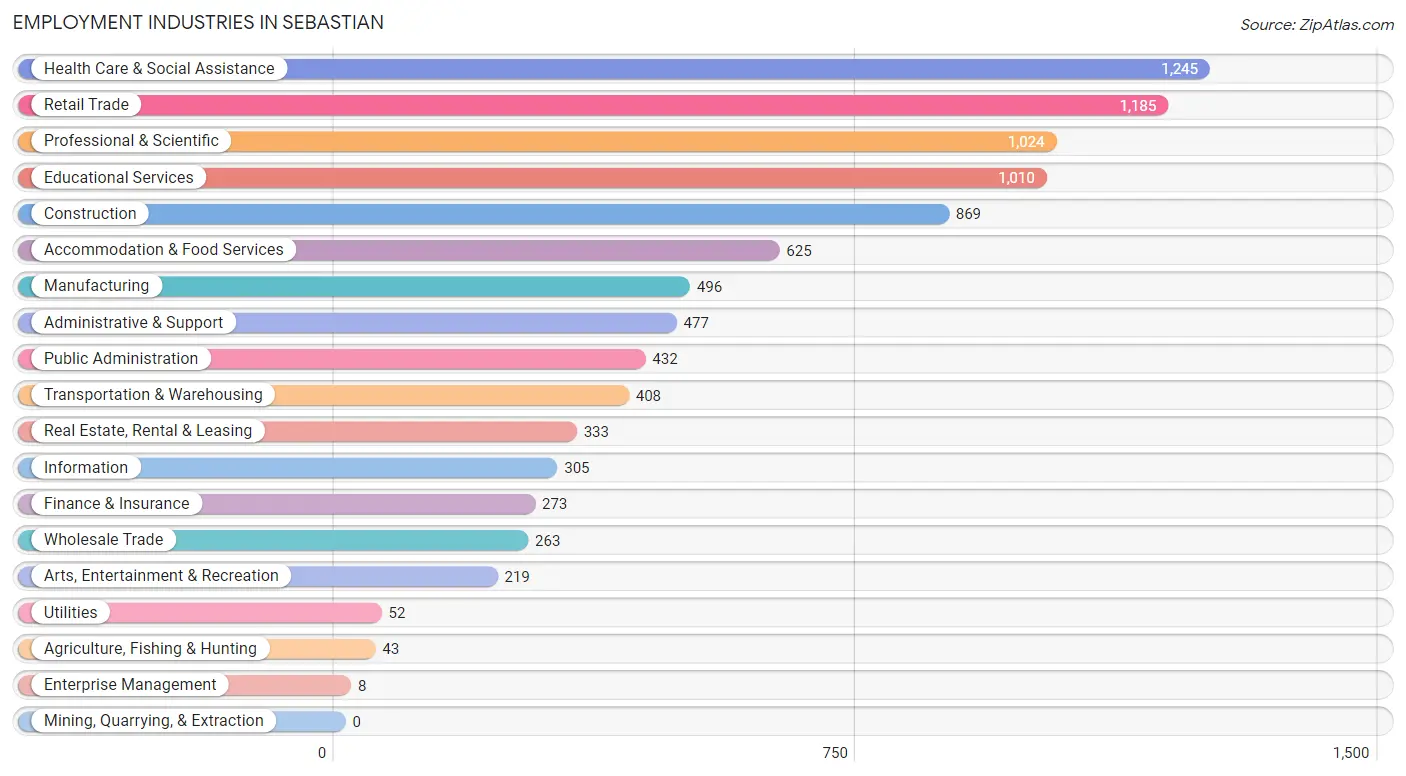
Employment Industries in Sebastian
The major employment industries in Sebastian include Health Care & Social Assistance (1,245 | 12.9%), Retail Trade (1,185 | 12.3%), Professional & Scientific (1,024 | 10.6%), Educational Services (1,010 | 10.5%), and Construction (869 | 9.0%).
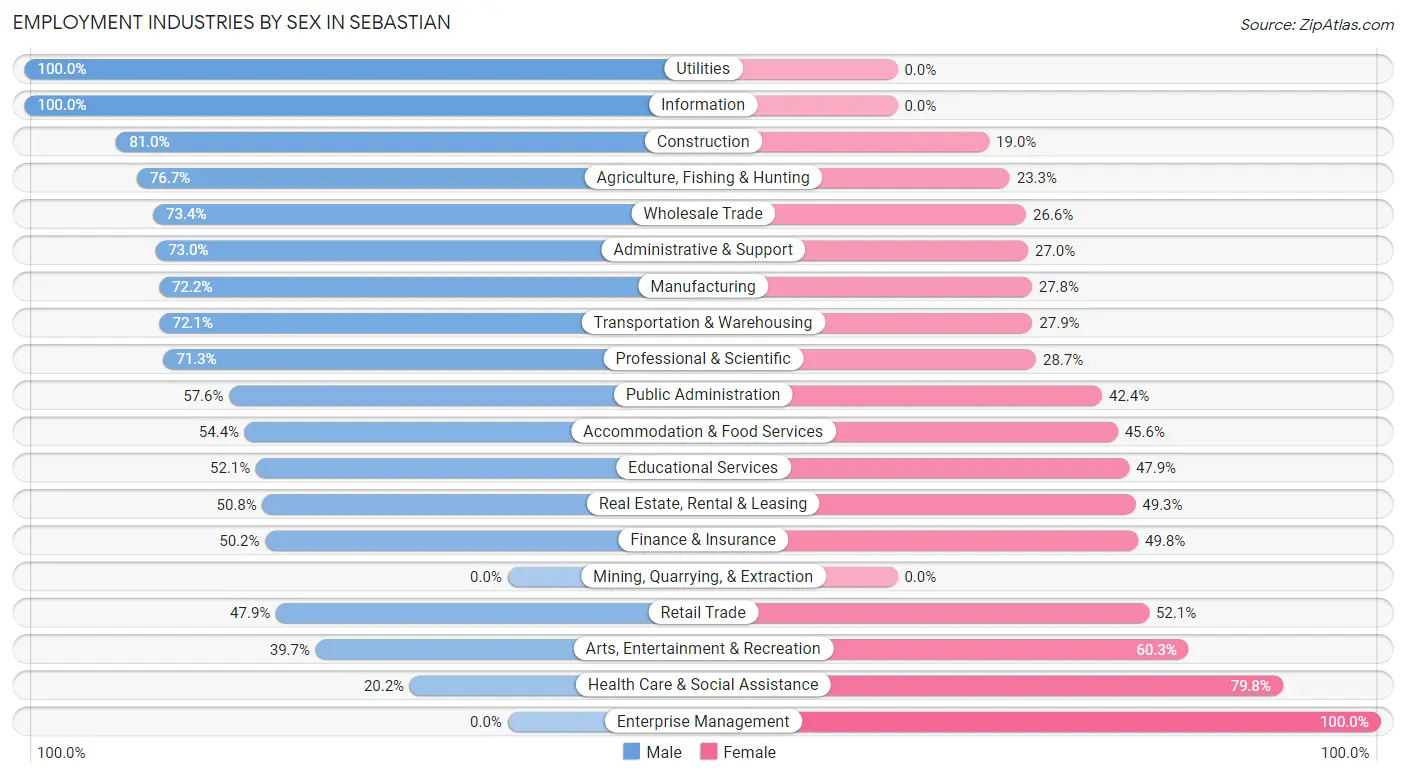
Employment Industries by Sex in Sebastian
The Sebastian industries that see more men than women are Utilities (100.0%), Information (100.0%), and Construction (81.0%), whereas the industries that tend to have a higher number of women are Enterprise Management (100.0%), Health Care & Social Assistance (79.8%), and Arts, Entertainment & Recreation (60.3%).
| Industry | Male | Female |
| Agriculture, Fishing & Hunting | 33 (76.7%) | 10 (23.3%) |
| Mining, Quarrying, & Extraction | 0 (0.0%) | 0 (0.0%) |
| Construction | 704 (81.0%) | 165 (19.0%) |
| Manufacturing | 358 (72.2%) | 138 (27.8%) |
| Wholesale Trade | 193 (73.4%) | 70 (26.6%) |
| Retail Trade | 568 (47.9%) | 617 (52.1%) |
| Transportation & Warehousing | 294 (72.1%) | 114 (27.9%) |
| Utilities | 52 (100.0%) | 0 (0.0%) |
| Information | 305 (100.0%) | 0 (0.0%) |
| Finance & Insurance | 137 (50.2%) | 136 (49.8%) |
| Real Estate, Rental & Leasing | 169 (50.7%) | 164 (49.2%) |
| Professional & Scientific | 730 (71.3%) | 294 (28.7%) |
| Enterprise Management | 0 (0.0%) | 8 (100.0%) |
| Administrative & Support | 348 (73.0%) | 129 (27.0%) |
| Educational Services | 526 (52.1%) | 484 (47.9%) |
| Health Care & Social Assistance | 252 (20.2%) | 993 (79.8%) |
| Arts, Entertainment & Recreation | 87 (39.7%) | 132 (60.3%) |
| Accommodation & Food Services | 340 (54.4%) | 285 (45.6%) |
| Public Administration | 249 (57.6%) | 183 (42.4%) |
| Total | 5,448 (56.5%) | 4,201 (43.5%) |
Education in Sebastian
School Enrollment in Sebastian
The most common levels of schooling among the 3,857 students in Sebastian are elementary school (902 | 23.4%), high school (854 | 22.1%), and middle school (778 | 20.2%).
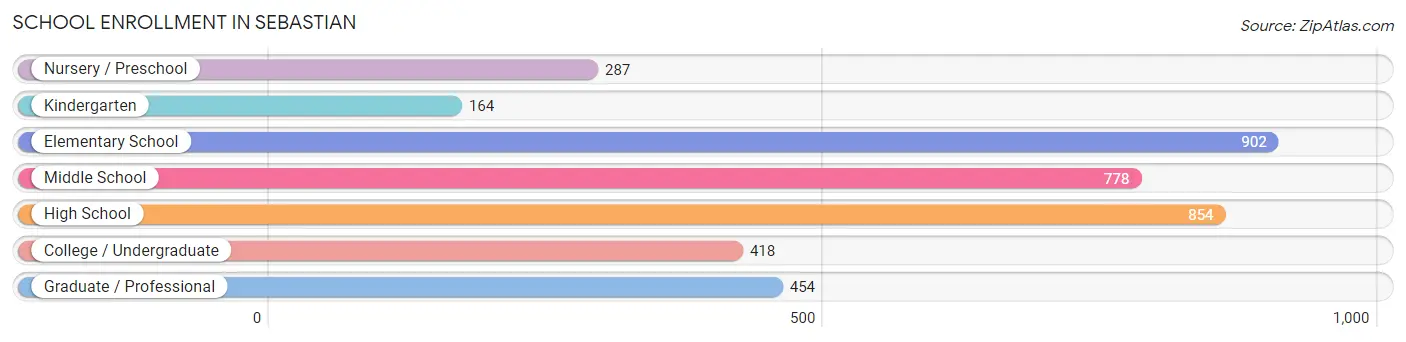
| School Level | # Students | % Students |
| Nursery / Preschool | 287 | 7.4% |
| Kindergarten | 164 | 4.3% |
| Elementary School | 902 | 23.4% |
| Middle School | 778 | 20.2% |
| High School | 854 | 22.1% |
| College / Undergraduate | 418 | 10.8% |
| Graduate / Professional | 454 | 11.8% |
| Total | 3,857 | 100.0% |
School Enrollment by Age by Funding Source in Sebastian
Out of a total of 3,857 students who are enrolled in schools in Sebastian, 571 (14.8%) attend a private institution, while the remaining 3,286 (85.2%) are enrolled in public schools. The age group of 3 to 4 year olds has the highest likelihood of being enrolled in private schools, with 116 (52.2% in the age bracket) enrolled. Conversely, the age group of 20 to 24 year olds has the lowest likelihood of being enrolled in a private school, with 111 (100.0% in the age bracket) attending a public institution.
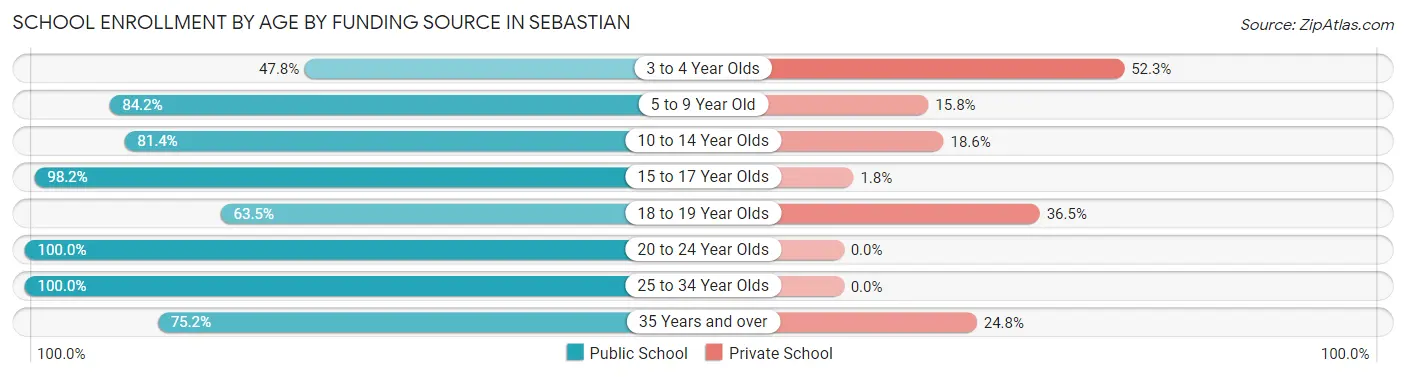
| Age Bracket | Public School | Private School |
| 3 to 4 Year Olds | 106 (47.7%) | 116 (52.2%) |
| 5 to 9 Year Old | 870 (84.2%) | 163 (15.8%) |
| 10 to 14 Year Olds | 766 (81.4%) | 175 (18.6%) |
| 15 to 17 Year Olds | 754 (98.2%) | 14 (1.8%) |
| 18 to 19 Year Olds | 73 (63.5%) | 42 (36.5%) |
| 20 to 24 Year Olds | 111 (100.0%) | 0 (0.0%) |
| 25 to 34 Year Olds | 417 (100.0%) | 0 (0.0%) |
| 35 Years and over | 188 (75.2%) | 62 (24.8%) |
| Total | 3,286 (85.2%) | 571 (14.8%) |
Educational Attainment by Field of Study in Sebastian
Business (1,334 | 19.5%), education (1,203 | 17.6%), social sciences (913 | 13.3%), science & technology (801 | 11.7%), and arts & humanities (501 | 7.3%) are the most common fields of study among 6,845 individuals in Sebastian who have obtained a bachelor's degree or higher.
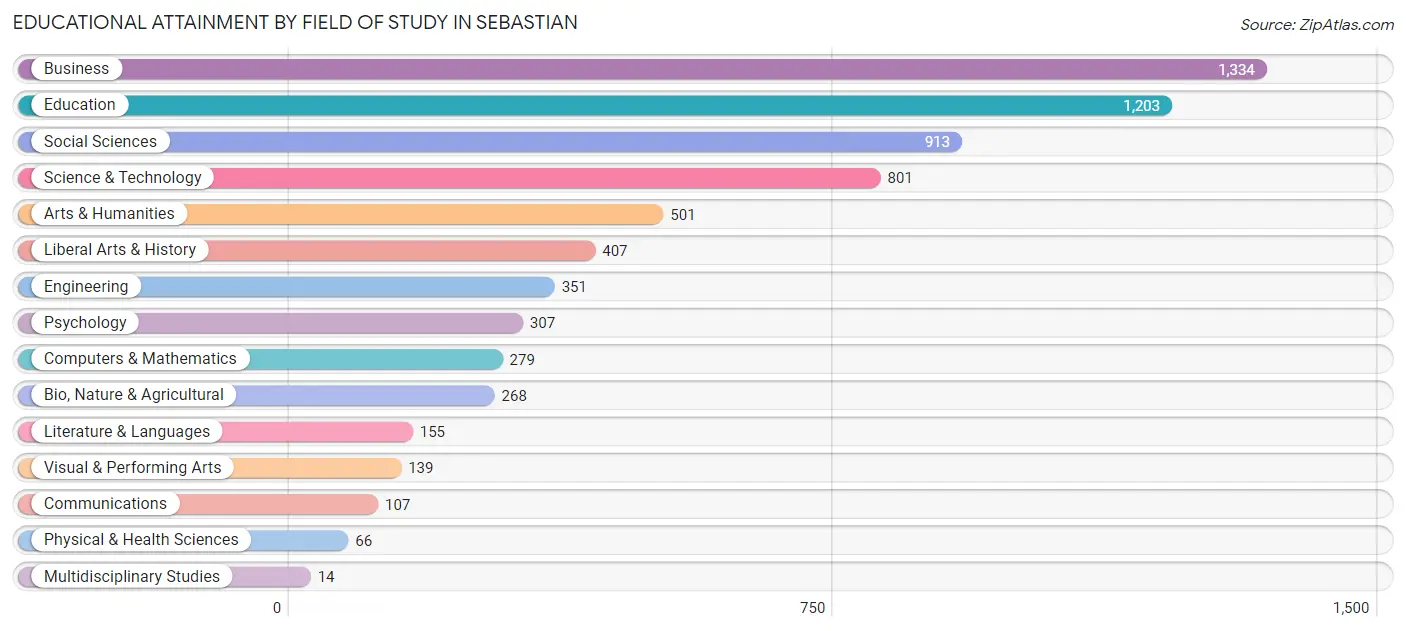
| Field of Study | # Graduates | % Graduates |
| Computers & Mathematics | 279 | 4.1% |
| Bio, Nature & Agricultural | 268 | 3.9% |
| Physical & Health Sciences | 66 | 1.0% |
| Psychology | 307 | 4.5% |
| Social Sciences | 913 | 13.3% |
| Engineering | 351 | 5.1% |
| Multidisciplinary Studies | 14 | 0.2% |
| Science & Technology | 801 | 11.7% |
| Business | 1,334 | 19.5% |
| Education | 1,203 | 17.6% |
| Literature & Languages | 155 | 2.3% |
| Liberal Arts & History | 407 | 5.9% |
| Visual & Performing Arts | 139 | 2.0% |
| Communications | 107 | 1.6% |
| Arts & Humanities | 501 | 7.3% |
| Total | 6,845 | 100.0% |
Transportation & Commute in Sebastian
Vehicle Availability by Sex in Sebastian
The most prevalent vehicle ownership categories in Sebastian are males with 2 vehicles (2,289, accounting for 42.2%) and females with 2 vehicles (2,275, making up 56.5%).
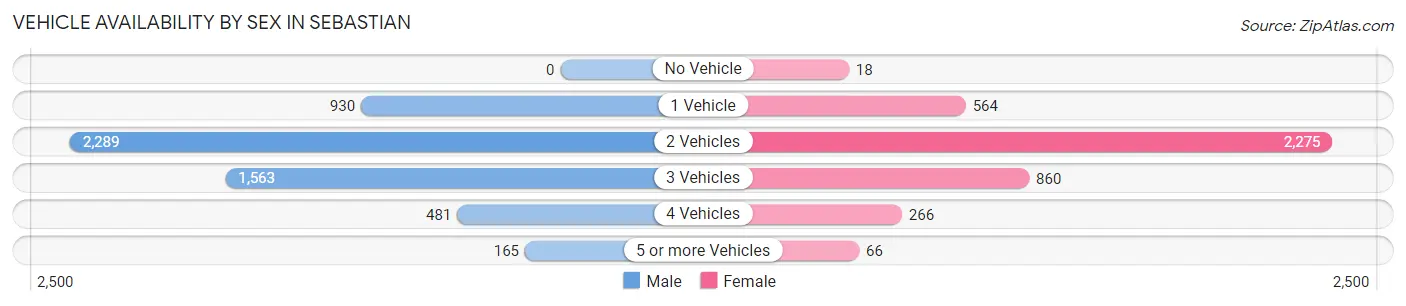
| Vehicles Available | Male | Female |
| No Vehicle | 0 (0.0%) | 18 (0.4%) |
| 1 Vehicle | 930 (17.1%) | 564 (13.9%) |
| 2 Vehicles | 2,289 (42.2%) | 2,275 (56.2%) |
| 3 Vehicles | 1,563 (28.8%) | 860 (21.2%) |
| 4 Vehicles | 481 (8.9%) | 266 (6.6%) |
| 5 or more Vehicles | 165 (3.0%) | 66 (1.6%) |
| Total | 5,428 (100.0%) | 4,049 (100.0%) |
Commute Time in Sebastian
The most frequently occuring commute durations in Sebastian are 20 to 24 minutes (1,456 commuters, 16.9%), 30 to 34 minutes (1,215 commuters, 14.1%), and 15 to 19 minutes (1,083 commuters, 12.6%).
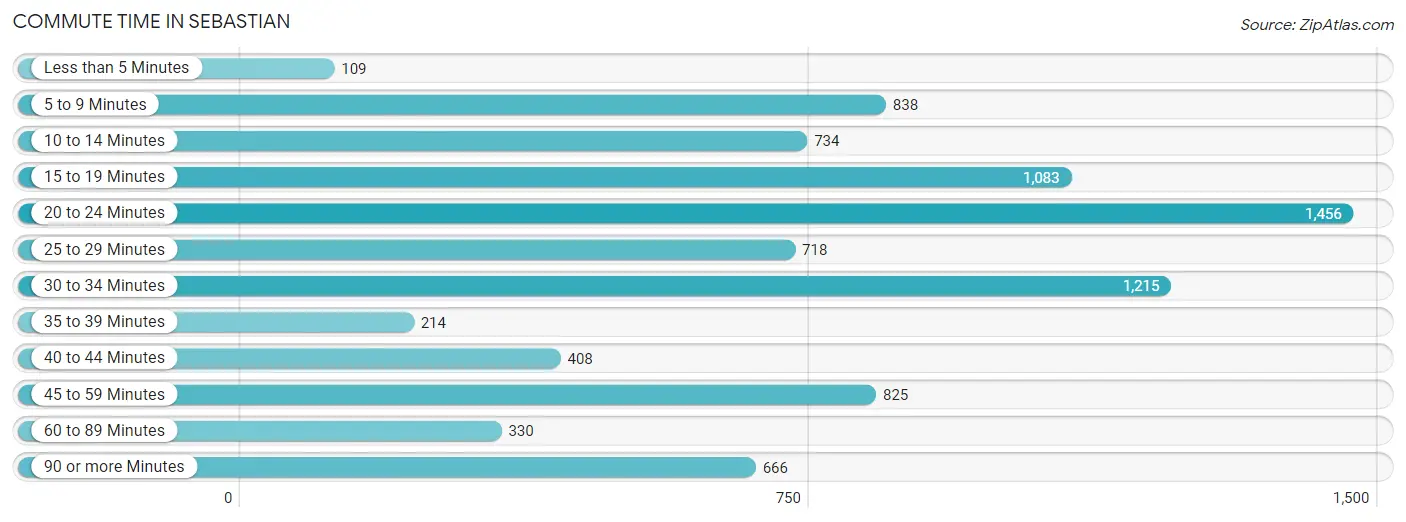
| Commute Time | # Commuters | % Commuters |
| Less than 5 Minutes | 109 | 1.3% |
| 5 to 9 Minutes | 838 | 9.8% |
| 10 to 14 Minutes | 734 | 8.5% |
| 15 to 19 Minutes | 1,083 | 12.6% |
| 20 to 24 Minutes | 1,456 | 16.9% |
| 25 to 29 Minutes | 718 | 8.4% |
| 30 to 34 Minutes | 1,215 | 14.1% |
| 35 to 39 Minutes | 214 | 2.5% |
| 40 to 44 Minutes | 408 | 4.8% |
| 45 to 59 Minutes | 825 | 9.6% |
| 60 to 89 Minutes | 330 | 3.8% |
| 90 or more Minutes | 666 | 7.7% |
Commute Time by Sex in Sebastian
The most common commute times in Sebastian are 20 to 24 minutes (804 commuters, 16.1%) for males and 20 to 24 minutes (652 commuters, 18.1%) for females.
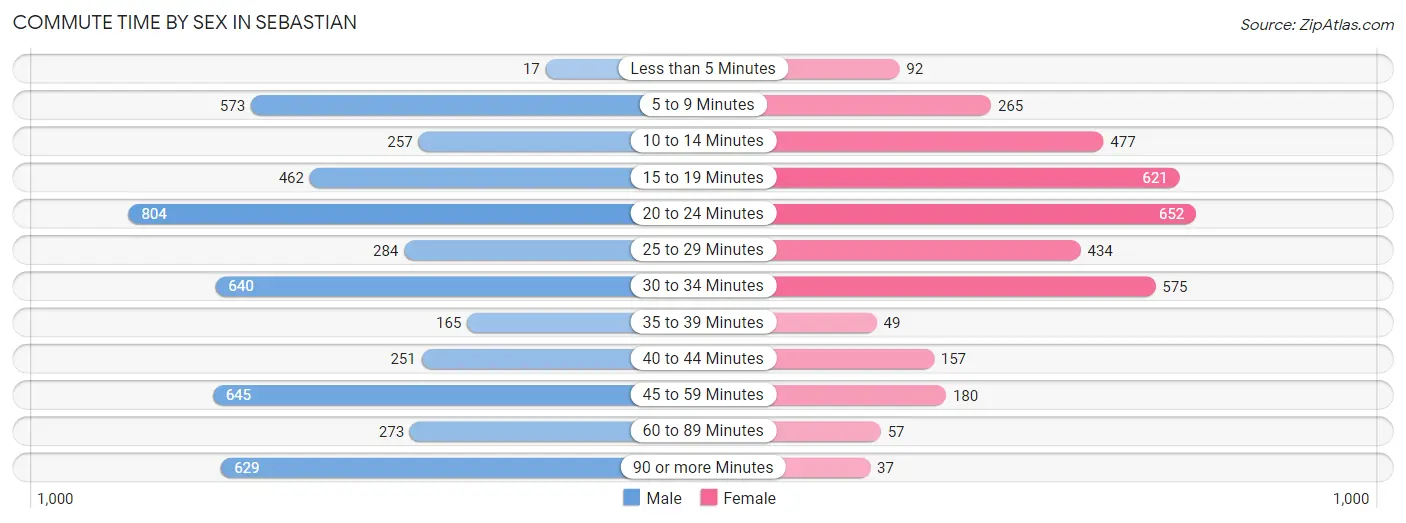
| Commute Time | Male | Female |
| Less than 5 Minutes | 17 (0.3%) | 92 (2.6%) |
| 5 to 9 Minutes | 573 (11.5%) | 265 (7.4%) |
| 10 to 14 Minutes | 257 (5.1%) | 477 (13.3%) |
| 15 to 19 Minutes | 462 (9.2%) | 621 (17.3%) |
| 20 to 24 Minutes | 804 (16.1%) | 652 (18.1%) |
| 25 to 29 Minutes | 284 (5.7%) | 434 (12.1%) |
| 30 to 34 Minutes | 640 (12.8%) | 575 (16.0%) |
| 35 to 39 Minutes | 165 (3.3%) | 49 (1.4%) |
| 40 to 44 Minutes | 251 (5.0%) | 157 (4.4%) |
| 45 to 59 Minutes | 645 (12.9%) | 180 (5.0%) |
| 60 to 89 Minutes | 273 (5.5%) | 57 (1.6%) |
| 90 or more Minutes | 629 (12.6%) | 37 (1.0%) |
Time of Departure to Work by Sex in Sebastian
The most frequent times of departure to work in Sebastian are 7:00 AM to 7:29 AM (1,175, 23.5%) for males and 7:30 AM to 7:59 AM (764, 21.2%) for females.
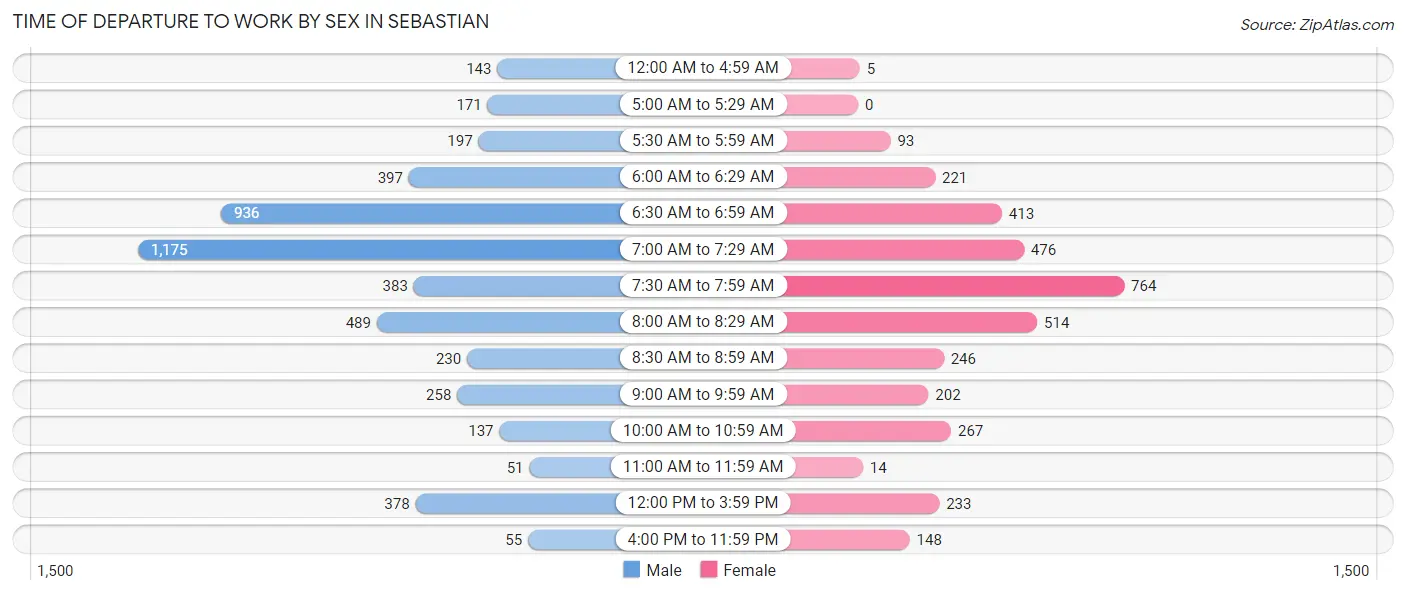
| Time of Departure | Male | Female |
| 12:00 AM to 4:59 AM | 143 (2.9%) | 5 (0.1%) |
| 5:00 AM to 5:29 AM | 171 (3.4%) | 0 (0.0%) |
| 5:30 AM to 5:59 AM | 197 (3.9%) | 93 (2.6%) |
| 6:00 AM to 6:29 AM | 397 (7.9%) | 221 (6.1%) |
| 6:30 AM to 6:59 AM | 936 (18.7%) | 413 (11.5%) |
| 7:00 AM to 7:29 AM | 1,175 (23.5%) | 476 (13.2%) |
| 7:30 AM to 7:59 AM | 383 (7.7%) | 764 (21.2%) |
| 8:00 AM to 8:29 AM | 489 (9.8%) | 514 (14.3%) |
| 8:30 AM to 8:59 AM | 230 (4.6%) | 246 (6.8%) |
| 9:00 AM to 9:59 AM | 258 (5.2%) | 202 (5.6%) |
| 10:00 AM to 10:59 AM | 137 (2.7%) | 267 (7.4%) |
| 11:00 AM to 11:59 AM | 51 (1.0%) | 14 (0.4%) |
| 12:00 PM to 3:59 PM | 378 (7.6%) | 233 (6.5%) |
| 4:00 PM to 11:59 PM | 55 (1.1%) | 148 (4.1%) |
| Total | 5,000 (100.0%) | 3,596 (100.0%) |
Housing Occupancy in Sebastian
Occupancy by Ownership in Sebastian
Of the total 10,946 dwellings in Sebastian, owner-occupied units account for 9,112 (83.3%), while renter-occupied units make up 1,834 (16.8%).
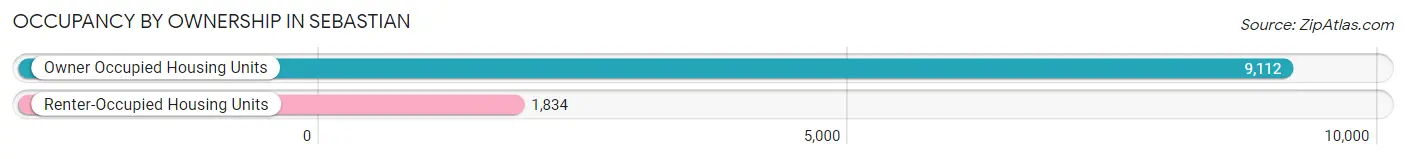
| Occupancy | # Housing Units | % Housing Units |
| Owner Occupied Housing Units | 9,112 | 83.3% |
| Renter-Occupied Housing Units | 1,834 | 16.8% |
| Total Occupied Housing Units | 10,946 | 100.0% |
Occupancy by Household Size in Sebastian
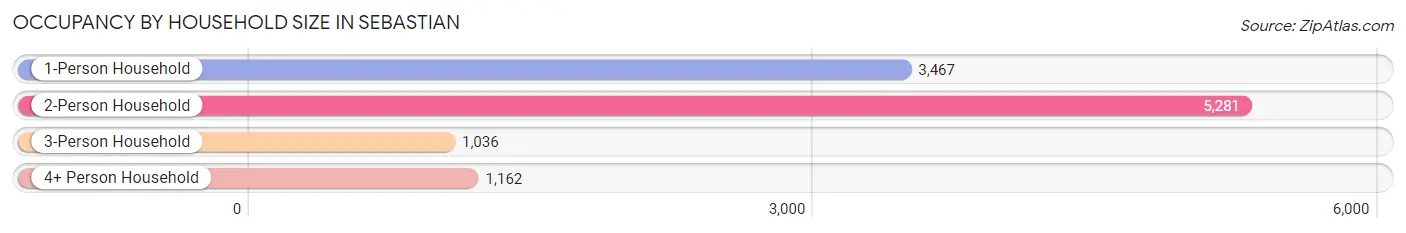
| Household Size | # Housing Units | % Housing Units |
| 1-Person Household | 3,467 | 31.7% |
| 2-Person Household | 5,281 | 48.2% |
| 3-Person Household | 1,036 | 9.5% |
| 4+ Person Household | 1,162 | 10.6% |
| Total Housing Units | 10,946 | 100.0% |
Occupancy by Ownership by Household Size in Sebastian
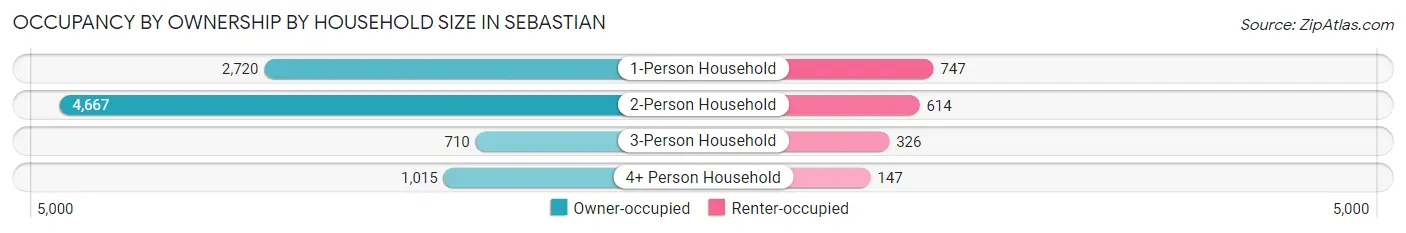
| Household Size | Owner-occupied | Renter-occupied |
| 1-Person Household | 2,720 (78.4%) | 747 (21.5%) |
| 2-Person Household | 4,667 (88.4%) | 614 (11.6%) |
| 3-Person Household | 710 (68.5%) | 326 (31.5%) |
| 4+ Person Household | 1,015 (87.4%) | 147 (12.7%) |
| Total Housing Units | 9,112 (83.3%) | 1,834 (16.8%) |
Occupancy by Educational Attainment in Sebastian
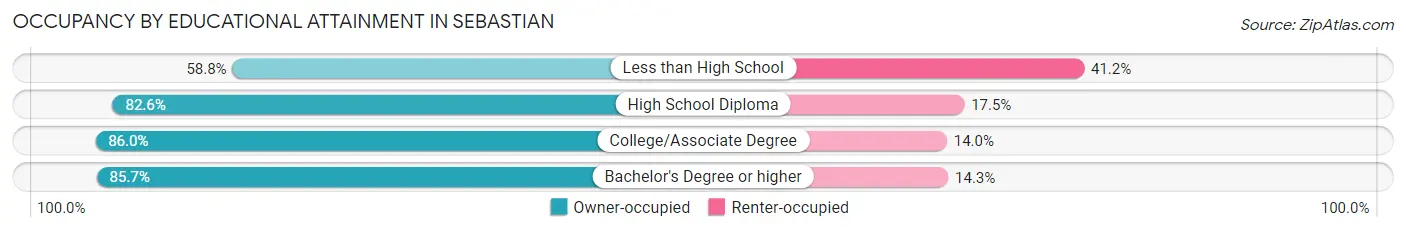
| Household Size | Owner-occupied | Renter-occupied |
| Less than High School | 408 (58.8%) | 286 (41.2%) |
| High School Diploma | 2,479 (82.6%) | 524 (17.4%) |
| College/Associate Degree | 3,292 (86.0%) | 536 (14.0%) |
| Bachelor's Degree or higher | 2,933 (85.7%) | 488 (14.3%) |
Occupancy by Age of Householder in Sebastian
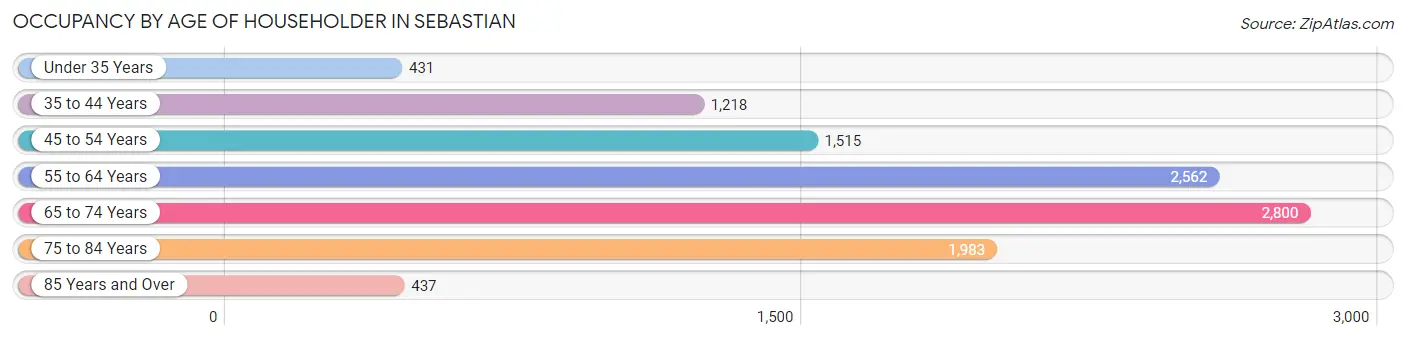
| Age Bracket | # Households | % Households |
| Under 35 Years | 431 | 3.9% |
| 35 to 44 Years | 1,218 | 11.1% |
| 45 to 54 Years | 1,515 | 13.8% |
| 55 to 64 Years | 2,562 | 23.4% |
| 65 to 74 Years | 2,800 | 25.6% |
| 75 to 84 Years | 1,983 | 18.1% |
| 85 Years and Over | 437 | 4.0% |
| Total | 10,946 | 100.0% |
Housing Finances in Sebastian
Median Income by Occupancy in Sebastian
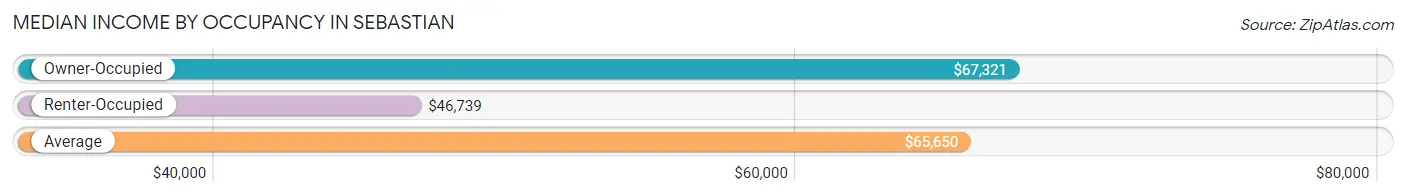
| Occupancy Type | # Households | Median Income |
| Owner-Occupied | 9,112 (83.3%) | $67,321 |
| Renter-Occupied | 1,834 (16.8%) | $46,739 |
| Average | 10,946 (100.0%) | $65,650 |
Occupancy by Householder Income Bracket in Sebastian
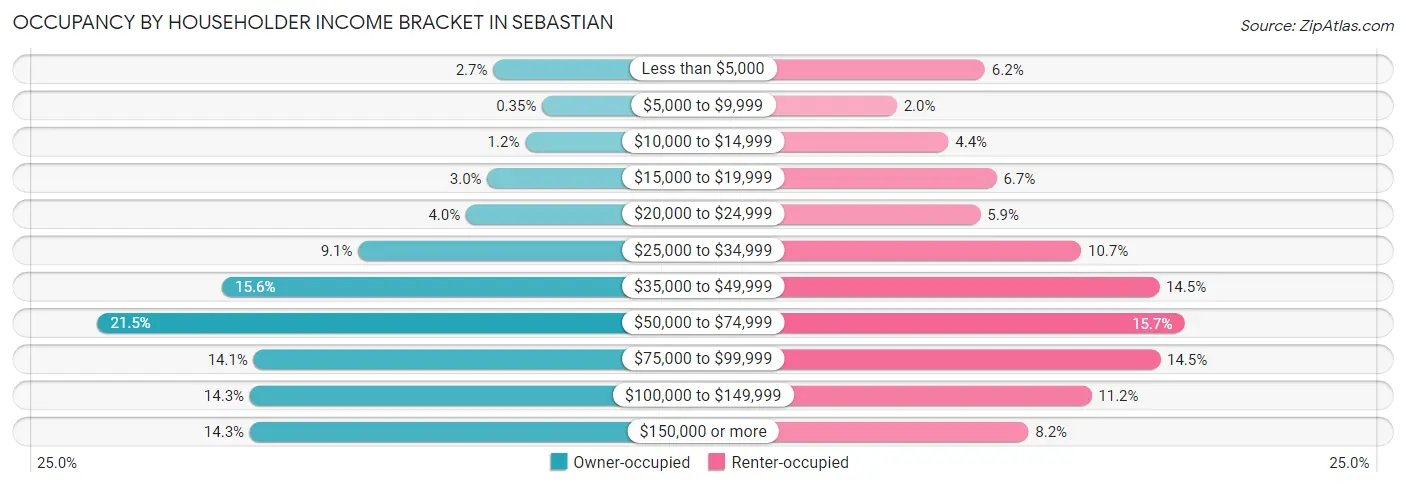
| Income Bracket | Owner-occupied | Renter-occupied |
| Less than $5,000 | 244 (2.7%) | 113 (6.2%) |
| $5,000 to $9,999 | 32 (0.4%) | 36 (2.0%) |
| $10,000 to $14,999 | 106 (1.2%) | 81 (4.4%) |
| $15,000 to $19,999 | 270 (3.0%) | 123 (6.7%) |
| $20,000 to $24,999 | 363 (4.0%) | 109 (5.9%) |
| $25,000 to $34,999 | 830 (9.1%) | 197 (10.7%) |
| $35,000 to $49,999 | 1,421 (15.6%) | 265 (14.4%) |
| $50,000 to $74,999 | 1,962 (21.5%) | 287 (15.7%) |
| $75,000 to $99,999 | 1,284 (14.1%) | 266 (14.5%) |
| $100,000 to $149,999 | 1,300 (14.3%) | 206 (11.2%) |
| $150,000 or more | 1,300 (14.3%) | 151 (8.2%) |
| Total | 9,112 (100.0%) | 1,834 (100.0%) |
Monthly Housing Cost Tiers in Sebastian
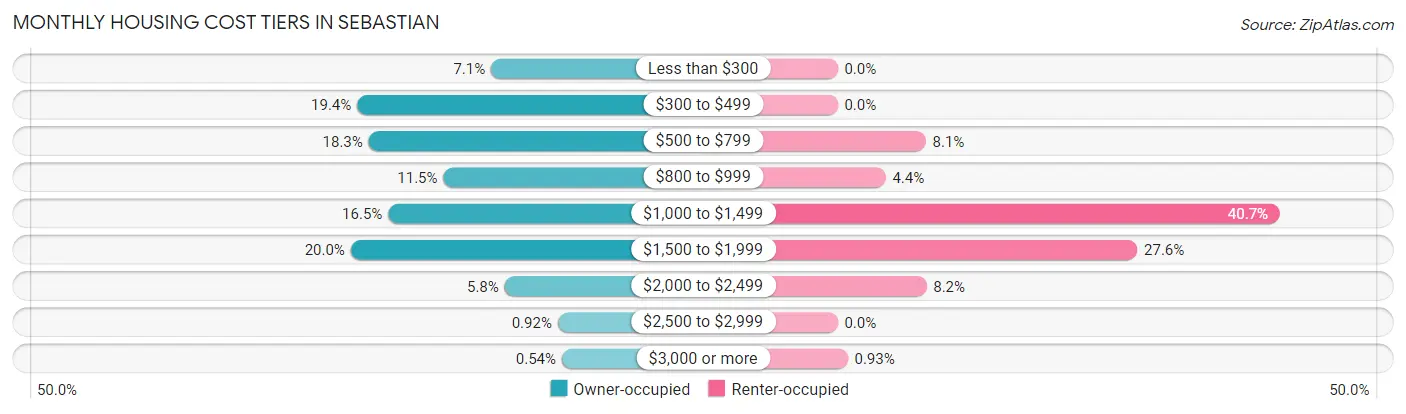
| Monthly Cost | Owner-occupied | Renter-occupied |
| Less than $300 | 643 (7.1%) | 0 (0.0%) |
| $300 to $499 | 1,767 (19.4%) | 0 (0.0%) |
| $500 to $799 | 1,670 (18.3%) | 149 (8.1%) |
| $800 to $999 | 1,043 (11.5%) | 81 (4.4%) |
| $1,000 to $1,499 | 1,506 (16.5%) | 747 (40.7%) |
| $1,500 to $1,999 | 1,821 (20.0%) | 506 (27.6%) |
| $2,000 to $2,499 | 529 (5.8%) | 150 (8.2%) |
| $2,500 to $2,999 | 84 (0.9%) | 0 (0.0%) |
| $3,000 or more | 49 (0.5%) | 17 (0.9%) |
| Total | 9,112 (100.0%) | 1,834 (100.0%) |
Physical Housing Characteristics in Sebastian
Housing Structures in Sebastian
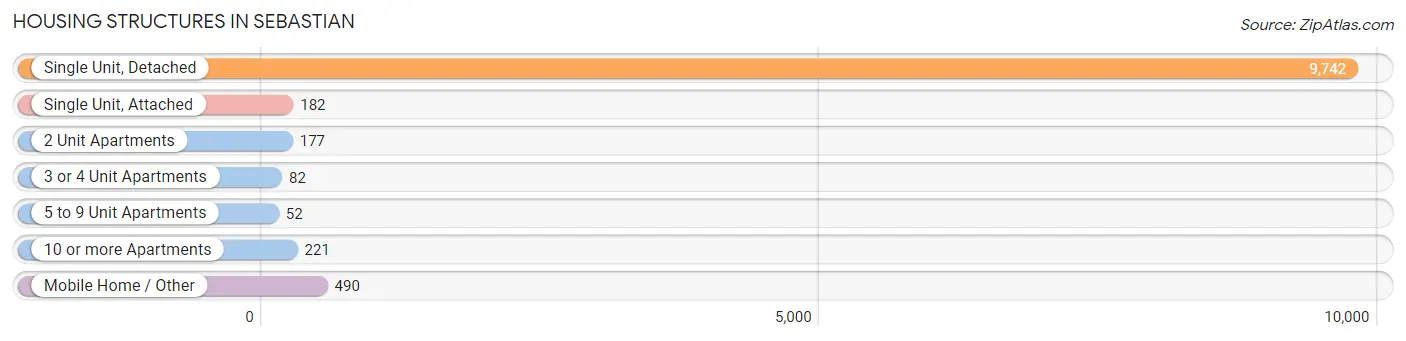
| Structure Type | # Housing Units | % Housing Units |
| Single Unit, Detached | 9,742 | 89.0% |
| Single Unit, Attached | 182 | 1.7% |
| 2 Unit Apartments | 177 | 1.6% |
| 3 or 4 Unit Apartments | 82 | 0.7% |
| 5 to 9 Unit Apartments | 52 | 0.5% |
| 10 or more Apartments | 221 | 2.0% |
| Mobile Home / Other | 490 | 4.5% |
| Total | 10,946 | 100.0% |
Housing Structures by Occupancy in Sebastian
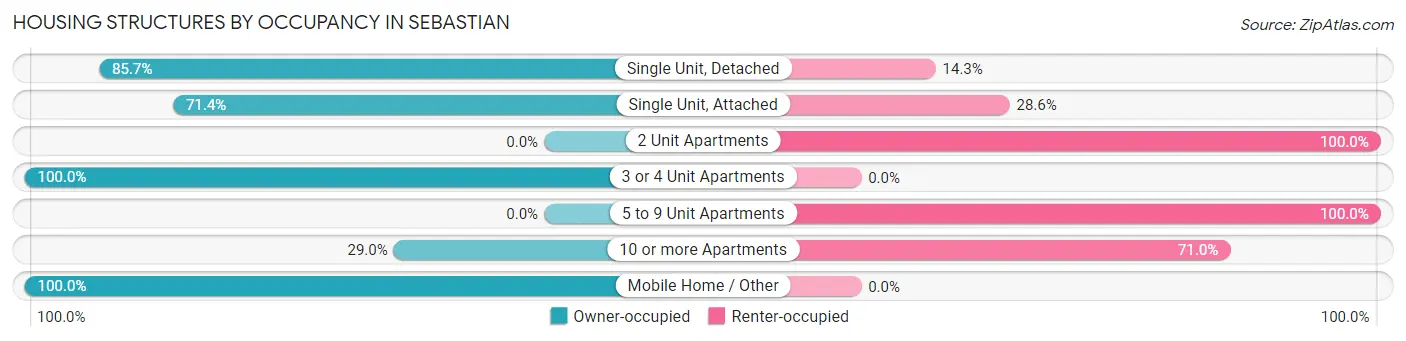
| Structure Type | Owner-occupied | Renter-occupied |
| Single Unit, Detached | 8,346 (85.7%) | 1,396 (14.3%) |
| Single Unit, Attached | 130 (71.4%) | 52 (28.6%) |
| 2 Unit Apartments | 0 (0.0%) | 177 (100.0%) |
| 3 or 4 Unit Apartments | 82 (100.0%) | 0 (0.0%) |
| 5 to 9 Unit Apartments | 0 (0.0%) | 52 (100.0%) |
| 10 or more Apartments | 64 (29.0%) | 157 (71.0%) |
| Mobile Home / Other | 490 (100.0%) | 0 (0.0%) |
| Total | 9,112 (83.3%) | 1,834 (16.8%) |
Housing Structures by Number of Rooms in Sebastian
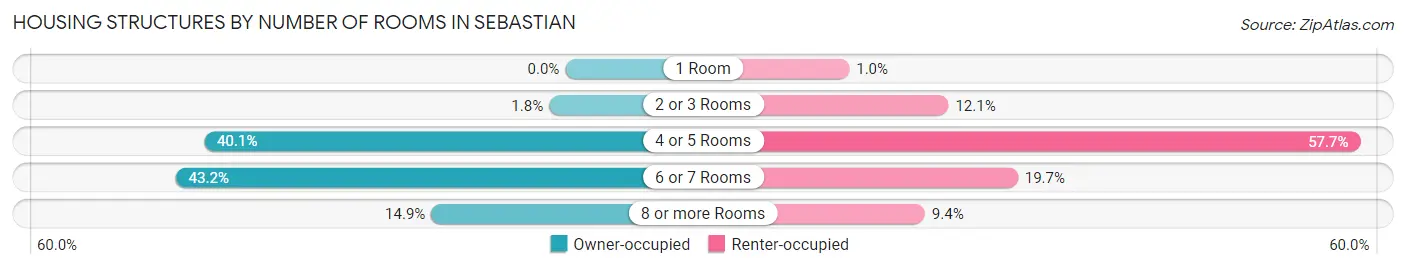
| Number of Rooms | Owner-occupied | Renter-occupied |
| 1 Room | 0 (0.0%) | 19 (1.0%) |
| 2 or 3 Rooms | 164 (1.8%) | 221 (12.0%) |
| 4 or 5 Rooms | 3,653 (40.1%) | 1,059 (57.7%) |
| 6 or 7 Rooms | 3,939 (43.2%) | 362 (19.7%) |
| 8 or more Rooms | 1,356 (14.9%) | 173 (9.4%) |
| Total | 9,112 (100.0%) | 1,834 (100.0%) |
Housing Structure by Heating Type in Sebastian
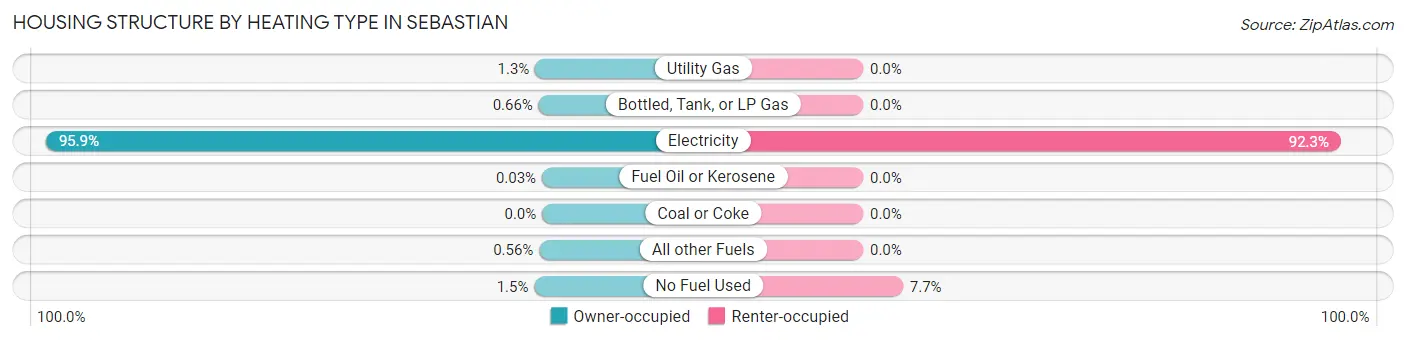
| Heating Type | Owner-occupied | Renter-occupied |
| Utility Gas | 122 (1.3%) | 0 (0.0%) |
| Bottled, Tank, or LP Gas | 60 (0.7%) | 0 (0.0%) |
| Electricity | 8,739 (95.9%) | 1,693 (92.3%) |
| Fuel Oil or Kerosene | 3 (0.0%) | 0 (0.0%) |
| Coal or Coke | 0 (0.0%) | 0 (0.0%) |
| All other Fuels | 51 (0.6%) | 0 (0.0%) |
| No Fuel Used | 137 (1.5%) | 141 (7.7%) |
| Total | 9,112 (100.0%) | 1,834 (100.0%) |
Household Vehicle Usage in Sebastian
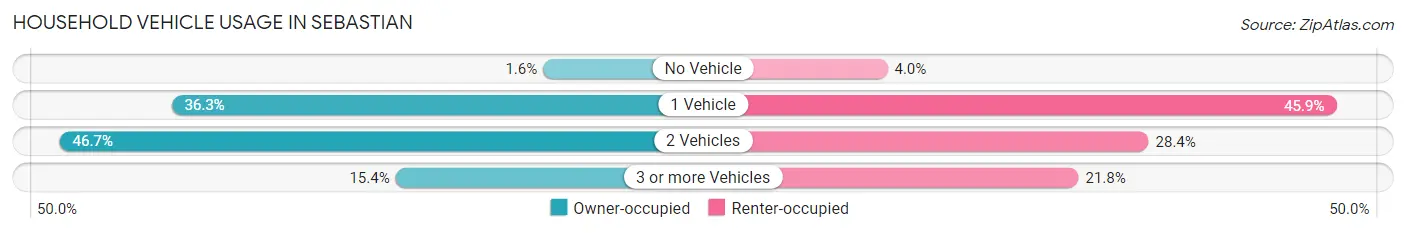
| Vehicles per Household | Owner-occupied | Renter-occupied |
| No Vehicle | 146 (1.6%) | 73 (4.0%) |
| 1 Vehicle | 3,307 (36.3%) | 841 (45.9%) |
| 2 Vehicles | 4,258 (46.7%) | 520 (28.3%) |
| 3 or more Vehicles | 1,401 (15.4%) | 400 (21.8%) |
| Total | 9,112 (100.0%) | 1,834 (100.0%) |
Real Estate & Mortgages in Sebastian
Real Estate and Mortgage Overview in Sebastian
| Characteristic | Without Mortgage | With Mortgage |
| Housing Units | 4,285 | 4,827 |
| Median Property Value | $252,300 | $259,500 |
| Median Household Income | $52,311 | $948 |
| Monthly Housing Costs | $472 | $35 |
| Real Estate Taxes | $1,813 | $106 |
Property Value by Mortgage Status in Sebastian
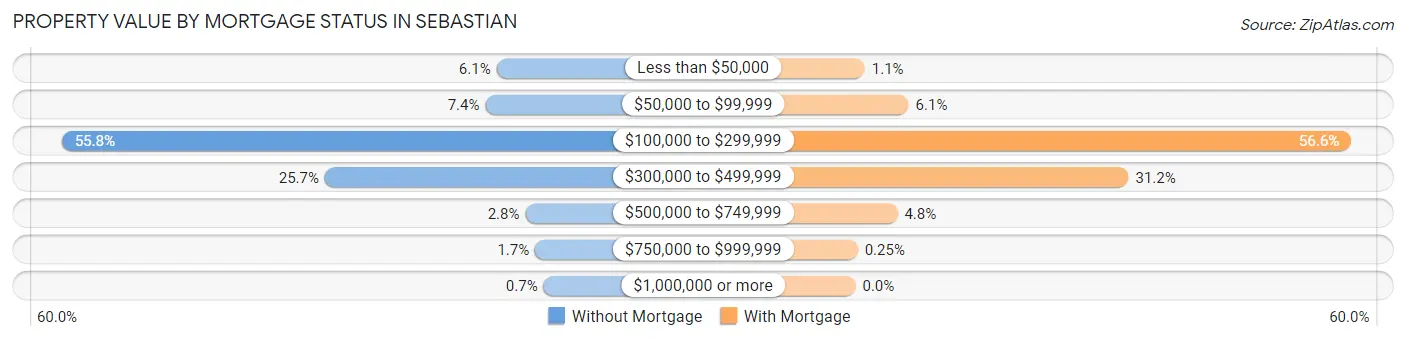
| Property Value | Without Mortgage | With Mortgage |
| Less than $50,000 | 260 (6.1%) | 51 (1.1%) |
| $50,000 to $99,999 | 315 (7.3%) | 293 (6.1%) |
| $100,000 to $299,999 | 2,389 (55.7%) | 2,734 (56.6%) |
| $300,000 to $499,999 | 1,101 (25.7%) | 1,506 (31.2%) |
| $500,000 to $749,999 | 119 (2.8%) | 231 (4.8%) |
| $750,000 to $999,999 | 71 (1.7%) | 12 (0.3%) |
| $1,000,000 or more | 30 (0.7%) | 0 (0.0%) |
| Total | 4,285 (100.0%) | 4,827 (100.0%) |
Household Income by Mortgage Status in Sebastian
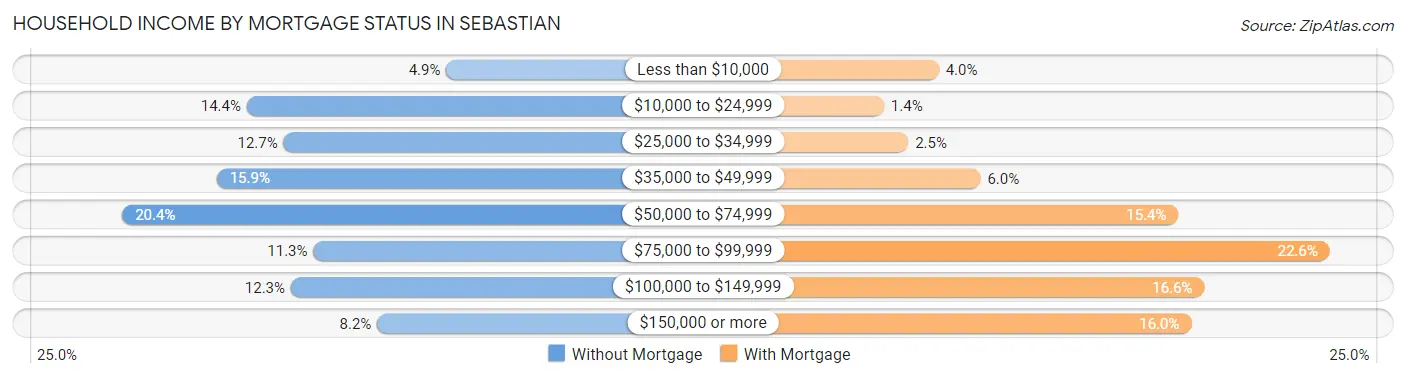
| Household Income | Without Mortgage | With Mortgage |
| Less than $10,000 | 211 (4.9%) | 191 (4.0%) |
| $10,000 to $24,999 | 618 (14.4%) | 65 (1.3%) |
| $25,000 to $34,999 | 543 (12.7%) | 121 (2.5%) |
| $35,000 to $49,999 | 679 (15.9%) | 287 (5.9%) |
| $50,000 to $74,999 | 872 (20.3%) | 742 (15.4%) |
| $75,000 to $99,999 | 482 (11.3%) | 1,090 (22.6%) |
| $100,000 to $149,999 | 528 (12.3%) | 802 (16.6%) |
| $150,000 or more | 352 (8.2%) | 772 (16.0%) |
| Total | 4,285 (100.0%) | 4,827 (100.0%) |
Property Value to Household Income Ratio in Sebastian
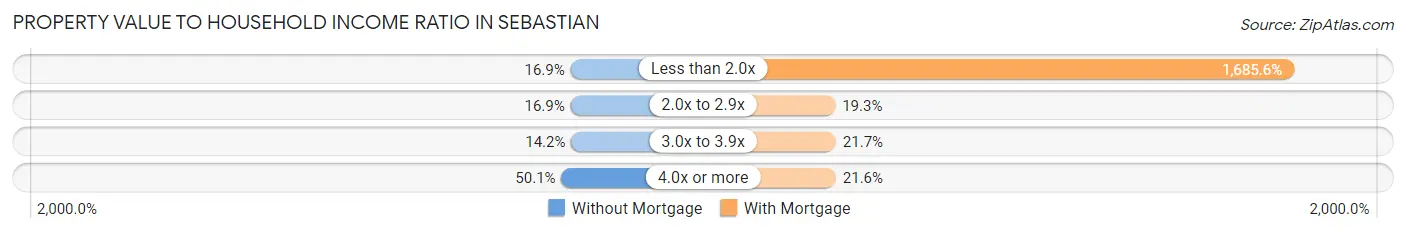
| Value-to-Income Ratio | Without Mortgage | With Mortgage |
| Less than 2.0x | 724 (16.9%) | 81,365 (1,685.6%) |
| 2.0x to 2.9x | 726 (16.9%) | 932 (19.3%) |
| 3.0x to 3.9x | 607 (14.2%) | 1,049 (21.7%) |
| 4.0x or more | 2,148 (50.1%) | 1,040 (21.5%) |
| Total | 4,285 (100.0%) | 4,827 (100.0%) |
Real Estate Taxes by Mortgage Status in Sebastian
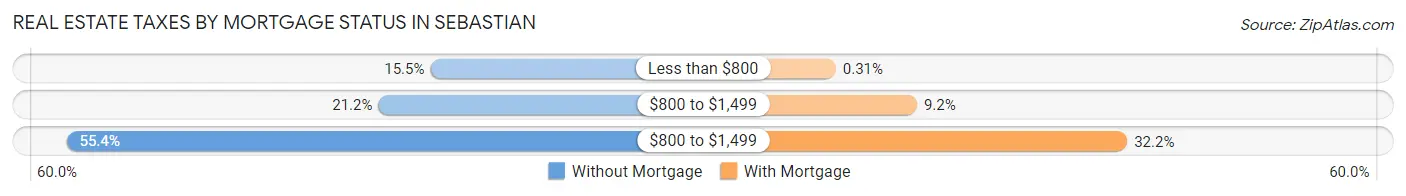
| Property Taxes | Without Mortgage | With Mortgage |
| Less than $800 | 666 (15.5%) | 15 (0.3%) |
| $800 to $1,499 | 910 (21.2%) | 444 (9.2%) |
| $800 to $1,499 | 2,374 (55.4%) | 1,556 (32.2%) |
| Total | 4,285 (100.0%) | 4,827 (100.0%) |
Health & Disability in Sebastian
Health Insurance Coverage by Age in Sebastian
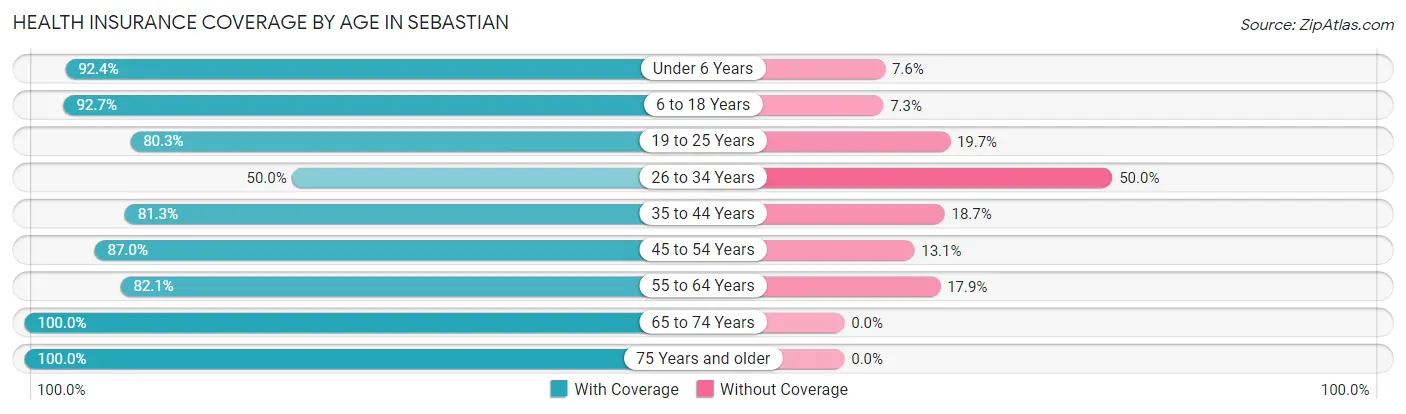
| Age Bracket | With Coverage | Without Coverage |
| Under 6 Years | 829 (92.4%) | 68 (7.6%) |
| 6 to 18 Years | 2,416 (92.7%) | 189 (7.3%) |
| 19 to 25 Years | 791 (80.3%) | 194 (19.7%) |
| 26 to 34 Years | 929 (50.0%) | 928 (50.0%) |
| 35 to 44 Years | 1,788 (81.3%) | 411 (18.7%) |
| 45 to 54 Years | 2,711 (87.0%) | 407 (13.1%) |
| 55 to 64 Years | 3,602 (82.1%) | 784 (17.9%) |
| 65 to 74 Years | 4,990 (100.0%) | 0 (0.0%) |
| 75 Years and older | 4,229 (100.0%) | 0 (0.0%) |
| Total | 22,285 (88.2%) | 2,981 (11.8%) |
Health Insurance Coverage by Citizenship Status in Sebastian
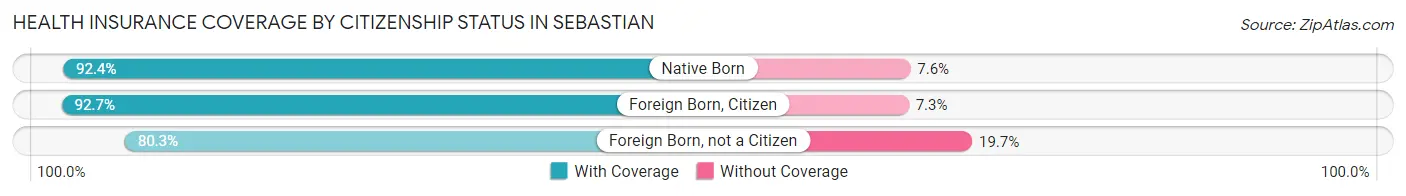
| Citizenship Status | With Coverage | Without Coverage |
| Native Born | 829 (92.4%) | 68 (7.6%) |
| Foreign Born, Citizen | 2,416 (92.7%) | 189 (7.3%) |
| Foreign Born, not a Citizen | 791 (80.3%) | 194 (19.7%) |
Health Insurance Coverage by Household Income in Sebastian
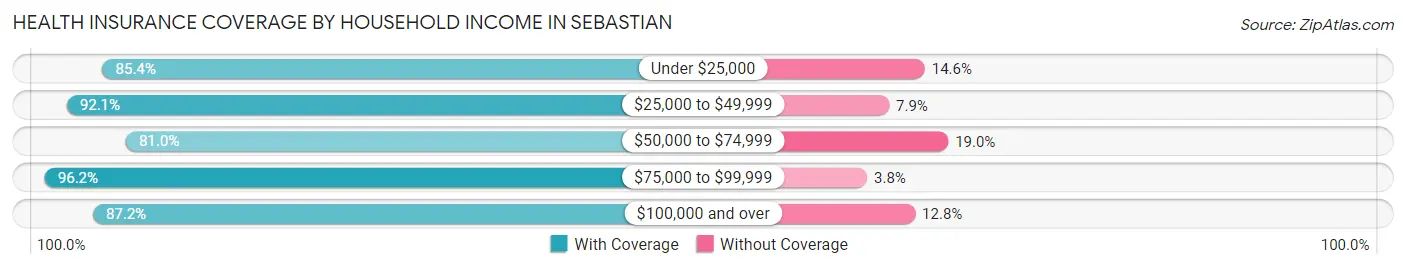
| Household Income | With Coverage | Without Coverage |
| Under $25,000 | 1,933 (85.4%) | 331 (14.6%) |
| $25,000 to $49,999 | 4,735 (92.1%) | 407 (7.9%) |
| $50,000 to $74,999 | 4,089 (81.0%) | 959 (19.0%) |
| $75,000 to $99,999 | 3,801 (96.2%) | 150 (3.8%) |
| $100,000 and over | 7,706 (87.2%) | 1,132 (12.8%) |
Public vs Private Health Insurance Coverage by Age in Sebastian
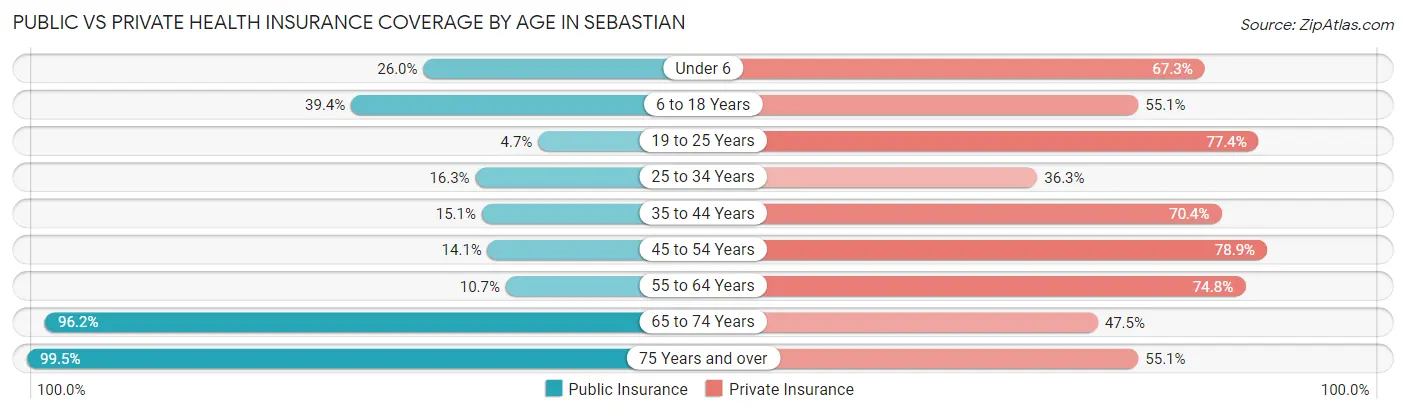
| Age Bracket | Public Insurance | Private Insurance |
| Under 6 | 233 (26.0%) | 604 (67.3%) |
| 6 to 18 Years | 1,026 (39.4%) | 1,434 (55.0%) |
| 19 to 25 Years | 46 (4.7%) | 762 (77.4%) |
| 25 to 34 Years | 303 (16.3%) | 674 (36.3%) |
| 35 to 44 Years | 333 (15.1%) | 1,549 (70.4%) |
| 45 to 54 Years | 438 (14.1%) | 2,460 (78.9%) |
| 55 to 64 Years | 469 (10.7%) | 3,282 (74.8%) |
| 65 to 74 Years | 4,800 (96.2%) | 2,371 (47.5%) |
| 75 Years and over | 4,209 (99.5%) | 2,328 (55.0%) |
| Total | 11,857 (46.9%) | 15,464 (61.2%) |
Disability Status by Sex by Age in Sebastian
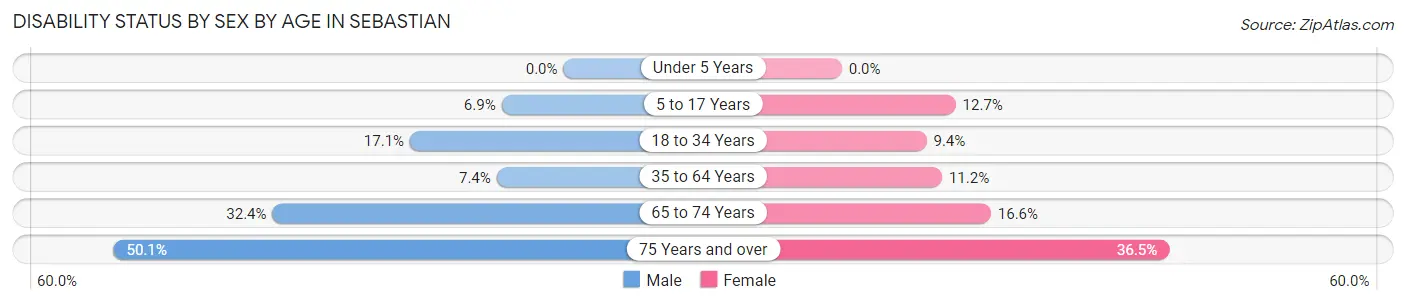
| Age Bracket | Male | Female |
| Under 5 Years | 0 (0.0%) | 0 (0.0%) |
| 5 to 17 Years | 103 (6.9%) | 164 (12.7%) |
| 18 to 34 Years | 291 (17.1%) | 114 (9.4%) |
| 35 to 64 Years | 360 (7.4%) | 542 (11.2%) |
| 65 to 74 Years | 758 (32.4%) | 440 (16.6%) |
| 75 Years and over | 880 (50.1%) | 901 (36.4%) |
Disability Class by Sex by Age in Sebastian
Disability Class: Hearing Difficulty
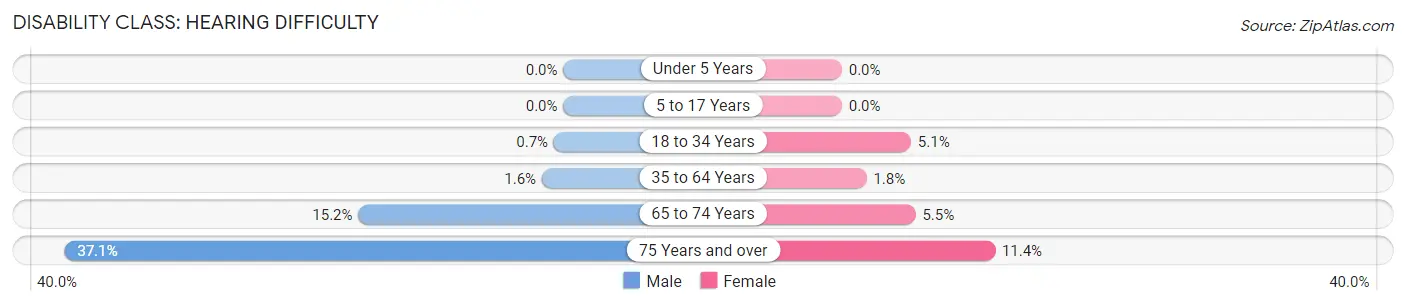
| Age Bracket | Male | Female |
| Under 5 Years | 0 (0.0%) | 0 (0.0%) |
| 5 to 17 Years | 0 (0.0%) | 0 (0.0%) |
| 18 to 34 Years | 12 (0.7%) | 62 (5.1%) |
| 35 to 64 Years | 77 (1.6%) | 89 (1.8%) |
| 65 to 74 Years | 356 (15.2%) | 145 (5.5%) |
| 75 Years and over | 651 (37.0%) | 281 (11.4%) |
Disability Class: Vision Difficulty
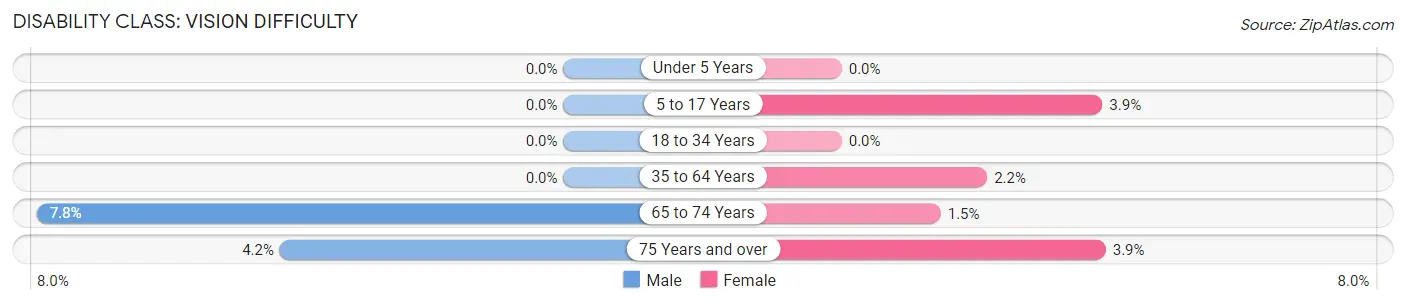
| Age Bracket | Male | Female |
| Under 5 Years | 0 (0.0%) | 0 (0.0%) |
| 5 to 17 Years | 0 (0.0%) | 50 (3.9%) |
| 18 to 34 Years | 0 (0.0%) | 0 (0.0%) |
| 35 to 64 Years | 0 (0.0%) | 105 (2.2%) |
| 65 to 74 Years | 183 (7.8%) | 39 (1.5%) |
| 75 Years and over | 74 (4.2%) | 97 (3.9%) |
Disability Class: Cognitive Difficulty
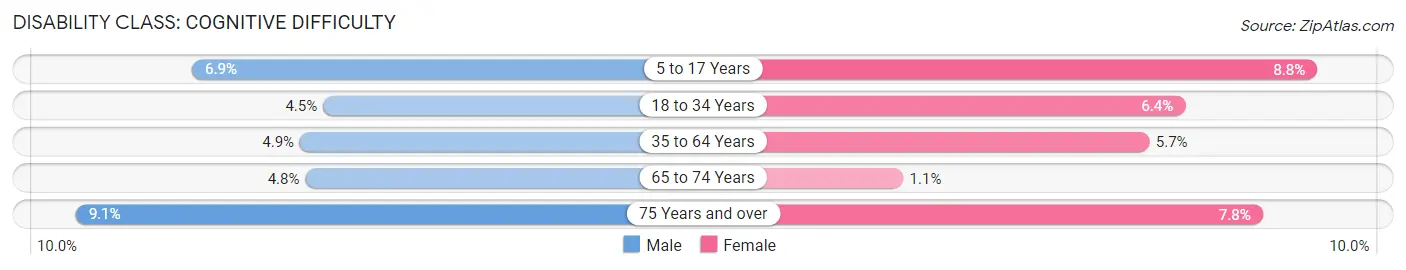
| Age Bracket | Male | Female |
| 5 to 17 Years | 103 (6.9%) | 114 (8.8%) |
| 18 to 34 Years | 76 (4.5%) | 77 (6.4%) |
| 35 to 64 Years | 237 (4.9%) | 277 (5.7%) |
| 65 to 74 Years | 112 (4.8%) | 30 (1.1%) |
| 75 Years and over | 159 (9.0%) | 193 (7.8%) |
Disability Class: Ambulatory Difficulty
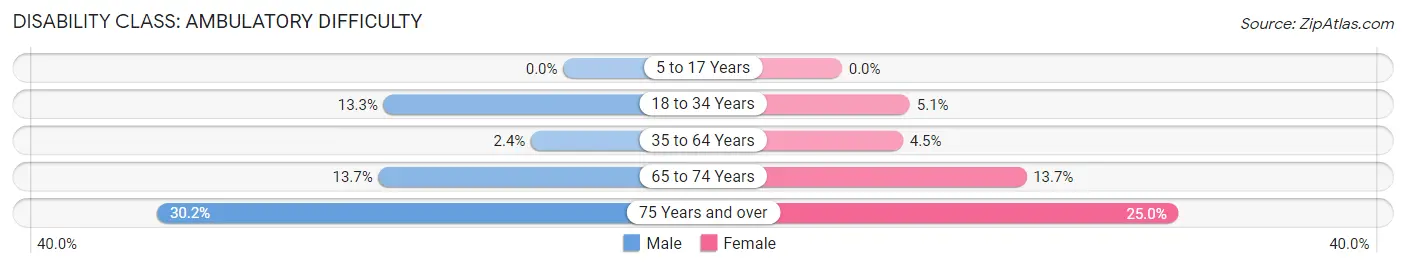
| Age Bracket | Male | Female |
| 5 to 17 Years | 0 (0.0%) | 0 (0.0%) |
| 18 to 34 Years | 227 (13.3%) | 61 (5.1%) |
| 35 to 64 Years | 116 (2.4%) | 220 (4.5%) |
| 65 to 74 Years | 321 (13.7%) | 363 (13.7%) |
| 75 Years and over | 530 (30.2%) | 618 (25.0%) |
Disability Class: Self-Care Difficulty
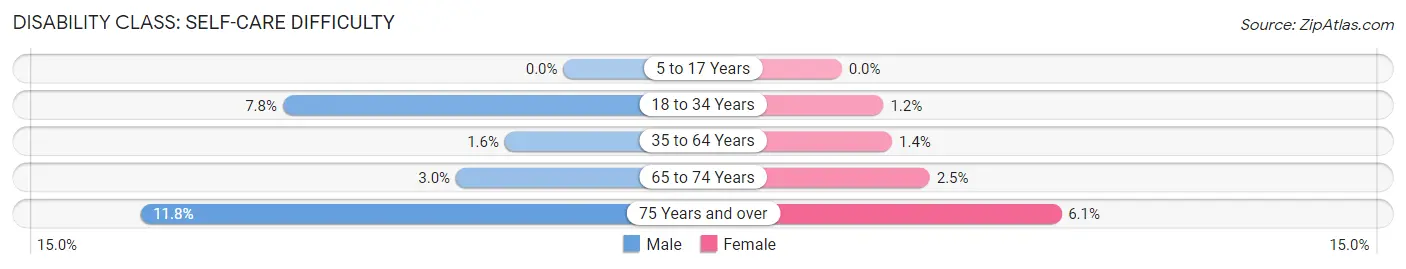
| Age Bracket | Male | Female |
| 5 to 17 Years | 0 (0.0%) | 0 (0.0%) |
| 18 to 34 Years | 133 (7.8%) | 14 (1.2%) |
| 35 to 64 Years | 79 (1.6%) | 68 (1.4%) |
| 65 to 74 Years | 70 (3.0%) | 65 (2.5%) |
| 75 Years and over | 207 (11.8%) | 151 (6.1%) |
Technology Access in Sebastian
Computing Device Access in Sebastian
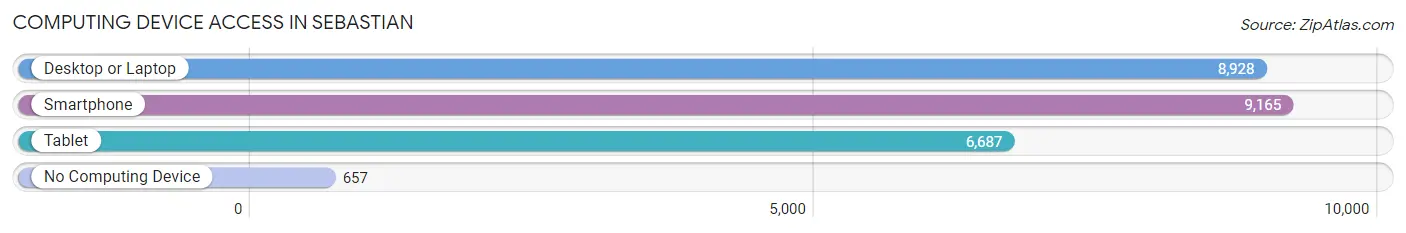
| Device Type | # Households | % Households |
| Desktop or Laptop | 8,928 | 81.6% |
| Smartphone | 9,165 | 83.7% |
| Tablet | 6,687 | 61.1% |
| No Computing Device | 657 | 6.0% |
| Total | 10,946 | 100.0% |
Internet Access in Sebastian
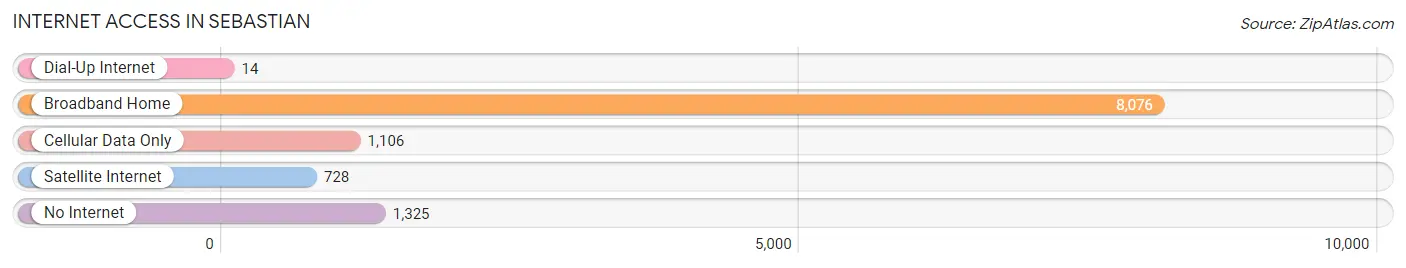
| Internet Type | # Households | % Households |
| Dial-Up Internet | 14 | 0.1% |
| Broadband Home | 8,076 | 73.8% |
| Cellular Data Only | 1,106 | 10.1% |
| Satellite Internet | 728 | 6.7% |
| No Internet | 1,325 | 12.1% |
| Total | 10,946 | 100.0% |
Sebastian Summary
Sebastian, Florida is a small city located in Indian River County on the east coast of Florida. It is situated on the Indian River Lagoon, which is part of the Intracoastal Waterway. The city is known for its beautiful beaches, fishing, and outdoor activities.
Geography
Sebastian is located in the Treasure Coast region of Florida, about halfway between Vero Beach and Melbourne. It is bordered by the Indian River Lagoon to the east and the St. Sebastian River to the west. The city covers an area of 8.3 square miles and has a population of approximately 22,000 people.
The city is divided into two distinct areas: the mainland and the barrier island. The mainland is home to the majority of the city’s population and is where most of the commercial and residential development is located. The barrier island is a narrow strip of land that separates the Indian River Lagoon from the Atlantic Ocean. It is home to some of the city’s most popular beaches and is a popular destination for tourists and locals alike.
Climate
Sebastian has a humid subtropical climate, with hot, humid summers and mild winters. The average temperature in the summer is around 90°F, while in the winter it is around 70°F. The city receives an average of 54 inches of rain per year, with most of it falling in the summer months.
Economy
Sebastian’s economy is largely based on tourism and fishing. The city is home to several popular beaches, including Sebastian Inlet State Park, which is a popular destination for fishing, swimming, and other outdoor activities. The city also has a thriving seafood industry, with several restaurants and seafood markets located along the waterfront.
In addition to tourism and fishing, Sebastian is home to several manufacturing and technology companies. The city is home to the headquarters of the aerospace company Embraer, as well as the manufacturing facility for the company’s aircraft. The city is also home to several technology companies, including the software company Vero Beach Software.
Demographics
As of the 2010 census, the population of Sebastian was 21,929. The racial makeup of the city was 87.3% White, 8.2% African American, 0.5% Native American, 0.7% Asian, 0.1% Pacific Islander, 1.7% from other races, and 1.5% from two or more races. Hispanic or Latino of any race were 5.3% of the population.
The median household income in Sebastian was $41,945, and the median family income was $50,945. The per capita income for the city was $25,945. About 11.3% of the population was below the poverty line.
Sebastian is a small city with a rich history and a vibrant economy. It is home to some of the most beautiful beaches in Florida and is a popular destination for tourists and locals alike. The city is home to several manufacturing and technology companies, as well as a thriving seafood industry. The city has a diverse population and a median household income that is slightly higher than the national average.
Common Questions
What is Per Capita Income in Sebastian?
Per Capita income in Sebastian is $39,802.
What is the Median Family Income in Sebastian?
Median Family Income in Sebastian is $74,826.
What is the Median Household income in Sebastian?
Median Household Income in Sebastian is $65,650.
What is Income or Wage Gap in Sebastian?
Income or Wage Gap in Sebastian is 1.3%.
Women in Sebastian earn 98.7 cents for every dollar earned by a man.
What is Inequality or Gini Index in Sebastian?
Inequality or Gini Index in Sebastian is 0.44.
What is the Total Population of Sebastian?
Total Population of Sebastian is 25,266.
What is the Total Male Population of Sebastian?
Total Male Population of Sebastian is 12,389.
What is the Total Female Population of Sebastian?
Total Female Population of Sebastian is 12,877.
What is the Ratio of Males per 100 Females in Sebastian?
There are 96.21 Males per 100 Females in Sebastian.
What is the Ratio of Females per 100 Males in Sebastian?
There are 103.94 Females per 100 Males in Sebastian.
What is the Median Population Age in Sebastian?
Median Population Age in Sebastian is 57.5 Years.
What is the Average Family Size in Sebastian
Average Family Size in Sebastian is 2.8 People.
What is the Average Household Size in Sebastian
Average Household Size in Sebastian is 2.3 People.
How Large is the Labor Force in Sebastian?
There are 10,682 People in the Labor Forcein in Sebastian.
What is the Percentage of People in the Labor Force in Sebastian?
47.8% of People are in the Labor Force in Sebastian.
What is the Unemployment Rate in Sebastian?
Unemployment Rate in Sebastian is 9.6%.