Trinidadian and Tobagonian vs Marshallese Disability Age 5 to 17
COMPARE
Trinidadian and Tobagonian
Marshallese
Disability Age 5 to 17
Disability Age 5 to 17 Comparison
Trinidadians and Tobagonians
Marshallese
5.7%
DISABILITY AGE 5 TO 17
10.8/ 100
METRIC RATING
205th/ 347
METRIC RANK
5.7%
DISABILITY AGE 5 TO 17
28.1/ 100
METRIC RATING
188th/ 347
METRIC RANK
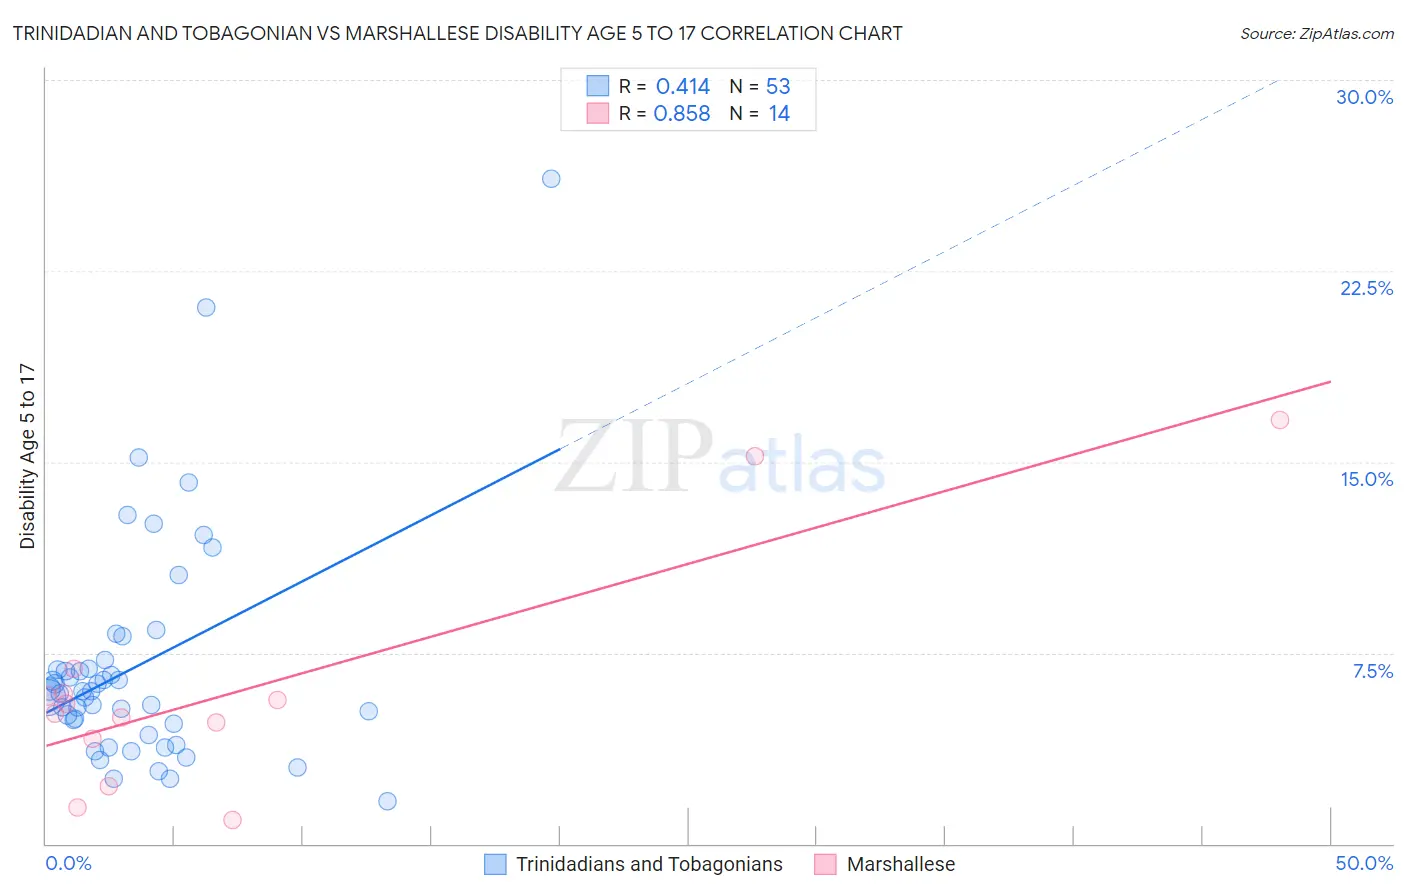
Trinidadian and Tobagonian vs Marshallese Disability Age 5 to 17 Correlation Chart
The statistical analysis conducted on geographies consisting of 219,004,260 people shows a moderate positive correlation between the proportion of Trinidadians and Tobagonians and percentage of population with a disability between the ages 5 and 17 in the United States with a correlation coefficient (R) of 0.414 and weighted average of 5.7%. Similarly, the statistical analysis conducted on geographies consisting of 14,753,220 people shows a very strong positive correlation between the proportion of Marshallese and percentage of population with a disability between the ages 5 and 17 in the United States with a correlation coefficient (R) of 0.858 and weighted average of 5.7%, a difference of 1.4%.
Disability Age 5 to 17 Correlation Summary
| Measurement | Trinidadian and Tobagonian | Marshallese |
| Minimum | 1.7% | 0.94% |
| Maximum | 26.1% | 16.7% |
| Range | 24.4% | 15.7% |
| Mean | 7.0% | 6.1% |
| Median | 6.0% | 5.3% |
| Interquartile 25% (IQ1) | 4.5% | 4.1% |
| Interquartile 75% (IQ3) | 7.0% | 5.9% |
| Interquartile Range (IQR) | 2.5% | 1.8% |
| Standard Deviation (Sample) | 4.5% | 4.5% |
| Standard Deviation (Population) | 4.4% | 4.4% |
Demographics Similar to Trinidadians and Tobagonians and Marshallese by Disability Age 5 to 17
In terms of disability age 5 to 17, the demographic groups most similar to Trinidadians and Tobagonians are Immigrants from Africa (5.7%, a difference of 0.0%), Paiute (5.7%, a difference of 0.050%), Spanish American Indian (5.7%, a difference of 0.23%), Austrian (5.7%, a difference of 0.27%), and Basque (5.7%, a difference of 0.32%). Similarly, the demographic groups most similar to Marshallese are Pueblo (5.7%, a difference of 0.040%), Immigrants from Eastern Africa (5.7%, a difference of 0.050%), Danish (5.7%, a difference of 0.10%), Immigrants from Bosnia and Herzegovina (5.7%, a difference of 0.11%), and Immigrants from Thailand (5.7%, a difference of 0.12%).
| Demographics | Rating | Rank | Disability Age 5 to 17 |
| Fijians | 31.7 /100 | #186 | Fair 5.7% |
| Immigrants | Thailand | 30.2 /100 | #187 | Fair 5.7% |
| Marshallese | 28.1 /100 | #188 | Fair 5.7% |
| Pueblo | 27.5 /100 | #189 | Fair 5.7% |
| Immigrants | Eastern Africa | 27.3 /100 | #190 | Fair 5.7% |
| Danes | 26.5 /100 | #191 | Fair 5.7% |
| Immigrants | Bosnia and Herzegovina | 26.3 /100 | #192 | Fair 5.7% |
| Immigrants | Canada | 26.1 /100 | #193 | Fair 5.7% |
| Croatians | 23.6 /100 | #194 | Fair 5.7% |
| Immigrants | Nigeria | 23.4 /100 | #195 | Fair 5.7% |
| Inupiat | 23.3 /100 | #196 | Fair 5.7% |
| Immigrants | North America | 23.1 /100 | #197 | Fair 5.7% |
| Norwegians | 20.9 /100 | #198 | Fair 5.7% |
| Northern Europeans | 15.2 /100 | #199 | Poor 5.7% |
| Icelanders | 14.6 /100 | #200 | Poor 5.7% |
| Basques | 13.7 /100 | #201 | Poor 5.7% |
| Austrians | 13.2 /100 | #202 | Poor 5.7% |
| Spanish American Indians | 12.8 /100 | #203 | Poor 5.7% |
| Paiute | 11.2 /100 | #204 | Poor 5.7% |
| Trinidadians and Tobagonians | 10.8 /100 | #205 | Poor 5.7% |
| Immigrants | Africa | 10.8 /100 | #206 | Poor 5.7% |