Scandinavian vs Immigrants from Spain Self-Care Disability
COMPARE
Scandinavian
Immigrants from Spain
Self-Care Disability
Self-Care Disability Comparison
Scandinavians
Immigrants from Spain
2.4%
SELF-CARE DISABILITY
93.5/ 100
METRIC RATING
112th/ 347
METRIC RANK
2.3%
SELF-CARE DISABILITY
98.7/ 100
METRIC RATING
84th/ 347
METRIC RANK
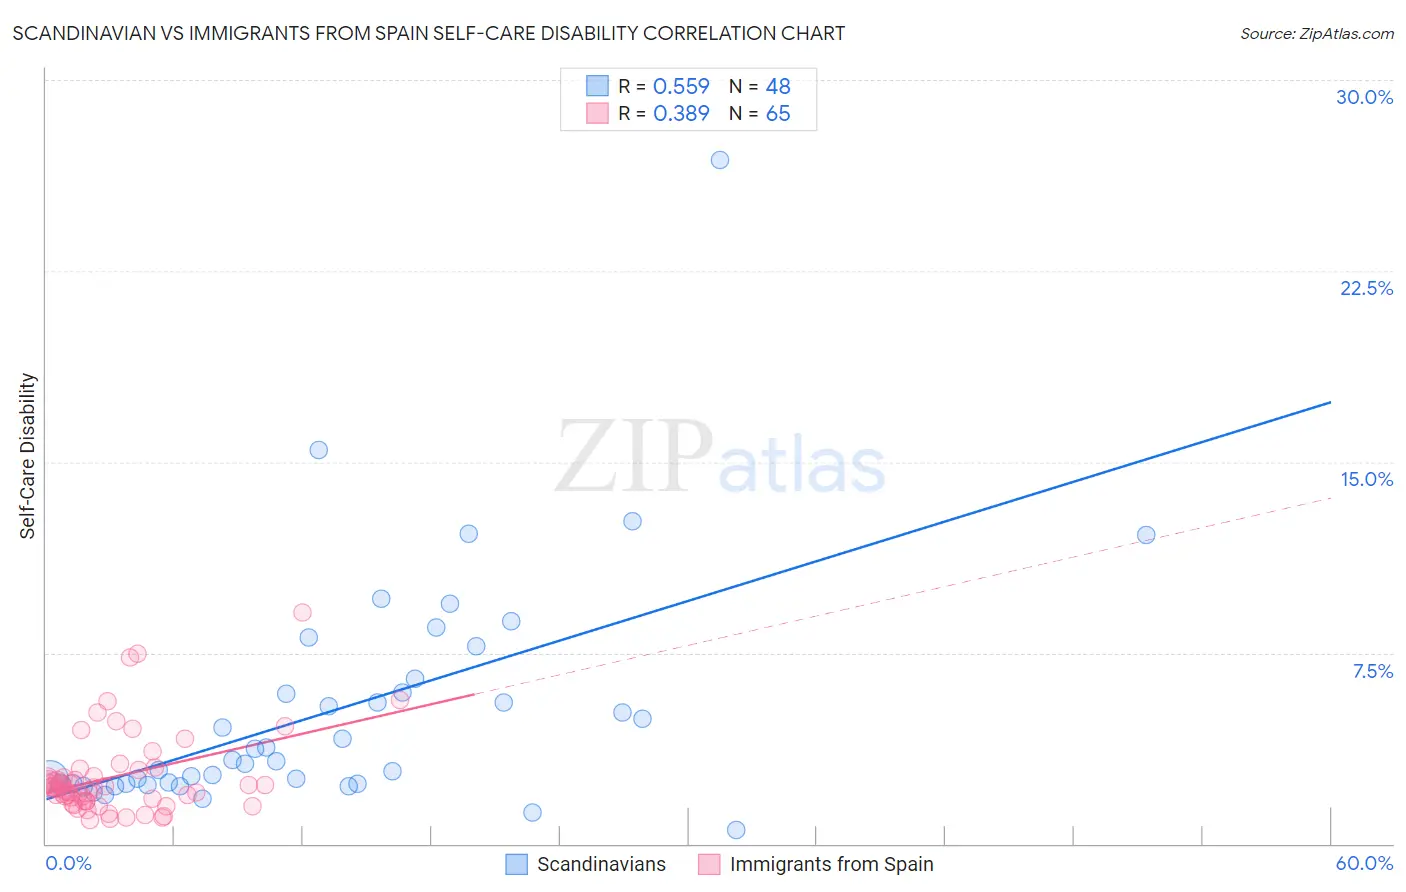
Scandinavian vs Immigrants from Spain Self-Care Disability Correlation Chart
The statistical analysis conducted on geographies consisting of 471,531,720 people shows a substantial positive correlation between the proportion of Scandinavians and percentage of population with self-care disability in the United States with a correlation coefficient (R) of 0.559 and weighted average of 2.4%. Similarly, the statistical analysis conducted on geographies consisting of 239,524,195 people shows a mild positive correlation between the proportion of Immigrants from Spain and percentage of population with self-care disability in the United States with a correlation coefficient (R) of 0.389 and weighted average of 2.3%, a difference of 2.1%.
Self-Care Disability Correlation Summary
| Measurement | Scandinavian | Immigrants from Spain |
| Minimum | 0.56% | 0.91% |
| Maximum | 26.9% | 9.1% |
| Range | 26.3% | 8.2% |
| Mean | 5.2% | 2.6% |
| Median | 3.3% | 2.2% |
| Interquartile 25% (IQ1) | 2.4% | 1.7% |
| Interquartile 75% (IQ3) | 6.2% | 2.8% |
| Interquartile Range (IQR) | 3.9% | 1.1% |
| Standard Deviation (Sample) | 4.7% | 1.6% |
| Standard Deviation (Population) | 4.6% | 1.6% |
Similar Demographics by Self-Care Disability
Demographics Similar to Scandinavians by Self-Care Disability
In terms of self-care disability, the demographic groups most similar to Scandinavians are Serbian (2.4%, a difference of 0.020%), Immigrants from Africa (2.4%, a difference of 0.050%), South American (2.4%, a difference of 0.060%), Immigrants from North Macedonia (2.4%, a difference of 0.070%), and Immigrants from Hong Kong (2.4%, a difference of 0.070%).
| Demographics | Rating | Rank | Self-Care Disability |
| Carpatho Rusyns | 94.4 /100 | #105 | Exceptional 2.4% |
| Immigrants | Indonesia | 94.3 /100 | #106 | Exceptional 2.4% |
| British | 94.3 /100 | #107 | Exceptional 2.4% |
| Greeks | 94.1 /100 | #108 | Exceptional 2.4% |
| Slovenes | 94.1 /100 | #109 | Exceptional 2.4% |
| Immigrants | Africa | 93.7 /100 | #110 | Exceptional 2.4% |
| Serbians | 93.6 /100 | #111 | Exceptional 2.4% |
| Scandinavians | 93.5 /100 | #112 | Exceptional 2.4% |
| South Americans | 93.2 /100 | #113 | Exceptional 2.4% |
| Immigrants | North Macedonia | 93.1 /100 | #114 | Exceptional 2.4% |
| Immigrants | Hong Kong | 93.1 /100 | #115 | Exceptional 2.4% |
| Northern Europeans | 92.9 /100 | #116 | Exceptional 2.4% |
| Taiwanese | 92.5 /100 | #117 | Exceptional 2.4% |
| Immigrants | Canada | 92.0 /100 | #118 | Exceptional 2.4% |
| Immigrants | Sierra Leone | 91.8 /100 | #119 | Exceptional 2.4% |
Demographics Similar to Immigrants from Spain by Self-Care Disability
In terms of self-care disability, the demographic groups most similar to Immigrants from Spain are Indian (Asian) (2.3%, a difference of 0.040%), Immigrants from Denmark (2.3%, a difference of 0.10%), Ugandan (2.3%, a difference of 0.11%), Chilean (2.3%, a difference of 0.17%), and Estonian (2.3%, a difference of 0.34%).
| Demographics | Rating | Rank | Self-Care Disability |
| Immigrants | Middle Africa | 99.0 /100 | #77 | Exceptional 2.3% |
| Immigrants | Ireland | 99.0 /100 | #78 | Exceptional 2.3% |
| Immigrants | Kenya | 99.0 /100 | #79 | Exceptional 2.3% |
| Chileans | 98.8 /100 | #80 | Exceptional 2.3% |
| Ugandans | 98.8 /100 | #81 | Exceptional 2.3% |
| Immigrants | Denmark | 98.8 /100 | #82 | Exceptional 2.3% |
| Indians (Asian) | 98.7 /100 | #83 | Exceptional 2.3% |
| Immigrants | Spain | 98.7 /100 | #84 | Exceptional 2.3% |
| Estonians | 98.3 /100 | #85 | Exceptional 2.3% |
| Immigrants | Northern Africa | 98.2 /100 | #86 | Exceptional 2.3% |
| Sierra Leoneans | 98.0 /100 | #87 | Exceptional 2.4% |
| Lithuanians | 98.0 /100 | #88 | Exceptional 2.4% |
| Immigrants | Congo | 98.0 /100 | #89 | Exceptional 2.4% |
| Immigrants | Czechoslovakia | 97.7 /100 | #90 | Exceptional 2.4% |
| Immigrants | Jordan | 97.7 /100 | #91 | Exceptional 2.4% |