Scandinavian vs Slovak Self-Care Disability
COMPARE
Scandinavian
Slovak
Self-Care Disability
Self-Care Disability Comparison
Scandinavians
Slovaks
2.4%
SELF-CARE DISABILITY
93.5/ 100
METRIC RATING
112th/ 347
METRIC RANK
2.5%
SELF-CARE DISABILITY
12.6/ 100
METRIC RATING
202nd/ 347
METRIC RANK
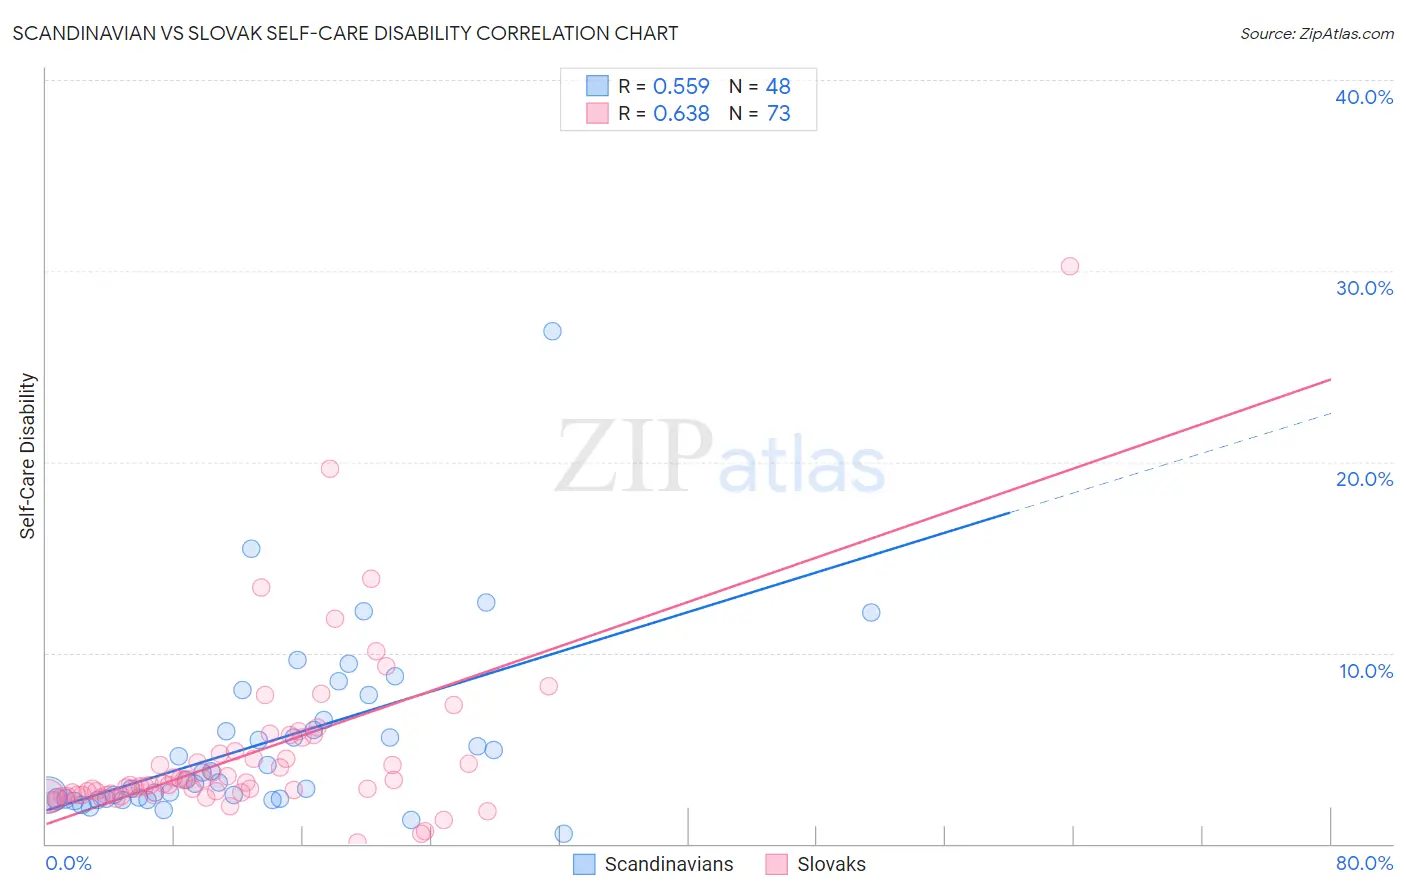
Scandinavian vs Slovak Self-Care Disability Correlation Chart
The statistical analysis conducted on geographies consisting of 471,531,720 people shows a substantial positive correlation between the proportion of Scandinavians and percentage of population with self-care disability in the United States with a correlation coefficient (R) of 0.559 and weighted average of 2.4%. Similarly, the statistical analysis conducted on geographies consisting of 397,370,448 people shows a significant positive correlation between the proportion of Slovaks and percentage of population with self-care disability in the United States with a correlation coefficient (R) of 0.638 and weighted average of 2.5%, a difference of 5.7%.
Self-Care Disability Correlation Summary
| Measurement | Scandinavian | Slovak |
| Minimum | 0.56% | 0.091% |
| Maximum | 26.9% | 30.2% |
| Range | 26.3% | 30.1% |
| Mean | 5.2% | 4.6% |
| Median | 3.3% | 3.1% |
| Interquartile 25% (IQ1) | 2.4% | 2.6% |
| Interquartile 75% (IQ3) | 6.2% | 4.8% |
| Interquartile Range (IQR) | 3.9% | 2.2% |
| Standard Deviation (Sample) | 4.7% | 4.4% |
| Standard Deviation (Population) | 4.6% | 4.4% |
Similar Demographics by Self-Care Disability
Demographics Similar to Scandinavians by Self-Care Disability
In terms of self-care disability, the demographic groups most similar to Scandinavians are Serbian (2.4%, a difference of 0.020%), Immigrants from Africa (2.4%, a difference of 0.050%), South American (2.4%, a difference of 0.060%), Immigrants from North Macedonia (2.4%, a difference of 0.070%), and Immigrants from Hong Kong (2.4%, a difference of 0.070%).
| Demographics | Rating | Rank | Self-Care Disability |
| Carpatho Rusyns | 94.4 /100 | #105 | Exceptional 2.4% |
| Immigrants | Indonesia | 94.3 /100 | #106 | Exceptional 2.4% |
| British | 94.3 /100 | #107 | Exceptional 2.4% |
| Greeks | 94.1 /100 | #108 | Exceptional 2.4% |
| Slovenes | 94.1 /100 | #109 | Exceptional 2.4% |
| Immigrants | Africa | 93.7 /100 | #110 | Exceptional 2.4% |
| Serbians | 93.6 /100 | #111 | Exceptional 2.4% |
| Scandinavians | 93.5 /100 | #112 | Exceptional 2.4% |
| South Americans | 93.2 /100 | #113 | Exceptional 2.4% |
| Immigrants | North Macedonia | 93.1 /100 | #114 | Exceptional 2.4% |
| Immigrants | Hong Kong | 93.1 /100 | #115 | Exceptional 2.4% |
| Northern Europeans | 92.9 /100 | #116 | Exceptional 2.4% |
| Taiwanese | 92.5 /100 | #117 | Exceptional 2.4% |
| Immigrants | Canada | 92.0 /100 | #118 | Exceptional 2.4% |
| Immigrants | Sierra Leone | 91.8 /100 | #119 | Exceptional 2.4% |
Demographics Similar to Slovaks by Self-Care Disability
In terms of self-care disability, the demographic groups most similar to Slovaks are Immigrants from Lebanon (2.5%, a difference of 0.020%), Immigrants from South Eastern Asia (2.5%, a difference of 0.030%), Immigrants from Western Africa (2.5%, a difference of 0.070%), Immigrants from Bahamas (2.5%, a difference of 0.080%), and Immigrants from Russia (2.5%, a difference of 0.18%).
| Demographics | Rating | Rank | Self-Care Disability |
| Immigrants | Southern Europe | 15.6 /100 | #195 | Poor 2.5% |
| Koreans | 15.5 /100 | #196 | Poor 2.5% |
| Crow | 15.2 /100 | #197 | Poor 2.5% |
| Immigrants | Immigrants | 15.0 /100 | #198 | Poor 2.5% |
| Immigrants | Ghana | 14.7 /100 | #199 | Poor 2.5% |
| Immigrants | Western Africa | 13.3 /100 | #200 | Poor 2.5% |
| Immigrants | South Eastern Asia | 12.9 /100 | #201 | Poor 2.5% |
| Slovaks | 12.6 /100 | #202 | Poor 2.5% |
| Immigrants | Lebanon | 12.4 /100 | #203 | Poor 2.5% |
| Immigrants | Bahamas | 11.9 /100 | #204 | Poor 2.5% |
| Immigrants | Russia | 11.0 /100 | #205 | Poor 2.5% |
| Alaskan Athabascans | 10.4 /100 | #206 | Poor 2.5% |
| French | 9.9 /100 | #207 | Tragic 2.5% |
| Central Americans | 8.7 /100 | #208 | Tragic 2.5% |
| Malaysians | 7.7 /100 | #209 | Tragic 2.5% |