Scandinavian vs Dominican Self-Care Disability
COMPARE
Scandinavian
Dominican
Self-Care Disability
Self-Care Disability Comparison
Scandinavians
Dominicans
2.4%
SELF-CARE DISABILITY
93.5/ 100
METRIC RATING
112th/ 347
METRIC RANK
3.1%
SELF-CARE DISABILITY
0.0/ 100
METRIC RATING
341st/ 347
METRIC RANK
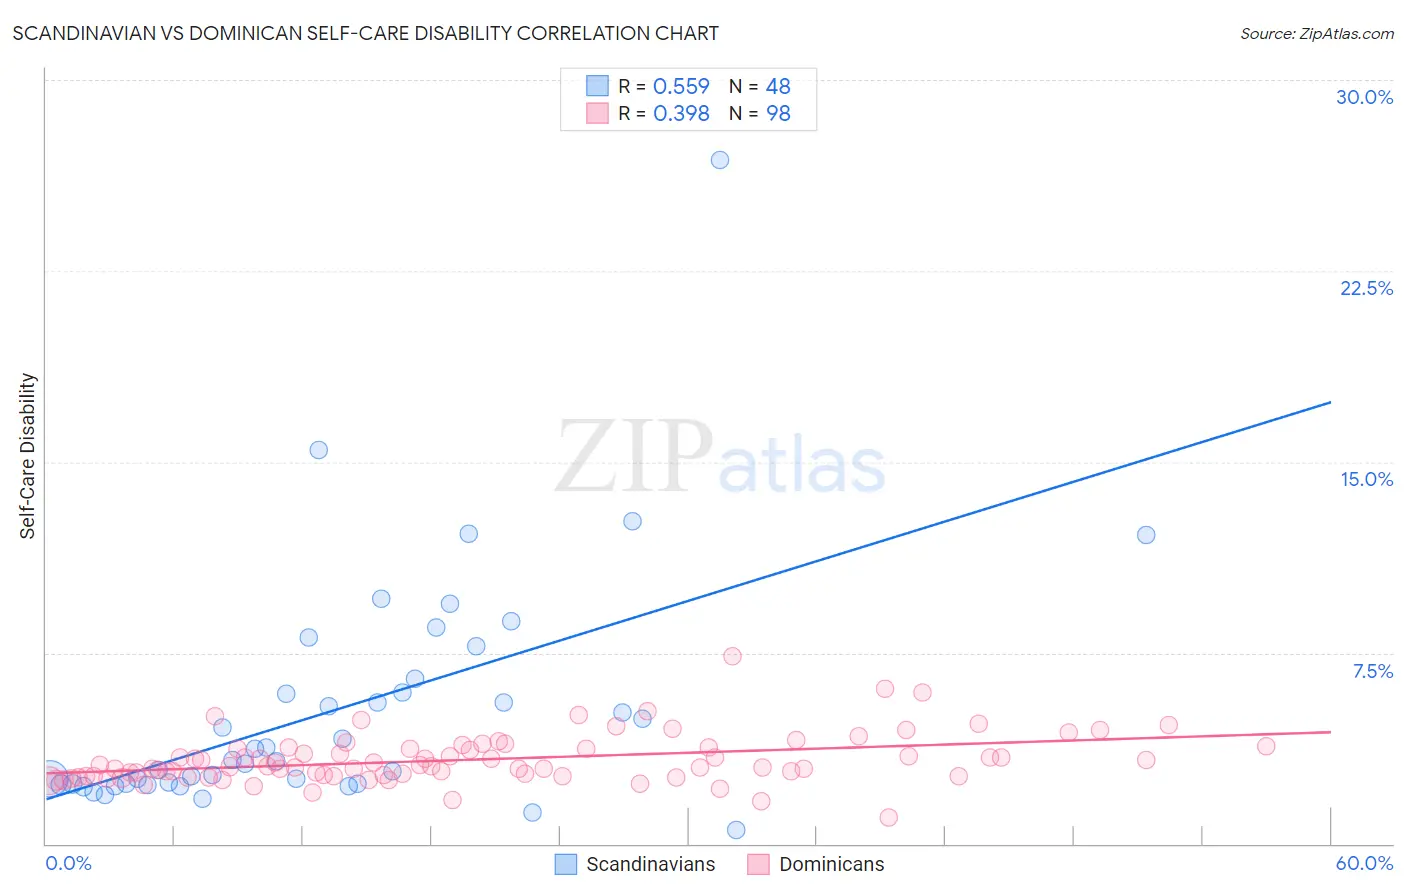
Scandinavian vs Dominican Self-Care Disability Correlation Chart
The statistical analysis conducted on geographies consisting of 471,531,720 people shows a substantial positive correlation between the proportion of Scandinavians and percentage of population with self-care disability in the United States with a correlation coefficient (R) of 0.559 and weighted average of 2.4%. Similarly, the statistical analysis conducted on geographies consisting of 354,514,623 people shows a mild positive correlation between the proportion of Dominicans and percentage of population with self-care disability in the United States with a correlation coefficient (R) of 0.398 and weighted average of 3.1%, a difference of 28.3%.
Self-Care Disability Correlation Summary
| Measurement | Scandinavian | Dominican |
| Minimum | 0.56% | 1.0% |
| Maximum | 26.9% | 7.4% |
| Range | 26.3% | 6.3% |
| Mean | 5.2% | 3.3% |
| Median | 3.3% | 3.0% |
| Interquartile 25% (IQ1) | 2.4% | 2.7% |
| Interquartile 75% (IQ3) | 6.2% | 3.7% |
| Interquartile Range (IQR) | 3.9% | 1.1% |
| Standard Deviation (Sample) | 4.7% | 0.96% |
| Standard Deviation (Population) | 4.6% | 0.96% |
Similar Demographics by Self-Care Disability
Demographics Similar to Scandinavians by Self-Care Disability
In terms of self-care disability, the demographic groups most similar to Scandinavians are Serbian (2.4%, a difference of 0.020%), Immigrants from Africa (2.4%, a difference of 0.050%), South American (2.4%, a difference of 0.060%), Immigrants from North Macedonia (2.4%, a difference of 0.070%), and Immigrants from Hong Kong (2.4%, a difference of 0.070%).
| Demographics | Rating | Rank | Self-Care Disability |
| Carpatho Rusyns | 94.4 /100 | #105 | Exceptional 2.4% |
| Immigrants | Indonesia | 94.3 /100 | #106 | Exceptional 2.4% |
| British | 94.3 /100 | #107 | Exceptional 2.4% |
| Greeks | 94.1 /100 | #108 | Exceptional 2.4% |
| Slovenes | 94.1 /100 | #109 | Exceptional 2.4% |
| Immigrants | Africa | 93.7 /100 | #110 | Exceptional 2.4% |
| Serbians | 93.6 /100 | #111 | Exceptional 2.4% |
| Scandinavians | 93.5 /100 | #112 | Exceptional 2.4% |
| South Americans | 93.2 /100 | #113 | Exceptional 2.4% |
| Immigrants | North Macedonia | 93.1 /100 | #114 | Exceptional 2.4% |
| Immigrants | Hong Kong | 93.1 /100 | #115 | Exceptional 2.4% |
| Northern Europeans | 92.9 /100 | #116 | Exceptional 2.4% |
| Taiwanese | 92.5 /100 | #117 | Exceptional 2.4% |
| Immigrants | Canada | 92.0 /100 | #118 | Exceptional 2.4% |
| Immigrants | Sierra Leone | 91.8 /100 | #119 | Exceptional 2.4% |
Demographics Similar to Dominicans by Self-Care Disability
In terms of self-care disability, the demographic groups most similar to Dominicans are Immigrants from Cabo Verde (3.1%, a difference of 0.26%), Immigrants from Dominican Republic (3.0%, a difference of 0.59%), Cape Verdean (3.0%, a difference of 0.98%), Choctaw (3.0%, a difference of 1.3%), and Colville (3.1%, a difference of 1.6%).
| Demographics | Rating | Rank | Self-Care Disability |
| Dutch West Indians | 0.0 /100 | #333 | Tragic 3.0% |
| Houma | 0.0 /100 | #334 | Tragic 3.0% |
| Immigrants | Azores | 0.0 /100 | #335 | Tragic 3.0% |
| Immigrants | Yemen | 0.0 /100 | #336 | Tragic 3.0% |
| Choctaw | 0.0 /100 | #337 | Tragic 3.0% |
| Cape Verdeans | 0.0 /100 | #338 | Tragic 3.0% |
| Immigrants | Dominican Republic | 0.0 /100 | #339 | Tragic 3.0% |
| Immigrants | Cabo Verde | 0.0 /100 | #340 | Tragic 3.1% |
| Dominicans | 0.0 /100 | #341 | Tragic 3.1% |
| Colville | 0.0 /100 | #342 | Tragic 3.1% |
| Tohono O'odham | 0.0 /100 | #343 | Tragic 3.1% |
| Pueblo | 0.0 /100 | #344 | Tragic 3.3% |
| Armenians | 0.0 /100 | #345 | Tragic 3.4% |
| Puerto Ricans | 0.0 /100 | #346 | Tragic 3.7% |
| Immigrants | Armenia | 0.0 /100 | #347 | Tragic 4.2% |