Scandinavian vs Salvadoran Self-Care Disability
COMPARE
Scandinavian
Salvadoran
Self-Care Disability
Self-Care Disability Comparison
Scandinavians
Salvadorans
2.4%
SELF-CARE DISABILITY
93.5/ 100
METRIC RATING
112th/ 347
METRIC RANK
2.5%
SELF-CARE DISABILITY
36.4/ 100
METRIC RATING
183rd/ 347
METRIC RANK
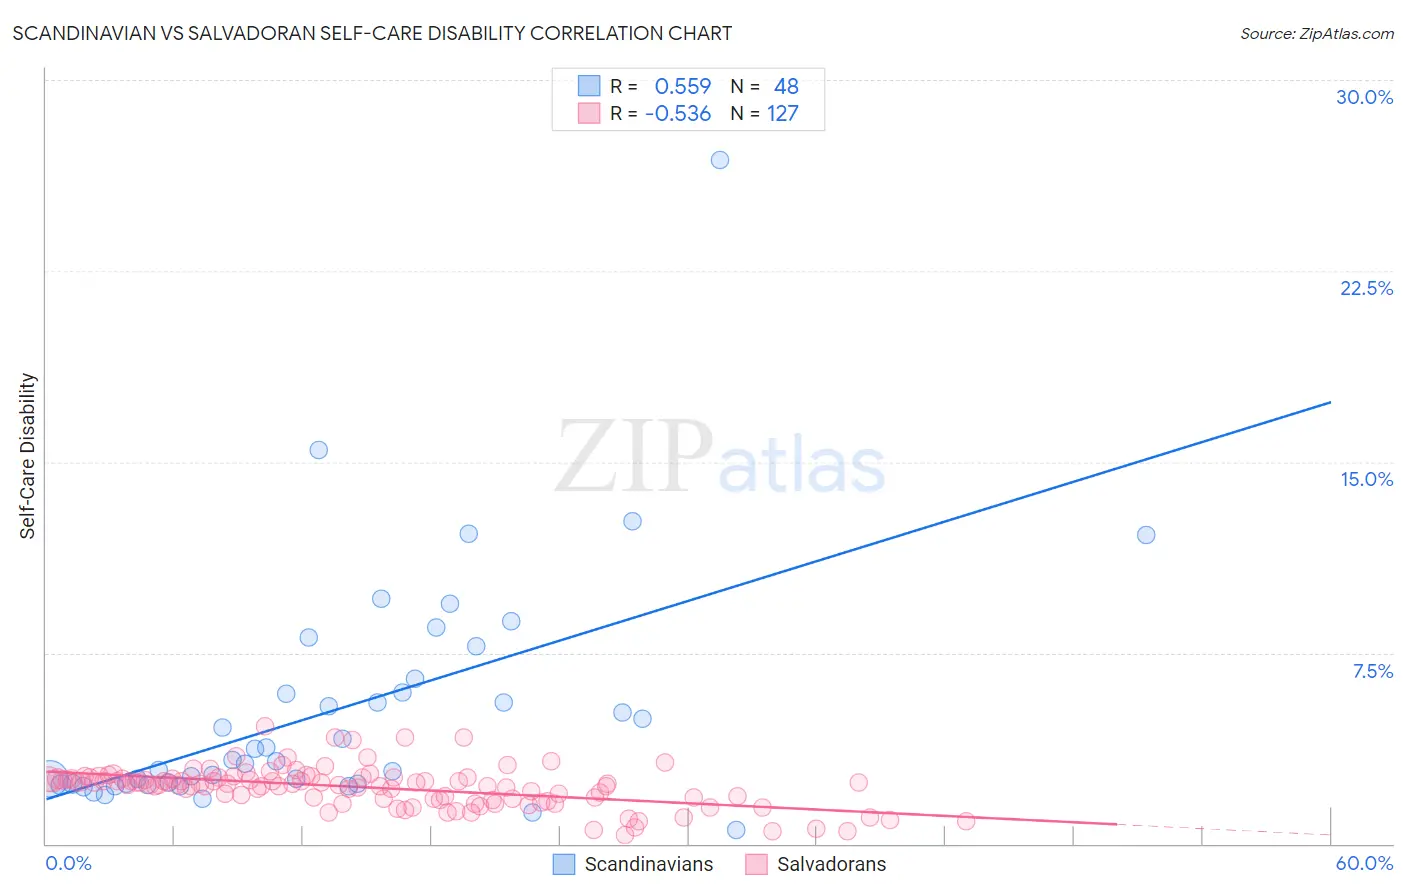
Scandinavian vs Salvadoran Self-Care Disability Correlation Chart
The statistical analysis conducted on geographies consisting of 471,531,720 people shows a substantial positive correlation between the proportion of Scandinavians and percentage of population with self-care disability in the United States with a correlation coefficient (R) of 0.559 and weighted average of 2.4%. Similarly, the statistical analysis conducted on geographies consisting of 398,444,194 people shows a substantial negative correlation between the proportion of Salvadorans and percentage of population with self-care disability in the United States with a correlation coefficient (R) of -0.536 and weighted average of 2.5%, a difference of 4.0%.
Self-Care Disability Correlation Summary
| Measurement | Scandinavian | Salvadoran |
| Minimum | 0.56% | 0.35% |
| Maximum | 26.9% | 4.6% |
| Range | 26.3% | 4.3% |
| Mean | 5.2% | 2.2% |
| Median | 3.3% | 2.3% |
| Interquartile 25% (IQ1) | 2.4% | 1.8% |
| Interquartile 75% (IQ3) | 6.2% | 2.6% |
| Interquartile Range (IQR) | 3.9% | 0.81% |
| Standard Deviation (Sample) | 4.7% | 0.78% |
| Standard Deviation (Population) | 4.6% | 0.77% |
Similar Demographics by Self-Care Disability
Demographics Similar to Scandinavians by Self-Care Disability
In terms of self-care disability, the demographic groups most similar to Scandinavians are Serbian (2.4%, a difference of 0.020%), Immigrants from Africa (2.4%, a difference of 0.050%), South American (2.4%, a difference of 0.060%), Immigrants from North Macedonia (2.4%, a difference of 0.070%), and Immigrants from Hong Kong (2.4%, a difference of 0.070%).
| Demographics | Rating | Rank | Self-Care Disability |
| Carpatho Rusyns | 94.4 /100 | #105 | Exceptional 2.4% |
| Immigrants | Indonesia | 94.3 /100 | #106 | Exceptional 2.4% |
| British | 94.3 /100 | #107 | Exceptional 2.4% |
| Greeks | 94.1 /100 | #108 | Exceptional 2.4% |
| Slovenes | 94.1 /100 | #109 | Exceptional 2.4% |
| Immigrants | Africa | 93.7 /100 | #110 | Exceptional 2.4% |
| Serbians | 93.6 /100 | #111 | Exceptional 2.4% |
| Scandinavians | 93.5 /100 | #112 | Exceptional 2.4% |
| South Americans | 93.2 /100 | #113 | Exceptional 2.4% |
| Immigrants | North Macedonia | 93.1 /100 | #114 | Exceptional 2.4% |
| Immigrants | Hong Kong | 93.1 /100 | #115 | Exceptional 2.4% |
| Northern Europeans | 92.9 /100 | #116 | Exceptional 2.4% |
| Taiwanese | 92.5 /100 | #117 | Exceptional 2.4% |
| Immigrants | Canada | 92.0 /100 | #118 | Exceptional 2.4% |
| Immigrants | Sierra Leone | 91.8 /100 | #119 | Exceptional 2.4% |
Demographics Similar to Salvadorans by Self-Care Disability
In terms of self-care disability, the demographic groups most similar to Salvadorans are Yugoslavian (2.5%, a difference of 0.020%), Maltese (2.5%, a difference of 0.050%), Slavic (2.5%, a difference of 0.11%), Immigrants from El Salvador (2.5%, a difference of 0.18%), and Ghanaian (2.5%, a difference of 0.20%).
| Demographics | Rating | Rank | Self-Care Disability |
| Immigrants | Afghanistan | 47.6 /100 | #176 | Average 2.5% |
| Immigrants | Kazakhstan | 46.7 /100 | #177 | Average 2.5% |
| English | 46.2 /100 | #178 | Average 2.5% |
| Hungarians | 45.5 /100 | #179 | Average 2.5% |
| Indonesians | 41.2 /100 | #180 | Average 2.5% |
| Ghanaians | 40.4 /100 | #181 | Average 2.5% |
| Maltese | 37.5 /100 | #182 | Fair 2.5% |
| Salvadorans | 36.4 /100 | #183 | Fair 2.5% |
| Yugoslavians | 36.1 /100 | #184 | Fair 2.5% |
| Slavs | 34.3 /100 | #185 | Fair 2.5% |
| Immigrants | El Salvador | 33.0 /100 | #186 | Fair 2.5% |
| Irish | 28.7 /100 | #187 | Fair 2.5% |
| Immigrants | Oceania | 28.3 /100 | #188 | Fair 2.5% |
| Immigrants | Eastern Europe | 28.0 /100 | #189 | Fair 2.5% |
| Sioux | 24.6 /100 | #190 | Fair 2.5% |