Immigrants from Syria vs Argentinean Disability Age 5 to 17
COMPARE
Immigrants from Syria
Argentinean
Disability Age 5 to 17
Disability Age 5 to 17 Comparison
Immigrants from Syria
Argentineans
5.2%
DISABILITY AGE 5 TO 17
99.7/ 100
METRIC RATING
68th/ 347
METRIC RANK
5.1%
DISABILITY AGE 5 TO 17
99.9/ 100
METRIC RATING
50th/ 347
METRIC RANK
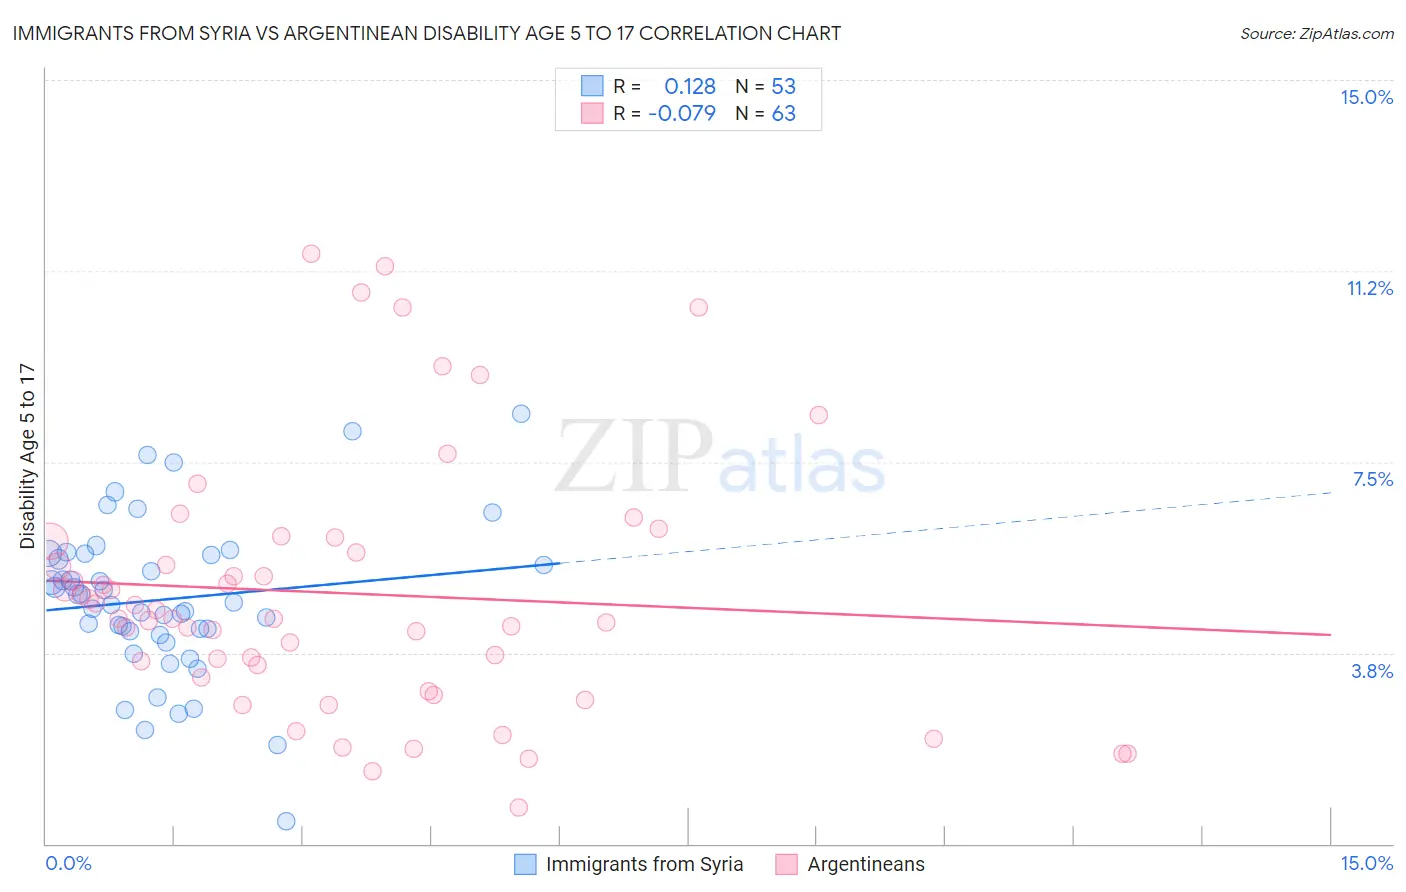
Immigrants from Syria vs Argentinean Disability Age 5 to 17 Correlation Chart
The statistical analysis conducted on geographies consisting of 173,683,578 people shows a poor positive correlation between the proportion of Immigrants from Syria and percentage of population with a disability between the ages 5 and 17 in the United States with a correlation coefficient (R) of 0.128 and weighted average of 5.2%. Similarly, the statistical analysis conducted on geographies consisting of 295,397,898 people shows a slight negative correlation between the proportion of Argentineans and percentage of population with a disability between the ages 5 and 17 in the United States with a correlation coefficient (R) of -0.079 and weighted average of 5.1%, a difference of 2.0%.
Disability Age 5 to 17 Correlation Summary
| Measurement | Immigrants from Syria | Argentinean |
| Minimum | 0.44% | 0.71% |
| Maximum | 8.4% | 11.6% |
| Range | 8.0% | 10.9% |
| Mean | 4.8% | 4.9% |
| Median | 4.7% | 4.4% |
| Interquartile 25% (IQ1) | 4.1% | 3.3% |
| Interquartile 75% (IQ3) | 5.7% | 5.9% |
| Interquartile Range (IQR) | 1.5% | 2.7% |
| Standard Deviation (Sample) | 1.5% | 2.5% |
| Standard Deviation (Population) | 1.5% | 2.5% |
Demographics Similar to Immigrants from Syria and Argentineans by Disability Age 5 to 17
In terms of disability age 5 to 17, the demographic groups most similar to Immigrants from Syria are Guyanese (5.2%, a difference of 0.11%), Macedonian (5.2%, a difference of 0.14%), Palestinian (5.2%, a difference of 0.17%), Immigrants from Greece (5.2%, a difference of 0.21%), and Immigrants from South Eastern Asia (5.2%, a difference of 0.22%). Similarly, the demographic groups most similar to Argentineans are Turkish (5.1%, a difference of 0.29%), Immigrants from Fiji (5.1%, a difference of 0.38%), Immigrants from Western Asia (5.1%, a difference of 0.41%), Immigrants from Lithuania (5.1%, a difference of 0.44%), and Paraguayan (5.1%, a difference of 0.47%).
| Demographics | Rating | Rank | Disability Age 5 to 17 |
| Immigrants | Western Asia | 100.0 /100 | #49 | Exceptional 5.1% |
| Argentineans | 99.9 /100 | #50 | Exceptional 5.1% |
| Turks | 99.9 /100 | #51 | Exceptional 5.1% |
| Immigrants | Fiji | 99.9 /100 | #52 | Exceptional 5.1% |
| Immigrants | Lithuania | 99.9 /100 | #53 | Exceptional 5.1% |
| Paraguayans | 99.9 /100 | #54 | Exceptional 5.1% |
| Laotians | 99.9 /100 | #55 | Exceptional 5.1% |
| Immigrants | Turkey | 99.9 /100 | #56 | Exceptional 5.1% |
| Immigrants | Poland | 99.9 /100 | #57 | Exceptional 5.1% |
| Immigrants | Ukraine | 99.9 /100 | #58 | Exceptional 5.1% |
| Immigrants | North Macedonia | 99.9 /100 | #59 | Exceptional 5.1% |
| Immigrants | Eastern Europe | 99.9 /100 | #60 | Exceptional 5.1% |
| Immigrants | Switzerland | 99.8 /100 | #61 | Exceptional 5.2% |
| Immigrants | Ireland | 99.8 /100 | #62 | Exceptional 5.2% |
| Immigrants | Bangladesh | 99.8 /100 | #63 | Exceptional 5.2% |
| Immigrants | South Eastern Asia | 99.8 /100 | #64 | Exceptional 5.2% |
| Immigrants | Greece | 99.8 /100 | #65 | Exceptional 5.2% |
| Palestinians | 99.8 /100 | #66 | Exceptional 5.2% |
| Macedonians | 99.8 /100 | #67 | Exceptional 5.2% |
| Immigrants | Syria | 99.7 /100 | #68 | Exceptional 5.2% |
| Guyanese | 99.7 /100 | #69 | Exceptional 5.2% |