Immigrants from Syria vs Immigrants from Canada Disability Age 5 to 17
COMPARE
Immigrants from Syria
Immigrants from Canada
Disability Age 5 to 17
Disability Age 5 to 17 Comparison
Immigrants from Syria
Immigrants from Canada
5.2%
DISABILITY AGE 5 TO 17
99.7/ 100
METRIC RATING
68th/ 347
METRIC RANK
5.7%
DISABILITY AGE 5 TO 17
26.1/ 100
METRIC RATING
193rd/ 347
METRIC RANK
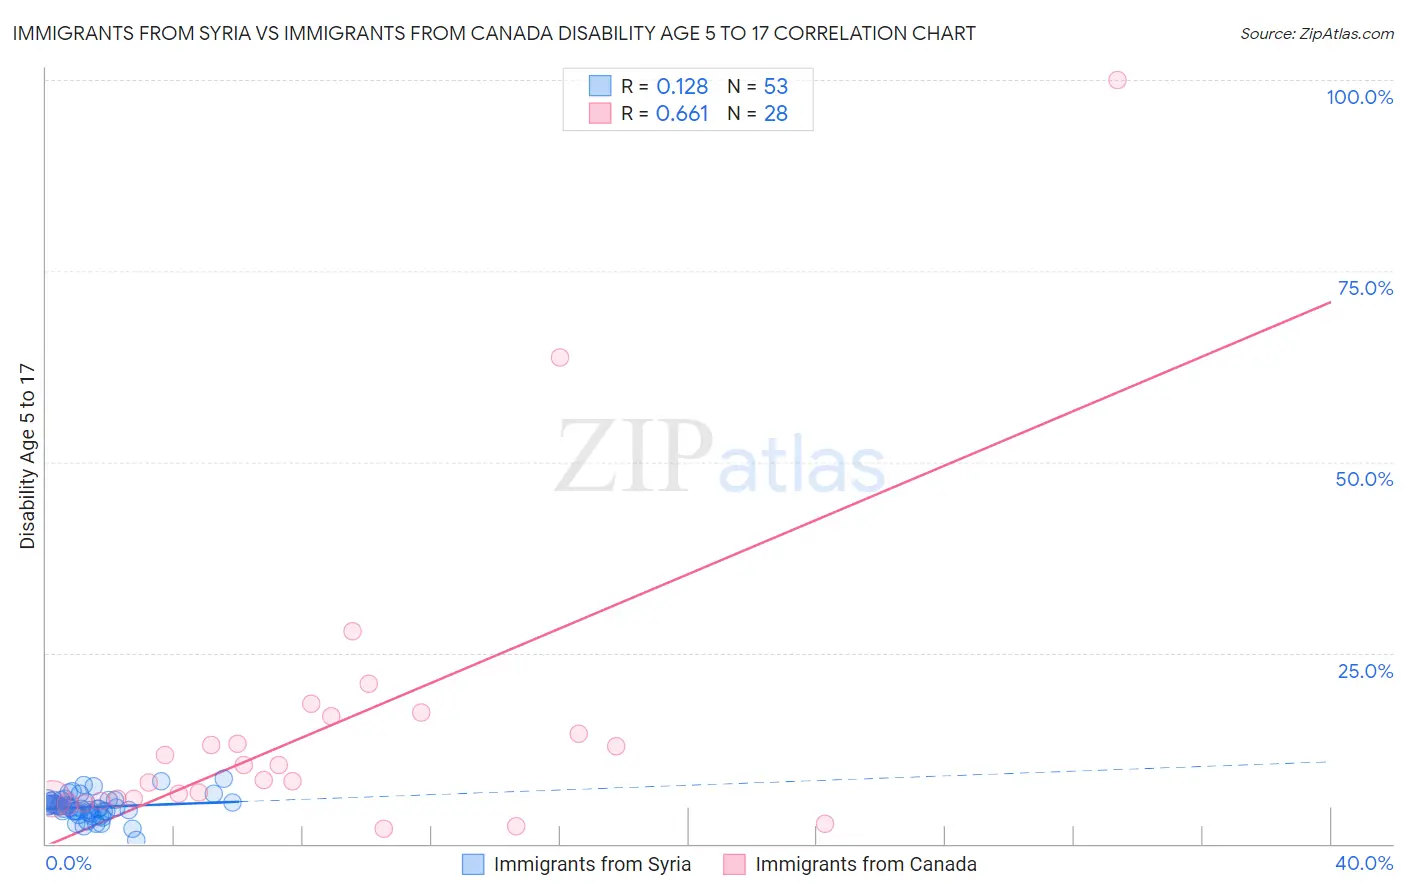
Immigrants from Syria vs Immigrants from Canada Disability Age 5 to 17 Correlation Chart
The statistical analysis conducted on geographies consisting of 173,683,578 people shows a poor positive correlation between the proportion of Immigrants from Syria and percentage of population with a disability between the ages 5 and 17 in the United States with a correlation coefficient (R) of 0.128 and weighted average of 5.2%. Similarly, the statistical analysis conducted on geographies consisting of 453,688,355 people shows a significant positive correlation between the proportion of Immigrants from Canada and percentage of population with a disability between the ages 5 and 17 in the United States with a correlation coefficient (R) of 0.661 and weighted average of 5.7%, a difference of 9.3%.
Disability Age 5 to 17 Correlation Summary
| Measurement | Immigrants from Syria | Immigrants from Canada |
| Minimum | 0.44% | 1.9% |
| Maximum | 8.4% | 100.0% |
| Range | 8.0% | 98.1% |
| Mean | 4.8% | 15.3% |
| Median | 4.7% | 9.3% |
| Interquartile 25% (IQ1) | 4.1% | 5.9% |
| Interquartile 75% (IQ3) | 5.7% | 15.6% |
| Interquartile Range (IQR) | 1.5% | 9.7% |
| Standard Deviation (Sample) | 1.5% | 20.3% |
| Standard Deviation (Population) | 1.5% | 20.0% |
Similar Demographics by Disability Age 5 to 17
Demographics Similar to Immigrants from Syria by Disability Age 5 to 17
In terms of disability age 5 to 17, the demographic groups most similar to Immigrants from Syria are Guyanese (5.2%, a difference of 0.11%), Macedonian (5.2%, a difference of 0.14%), Immigrants from Belgium (5.2%, a difference of 0.15%), Palestinian (5.2%, a difference of 0.17%), and Jordanian (5.2%, a difference of 0.20%).
| Demographics | Rating | Rank | Disability Age 5 to 17 |
| Immigrants | Switzerland | 99.8 /100 | #61 | Exceptional 5.2% |
| Immigrants | Ireland | 99.8 /100 | #62 | Exceptional 5.2% |
| Immigrants | Bangladesh | 99.8 /100 | #63 | Exceptional 5.2% |
| Immigrants | South Eastern Asia | 99.8 /100 | #64 | Exceptional 5.2% |
| Immigrants | Greece | 99.8 /100 | #65 | Exceptional 5.2% |
| Palestinians | 99.8 /100 | #66 | Exceptional 5.2% |
| Macedonians | 99.8 /100 | #67 | Exceptional 5.2% |
| Immigrants | Syria | 99.7 /100 | #68 | Exceptional 5.2% |
| Guyanese | 99.7 /100 | #69 | Exceptional 5.2% |
| Immigrants | Belgium | 99.7 /100 | #70 | Exceptional 5.2% |
| Jordanians | 99.7 /100 | #71 | Exceptional 5.2% |
| Immigrants | Vietnam | 99.7 /100 | #72 | Exceptional 5.2% |
| Immigrants | Czechoslovakia | 99.7 /100 | #73 | Exceptional 5.2% |
| Immigrants | Romania | 99.7 /100 | #74 | Exceptional 5.2% |
| Immigrants | Moldova | 99.6 /100 | #75 | Exceptional 5.2% |
Demographics Similar to Immigrants from Canada by Disability Age 5 to 17
In terms of disability age 5 to 17, the demographic groups most similar to Immigrants from Canada are Immigrants from Bosnia and Herzegovina (5.7%, a difference of 0.010%), Danish (5.7%, a difference of 0.030%), Immigrants from Eastern Africa (5.7%, a difference of 0.080%), Pueblo (5.7%, a difference of 0.090%), and Marshallese (5.7%, a difference of 0.13%).
| Demographics | Rating | Rank | Disability Age 5 to 17 |
| Fijians | 31.7 /100 | #186 | Fair 5.7% |
| Immigrants | Thailand | 30.2 /100 | #187 | Fair 5.7% |
| Marshallese | 28.1 /100 | #188 | Fair 5.7% |
| Pueblo | 27.5 /100 | #189 | Fair 5.7% |
| Immigrants | Eastern Africa | 27.3 /100 | #190 | Fair 5.7% |
| Danes | 26.5 /100 | #191 | Fair 5.7% |
| Immigrants | Bosnia and Herzegovina | 26.3 /100 | #192 | Fair 5.7% |
| Immigrants | Canada | 26.1 /100 | #193 | Fair 5.7% |
| Croatians | 23.6 /100 | #194 | Fair 5.7% |
| Immigrants | Nigeria | 23.4 /100 | #195 | Fair 5.7% |
| Inupiat | 23.3 /100 | #196 | Fair 5.7% |
| Immigrants | North America | 23.1 /100 | #197 | Fair 5.7% |
| Norwegians | 20.9 /100 | #198 | Fair 5.7% |
| Northern Europeans | 15.2 /100 | #199 | Poor 5.7% |
| Icelanders | 14.6 /100 | #200 | Poor 5.7% |