Immigrants from Syria vs Okinawan Disability Age 5 to 17
COMPARE
Immigrants from Syria
Okinawan
Disability Age 5 to 17
Disability Age 5 to 17 Comparison
Immigrants from Syria
Okinawans
5.2%
DISABILITY AGE 5 TO 17
99.7/ 100
METRIC RATING
68th/ 347
METRIC RANK
5.0%
DISABILITY AGE 5 TO 17
100.0/ 100
METRIC RATING
40th/ 347
METRIC RANK
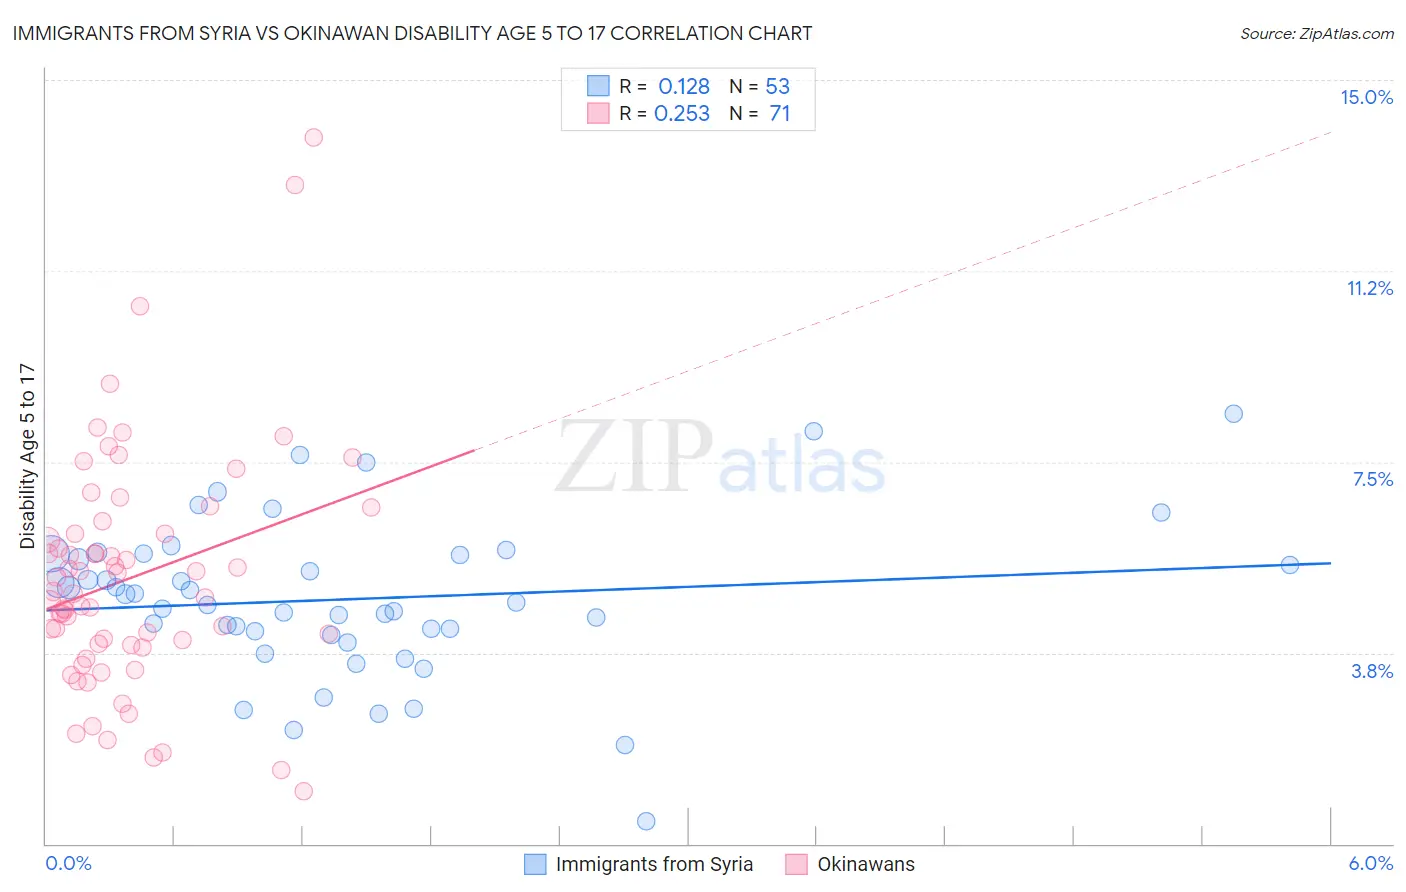
Immigrants from Syria vs Okinawan Disability Age 5 to 17 Correlation Chart
The statistical analysis conducted on geographies consisting of 173,683,578 people shows a poor positive correlation between the proportion of Immigrants from Syria and percentage of population with a disability between the ages 5 and 17 in the United States with a correlation coefficient (R) of 0.128 and weighted average of 5.2%. Similarly, the statistical analysis conducted on geographies consisting of 73,585,145 people shows a weak positive correlation between the proportion of Okinawans and percentage of population with a disability between the ages 5 and 17 in the United States with a correlation coefficient (R) of 0.253 and weighted average of 5.0%, a difference of 3.5%.
Disability Age 5 to 17 Correlation Summary
| Measurement | Immigrants from Syria | Okinawan |
| Minimum | 0.44% | 1.0% |
| Maximum | 8.4% | 13.9% |
| Range | 8.0% | 12.8% |
| Mean | 4.8% | 5.2% |
| Median | 4.7% | 4.9% |
| Interquartile 25% (IQ1) | 4.1% | 3.9% |
| Interquartile 75% (IQ3) | 5.7% | 6.1% |
| Interquartile Range (IQR) | 1.5% | 2.2% |
| Standard Deviation (Sample) | 1.5% | 2.3% |
| Standard Deviation (Population) | 1.5% | 2.3% |
Similar Demographics by Disability Age 5 to 17
Demographics Similar to Immigrants from Syria by Disability Age 5 to 17
In terms of disability age 5 to 17, the demographic groups most similar to Immigrants from Syria are Guyanese (5.2%, a difference of 0.11%), Macedonian (5.2%, a difference of 0.14%), Immigrants from Belgium (5.2%, a difference of 0.15%), Palestinian (5.2%, a difference of 0.17%), and Jordanian (5.2%, a difference of 0.20%).
| Demographics | Rating | Rank | Disability Age 5 to 17 |
| Immigrants | Switzerland | 99.8 /100 | #61 | Exceptional 5.2% |
| Immigrants | Ireland | 99.8 /100 | #62 | Exceptional 5.2% |
| Immigrants | Bangladesh | 99.8 /100 | #63 | Exceptional 5.2% |
| Immigrants | South Eastern Asia | 99.8 /100 | #64 | Exceptional 5.2% |
| Immigrants | Greece | 99.8 /100 | #65 | Exceptional 5.2% |
| Palestinians | 99.8 /100 | #66 | Exceptional 5.2% |
| Macedonians | 99.8 /100 | #67 | Exceptional 5.2% |
| Immigrants | Syria | 99.7 /100 | #68 | Exceptional 5.2% |
| Guyanese | 99.7 /100 | #69 | Exceptional 5.2% |
| Immigrants | Belgium | 99.7 /100 | #70 | Exceptional 5.2% |
| Jordanians | 99.7 /100 | #71 | Exceptional 5.2% |
| Immigrants | Vietnam | 99.7 /100 | #72 | Exceptional 5.2% |
| Immigrants | Czechoslovakia | 99.7 /100 | #73 | Exceptional 5.2% |
| Immigrants | Romania | 99.7 /100 | #74 | Exceptional 5.2% |
| Immigrants | Moldova | 99.6 /100 | #75 | Exceptional 5.2% |
Demographics Similar to Okinawans by Disability Age 5 to 17
In terms of disability age 5 to 17, the demographic groups most similar to Okinawans are Immigrants from Argentina (5.0%, a difference of 0.080%), Immigrants from Australia (5.0%, a difference of 0.080%), Immigrants from Philippines (5.0%, a difference of 0.090%), Immigrants from Sri Lanka (5.0%, a difference of 0.090%), and Immigrants from Belarus (5.0%, a difference of 0.13%).
| Demographics | Rating | Rank | Disability Age 5 to 17 |
| Immigrants | Indonesia | 100.0 /100 | #33 | Exceptional 5.0% |
| Israelis | 100.0 /100 | #34 | Exceptional 5.0% |
| Bolivians | 100.0 /100 | #35 | Exceptional 5.0% |
| Immigrants | Egypt | 100.0 /100 | #36 | Exceptional 5.0% |
| Immigrants | Belarus | 100.0 /100 | #37 | Exceptional 5.0% |
| Immigrants | Philippines | 100.0 /100 | #38 | Exceptional 5.0% |
| Immigrants | Argentina | 100.0 /100 | #39 | Exceptional 5.0% |
| Okinawans | 100.0 /100 | #40 | Exceptional 5.0% |
| Immigrants | Australia | 100.0 /100 | #41 | Exceptional 5.0% |
| Immigrants | Sri Lanka | 100.0 /100 | #42 | Exceptional 5.0% |
| Immigrants | Russia | 100.0 /100 | #43 | Exceptional 5.0% |
| Egyptians | 100.0 /100 | #44 | Exceptional 5.0% |
| Tongans | 100.0 /100 | #45 | Exceptional 5.0% |
| Assyrians/Chaldeans/Syriacs | 100.0 /100 | #46 | Exceptional 5.0% |
| Vietnamese | 100.0 /100 | #47 | Exceptional 5.1% |