Immigrants from Central America vs Immigrants from Italy Disability Age 5 to 17
COMPARE
Immigrants from Central America
Immigrants from Italy
Disability Age 5 to 17
Disability Age 5 to 17 Comparison
Immigrants from Central America
Immigrants from Italy
5.6%
DISABILITY AGE 5 TO 17
49.4/ 100
METRIC RATING
176th/ 347
METRIC RANK
5.3%
DISABILITY AGE 5 TO 17
98.4/ 100
METRIC RATING
105th/ 347
METRIC RANK
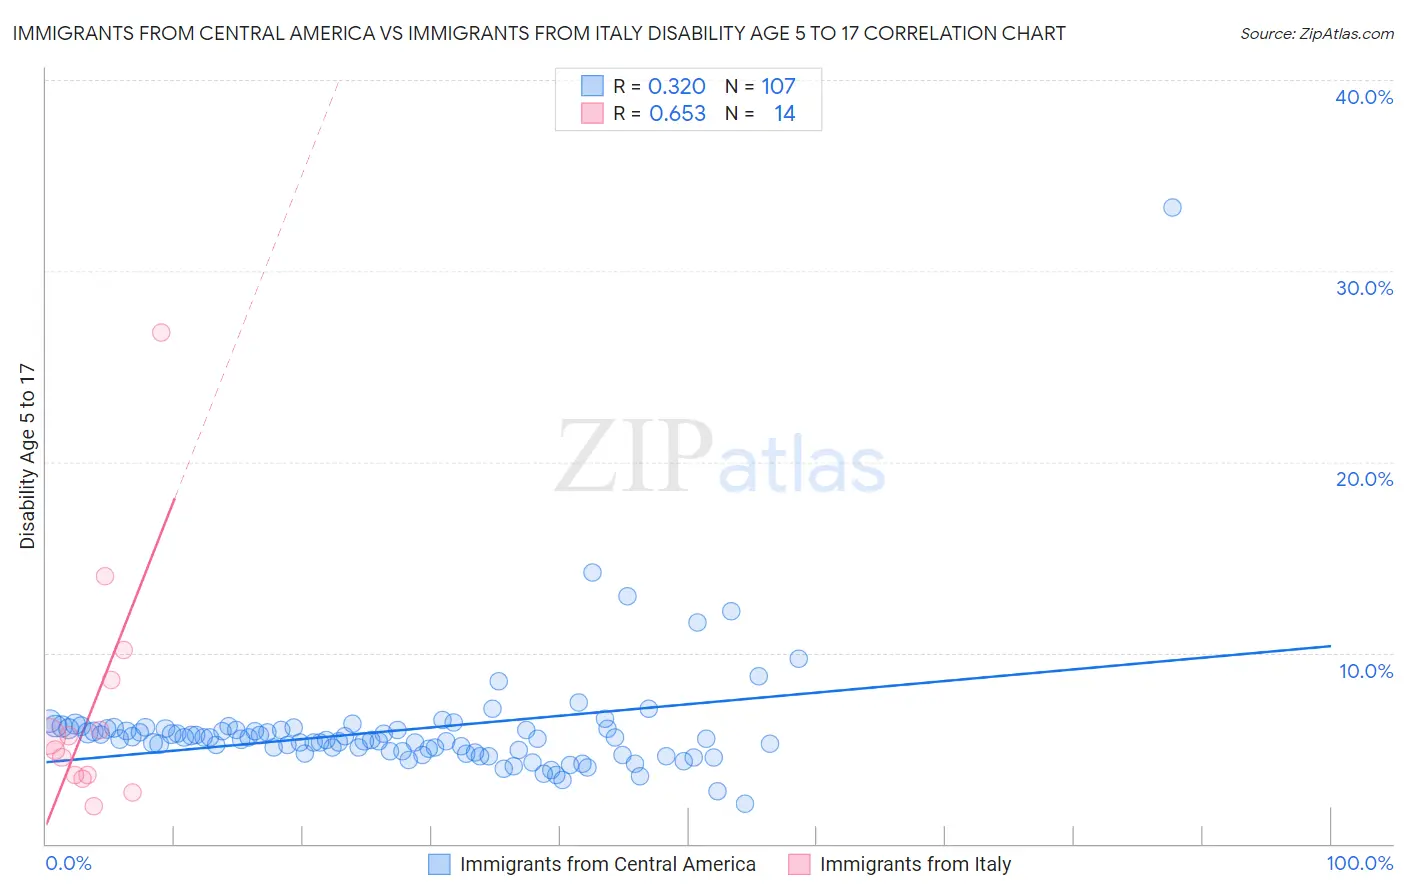
Immigrants from Central America vs Immigrants from Italy Disability Age 5 to 17 Correlation Chart
The statistical analysis conducted on geographies consisting of 527,600,457 people shows a mild positive correlation between the proportion of Immigrants from Central America and percentage of population with a disability between the ages 5 and 17 in the United States with a correlation coefficient (R) of 0.320 and weighted average of 5.6%. Similarly, the statistical analysis conducted on geographies consisting of 321,280,380 people shows a significant positive correlation between the proportion of Immigrants from Italy and percentage of population with a disability between the ages 5 and 17 in the United States with a correlation coefficient (R) of 0.653 and weighted average of 5.3%, a difference of 5.4%.
Disability Age 5 to 17 Correlation Summary
| Measurement | Immigrants from Central America | Immigrants from Italy |
| Minimum | 2.1% | 2.0% |
| Maximum | 33.3% | 26.8% |
| Range | 31.2% | 24.8% |
| Mean | 5.9% | 7.2% |
| Median | 5.5% | 5.3% |
| Interquartile 25% (IQ1) | 4.9% | 3.6% |
| Interquartile 75% (IQ3) | 6.0% | 8.6% |
| Interquartile Range (IQR) | 1.2% | 5.0% |
| Standard Deviation (Sample) | 3.2% | 6.5% |
| Standard Deviation (Population) | 3.2% | 6.3% |
Similar Demographics by Disability Age 5 to 17
Demographics Similar to Immigrants from Central America by Disability Age 5 to 17
In terms of disability age 5 to 17, the demographic groups most similar to Immigrants from Central America are Shoshone (5.6%, a difference of 0.0%), Costa Rican (5.6%, a difference of 0.030%), Uruguayan (5.6%, a difference of 0.080%), Immigrants from Western Europe (5.6%, a difference of 0.080%), and Immigrants from Trinidad and Tobago (5.6%, a difference of 0.090%).
| Demographics | Rating | Rank | Disability Age 5 to 17 |
| Immigrants | Norway | 55.7 /100 | #169 | Average 5.6% |
| Serbians | 54.0 /100 | #170 | Average 5.6% |
| Immigrants | Iraq | 53.9 /100 | #171 | Average 5.6% |
| Ukrainians | 51.5 /100 | #172 | Average 5.6% |
| Uruguayans | 51.0 /100 | #173 | Average 5.6% |
| Costa Ricans | 50.0 /100 | #174 | Average 5.6% |
| Shoshone | 49.4 /100 | #175 | Average 5.6% |
| Immigrants | Central America | 49.4 /100 | #176 | Average 5.6% |
| Immigrants | Western Europe | 47.8 /100 | #177 | Average 5.6% |
| Immigrants | Trinidad and Tobago | 47.6 /100 | #178 | Average 5.6% |
| Immigrants | Barbados | 40.5 /100 | #179 | Average 5.6% |
| Immigrants | Uruguay | 37.7 /100 | #180 | Fair 5.6% |
| Immigrants | England | 36.4 /100 | #181 | Fair 5.6% |
| Mexican American Indians | 35.2 /100 | #182 | Fair 5.6% |
| Immigrants | Latin America | 34.3 /100 | #183 | Fair 5.6% |
Demographics Similar to Immigrants from Italy by Disability Age 5 to 17
In terms of disability age 5 to 17, the demographic groups most similar to Immigrants from Italy are Peruvian (5.3%, a difference of 0.090%), Immigrants from Yemen (5.3%, a difference of 0.13%), Russian (5.3%, a difference of 0.16%), Salvadoran (5.3%, a difference of 0.17%), and Nicaraguan (5.3%, a difference of 0.19%).
| Demographics | Rating | Rank | Disability Age 5 to 17 |
| Immigrants | Austria | 98.9 /100 | #98 | Exceptional 5.3% |
| Cambodians | 98.8 /100 | #99 | Exceptional 5.3% |
| Nepalese | 98.7 /100 | #100 | Exceptional 5.3% |
| Menominee | 98.7 /100 | #101 | Exceptional 5.3% |
| Nicaraguans | 98.6 /100 | #102 | Exceptional 5.3% |
| Salvadorans | 98.6 /100 | #103 | Exceptional 5.3% |
| Peruvians | 98.5 /100 | #104 | Exceptional 5.3% |
| Immigrants | Italy | 98.4 /100 | #105 | Exceptional 5.3% |
| Immigrants | Yemen | 98.2 /100 | #106 | Exceptional 5.3% |
| Russians | 98.2 /100 | #107 | Exceptional 5.3% |
| Immigrants | South Africa | 98.1 /100 | #108 | Exceptional 5.3% |
| Immigrants | Northern Africa | 98.1 /100 | #109 | Exceptional 5.3% |
| Immigrants | Eritrea | 98.0 /100 | #110 | Exceptional 5.3% |
| Ethiopians | 97.9 /100 | #111 | Exceptional 5.3% |
| Immigrants | Latvia | 97.9 /100 | #112 | Exceptional 5.3% |