Albanian vs Alsatian Disability Age 5 to 17
COMPARE
Albanian
Alsatian
Disability Age 5 to 17
Disability Age 5 to 17 Comparison
Albanians
Alsatians
5.5%
DISABILITY AGE 5 TO 17
83.7/ 100
METRIC RATING
146th/ 347
METRIC RANK
5.8%
DISABILITY AGE 5 TO 17
6.0/ 100
METRIC RATING
223rd/ 347
METRIC RANK
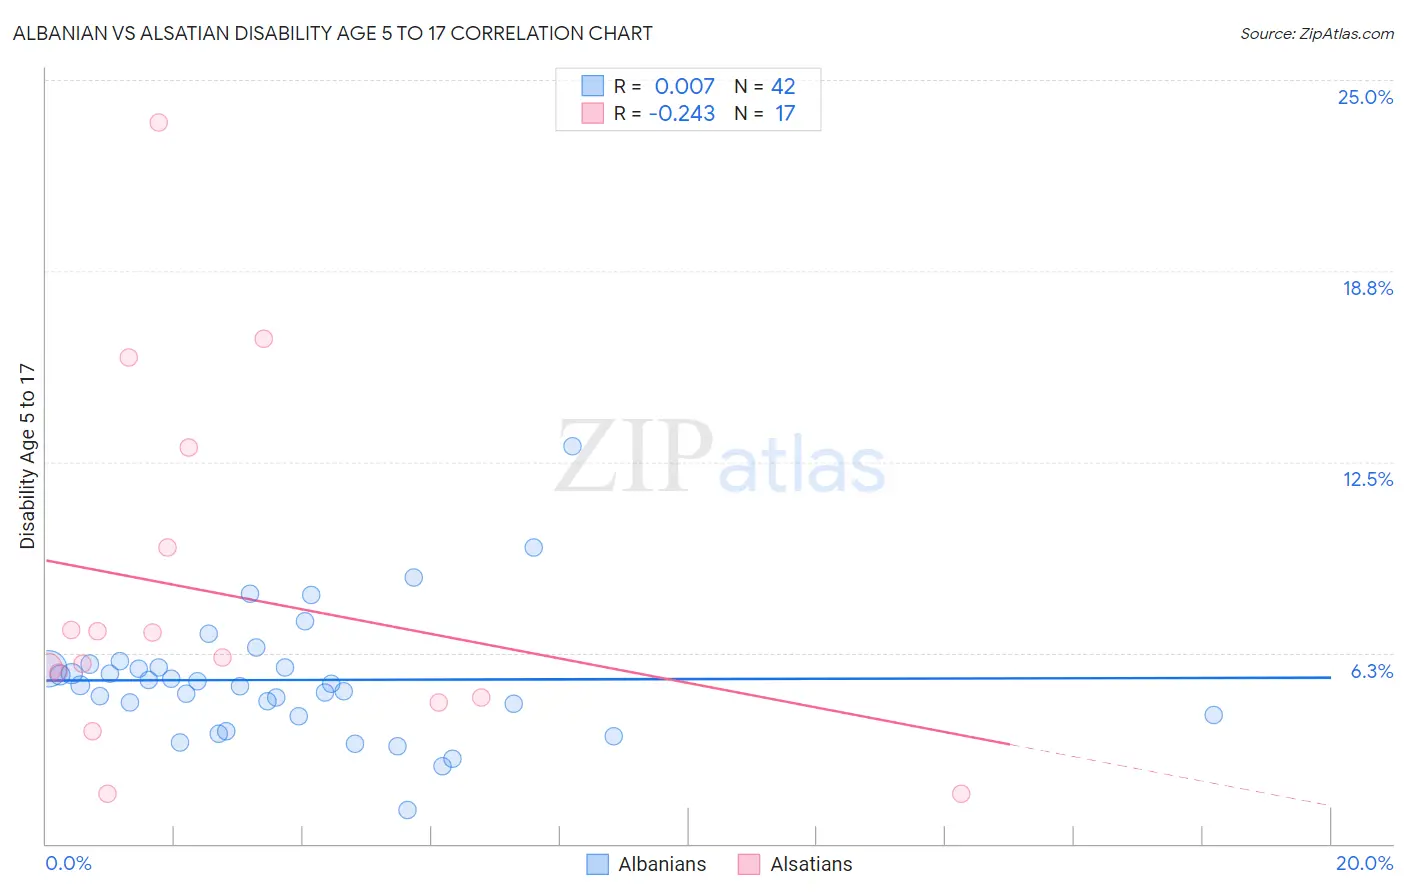
Albanian vs Alsatian Disability Age 5 to 17 Correlation Chart
The statistical analysis conducted on geographies consisting of 192,377,953 people shows no correlation between the proportion of Albanians and percentage of population with a disability between the ages 5 and 17 in the United States with a correlation coefficient (R) of 0.007 and weighted average of 5.5%. Similarly, the statistical analysis conducted on geographies consisting of 82,434,825 people shows a weak negative correlation between the proportion of Alsatians and percentage of population with a disability between the ages 5 and 17 in the United States with a correlation coefficient (R) of -0.243 and weighted average of 5.8%, a difference of 5.5%.
Disability Age 5 to 17 Correlation Summary
| Measurement | Albanian | Alsatian |
| Minimum | 1.1% | 1.6% |
| Maximum | 13.0% | 23.6% |
| Range | 11.9% | 22.0% |
| Mean | 5.4% | 8.2% |
| Median | 5.2% | 6.1% |
| Interquartile 25% (IQ1) | 4.2% | 4.7% |
| Interquartile 75% (IQ3) | 5.8% | 11.3% |
| Interquartile Range (IQR) | 1.6% | 6.6% |
| Standard Deviation (Sample) | 2.1% | 5.9% |
| Standard Deviation (Population) | 2.0% | 5.7% |
Similar Demographics by Disability Age 5 to 17
Demographics Similar to Albanians by Disability Age 5 to 17
In terms of disability age 5 to 17, the demographic groups most similar to Albanians are Immigrants from Albania (5.5%, a difference of 0.060%), Samoan (5.5%, a difference of 0.16%), Central American (5.5%, a difference of 0.19%), Guatemalan (5.5%, a difference of 0.19%), and Estonian (5.5%, a difference of 0.26%).
| Demographics | Rating | Rank | Disability Age 5 to 17 |
| Belizeans | 90.8 /100 | #139 | Exceptional 5.4% |
| Immigrants | Netherlands | 90.5 /100 | #140 | Exceptional 5.4% |
| South American Indians | 89.3 /100 | #141 | Excellent 5.5% |
| Colombians | 88.0 /100 | #142 | Excellent 5.5% |
| Immigrants | Hungary | 87.9 /100 | #143 | Excellent 5.5% |
| Pakistanis | 87.3 /100 | #144 | Excellent 5.5% |
| Immigrants | Guatemala | 86.6 /100 | #145 | Excellent 5.5% |
| Albanians | 83.7 /100 | #146 | Excellent 5.5% |
| Immigrants | Albania | 83.1 /100 | #147 | Excellent 5.5% |
| Samoans | 81.9 /100 | #148 | Excellent 5.5% |
| Central Americans | 81.6 /100 | #149 | Excellent 5.5% |
| Guatemalans | 81.5 /100 | #150 | Excellent 5.5% |
| Estonians | 80.8 /100 | #151 | Excellent 5.5% |
| Ute | 80.6 /100 | #152 | Excellent 5.5% |
| Ecuadorians | 79.7 /100 | #153 | Good 5.5% |
Demographics Similar to Alsatians by Disability Age 5 to 17
In terms of disability age 5 to 17, the demographic groups most similar to Alsatians are Mexican (5.8%, a difference of 0.060%), Guamanian/Chamorro (5.8%, a difference of 0.080%), British West Indian (5.8%, a difference of 0.12%), Lithuanian (5.8%, a difference of 0.15%), and Immigrants from Sudan (5.8%, a difference of 0.15%).
| Demographics | Rating | Rank | Disability Age 5 to 17 |
| Nigerians | 7.5 /100 | #216 | Tragic 5.8% |
| Czechs | 7.4 /100 | #217 | Tragic 5.8% |
| Immigrants | Sierra Leone | 7.1 /100 | #218 | Tragic 5.8% |
| Sierra Leoneans | 7.0 /100 | #219 | Tragic 5.8% |
| Belgians | 6.9 /100 | #220 | Tragic 5.8% |
| Lithuanians | 6.7 /100 | #221 | Tragic 5.8% |
| Immigrants | Sudan | 6.7 /100 | #222 | Tragic 5.8% |
| Alsatians | 6.0 /100 | #223 | Tragic 5.8% |
| Mexicans | 5.7 /100 | #224 | Tragic 5.8% |
| Guamanians/Chamorros | 5.6 /100 | #225 | Tragic 5.8% |
| British West Indians | 5.4 /100 | #226 | Tragic 5.8% |
| Swiss | 5.1 /100 | #227 | Tragic 5.8% |
| Haitians | 4.8 /100 | #228 | Tragic 5.8% |
| Bangladeshis | 4.8 /100 | #229 | Tragic 5.8% |
| Ghanaians | 4.7 /100 | #230 | Tragic 5.8% |