Chief Lake, WI Map & Demographics
Chief Lake Map
Chief Lake Overview
$45,055
PER CAPITA INCOME
$71,615
AVG FAMILY INCOME
$65,962
AVG HOUSEHOLD INCOME
31.4%
WAGE / INCOME GAP [ % ]
68.6¢/ $1
WAGE / INCOME GAP [ $ ]
0.61
INEQUALITY / GINI INDEX
626
TOTAL POPULATION
309
MALE POPULATION
317
FEMALE POPULATION
97.48
MALES / 100 FEMALES
102.59
FEMALES / 100 MALES
45.0
MEDIAN AGE
2.8
AVG FAMILY SIZE
2.5
AVG HOUSEHOLD SIZE
295
LABOR FORCE [ PEOPLE ]
59.6%
PERCENT IN LABOR FORCE
6.4%
UNEMPLOYMENT RATE
Income in Chief Lake
Income Overview in Chief Lake
Per Capita Income in Chief Lake is $45,055, while median incomes of families and households are $71,615 and $65,962 respectively.
| Characteristic | Number | Measure |
| Per Capita Income | 626 | $45,055 |
| Median Family Income | 191 | $71,615 |
| Mean Family Income | 191 | $96,725 |
| Median Household Income | 252 | $65,962 |
| Mean Household Income | 252 | $118,421 |
| Income Deficit | 191 | $0 |
| Wage / Income Gap (%) | 626 | 31.36% |
| Wage / Income Gap ($) | 626 | 68.64¢ per $1 |
| Gini / Inequality Index | 626 | 0.61 |
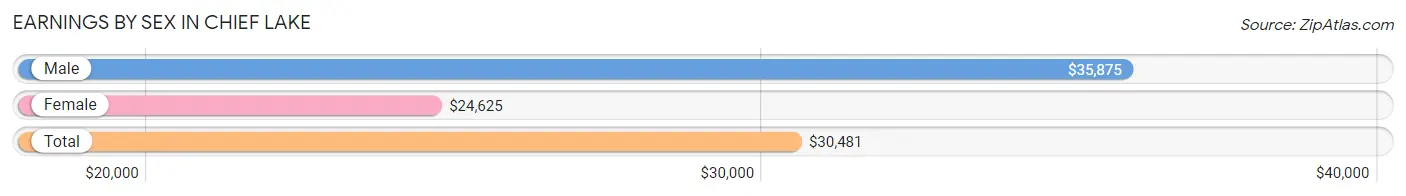
Earnings by Sex in Chief Lake
Average Earnings in Chief Lake are $30,481, $35,875 for men and $24,625 for women, a difference of 31.4%.
| Sex | Number | Average Earnings |
| Male | 125 (41.8%) | $35,875 |
| Female | 174 (58.2%) | $24,625 |
| Total | 299 (100.0%) | $30,481 |
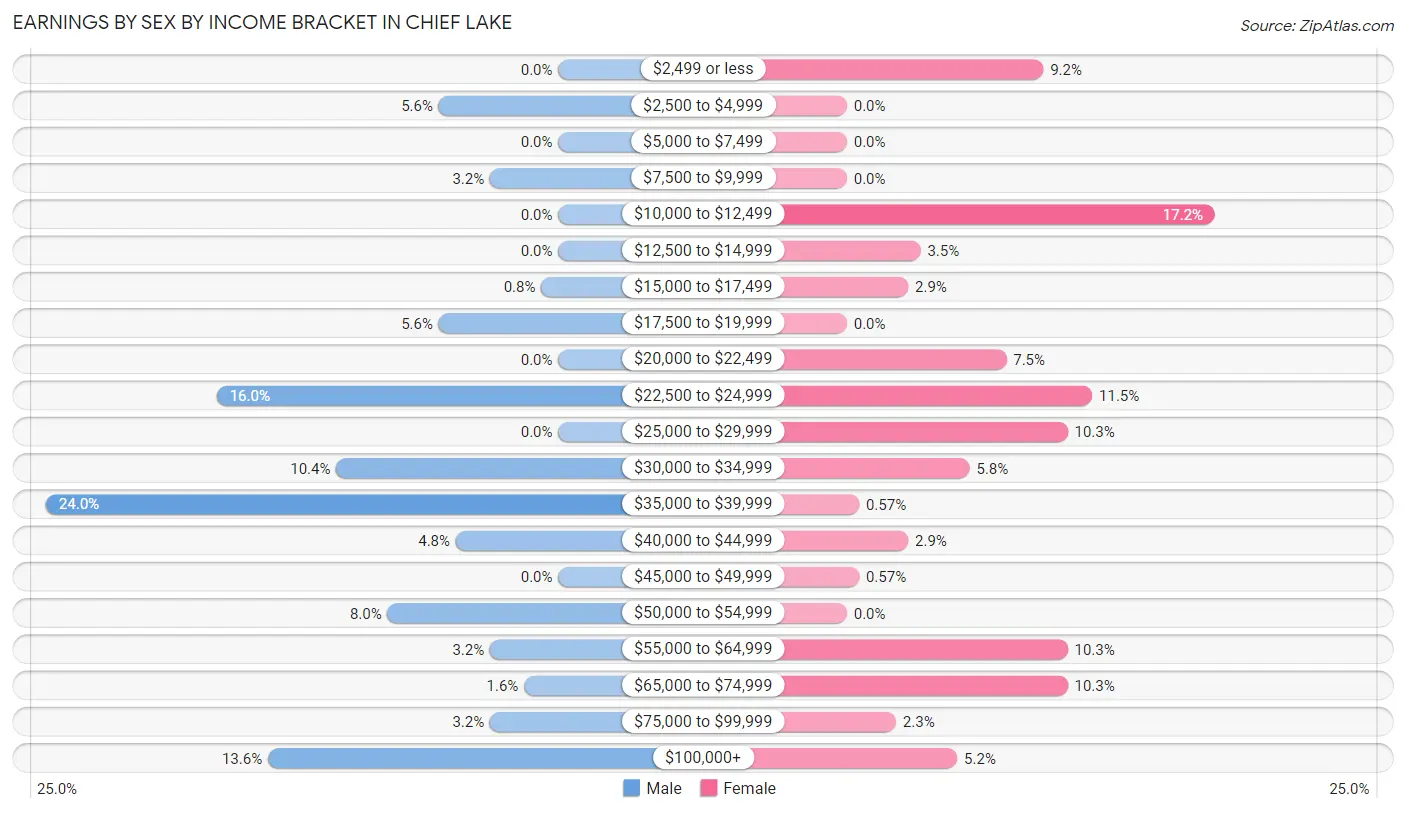
Earnings by Sex by Income Bracket in Chief Lake
The most common earnings brackets in Chief Lake are $35,000 to $39,999 for men (30 | 24.0%) and $10,000 to $12,499 for women (30 | 17.2%).
| Income | Male | Female |
| $2,499 or less | 0 (0.0%) | 16 (9.2%) |
| $2,500 to $4,999 | 7 (5.6%) | 0 (0.0%) |
| $5,000 to $7,499 | 0 (0.0%) | 0 (0.0%) |
| $7,500 to $9,999 | 4 (3.2%) | 0 (0.0%) |
| $10,000 to $12,499 | 0 (0.0%) | 30 (17.2%) |
| $12,500 to $14,999 | 0 (0.0%) | 6 (3.5%) |
| $15,000 to $17,499 | 1 (0.8%) | 5 (2.9%) |
| $17,500 to $19,999 | 7 (5.6%) | 0 (0.0%) |
| $20,000 to $22,499 | 0 (0.0%) | 13 (7.5%) |
| $22,500 to $24,999 | 20 (16.0%) | 20 (11.5%) |
| $25,000 to $29,999 | 0 (0.0%) | 18 (10.3%) |
| $30,000 to $34,999 | 13 (10.4%) | 10 (5.8%) |
| $35,000 to $39,999 | 30 (24.0%) | 1 (0.6%) |
| $40,000 to $44,999 | 6 (4.8%) | 5 (2.9%) |
| $45,000 to $49,999 | 0 (0.0%) | 1 (0.6%) |
| $50,000 to $54,999 | 10 (8.0%) | 0 (0.0%) |
| $55,000 to $64,999 | 4 (3.2%) | 18 (10.3%) |
| $65,000 to $74,999 | 2 (1.6%) | 18 (10.3%) |
| $75,000 to $99,999 | 4 (3.2%) | 4 (2.3%) |
| $100,000+ | 17 (13.6%) | 9 (5.2%) |
| Total | 125 (100.0%) | 174 (100.0%) |
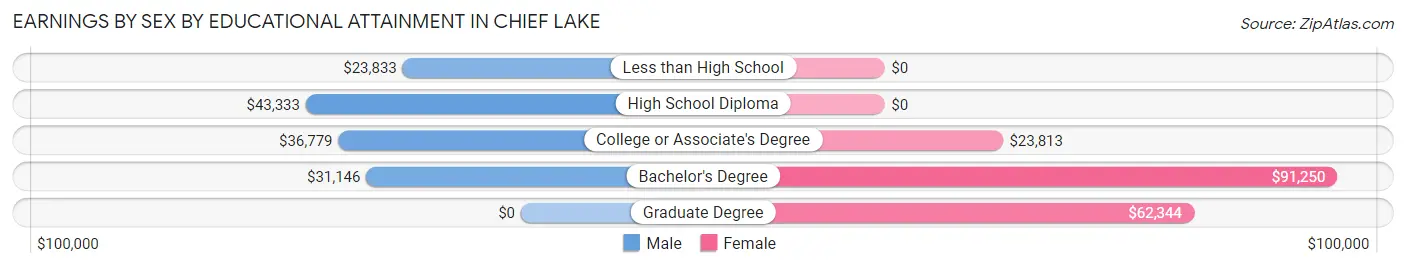
Earnings by Sex by Educational Attainment in Chief Lake
Average earnings in Chief Lake are $36,333 for men and $29,236 for women, a difference of 19.5%. Men with an educational attainment of high school diploma enjoy the highest average annual earnings of $43,333, while those with less than high school education earn the least with $23,833. Women with an educational attainment of bachelor's degree earn the most with the average annual earnings of $91,250, while those with college or associate's degree education have the smallest earnings of $23,813.
| Educational Attainment | Male Income | Female Income |
| Less than High School | $23,833 | $0 |
| High School Diploma | $43,333 | $0 |
| College or Associate's Degree | $36,779 | $23,813 |
| Bachelor's Degree | $31,146 | $91,250 |
| Graduate Degree | - | - |
| Total | $36,333 | $29,236 |
Family Income in Chief Lake
Family Income Brackets in Chief Lake
According to the Chief Lake family income data, there are 47 families falling into the $50,000 to $74,999 income range, which is the most common income bracket and makes up 24.6% of all families.
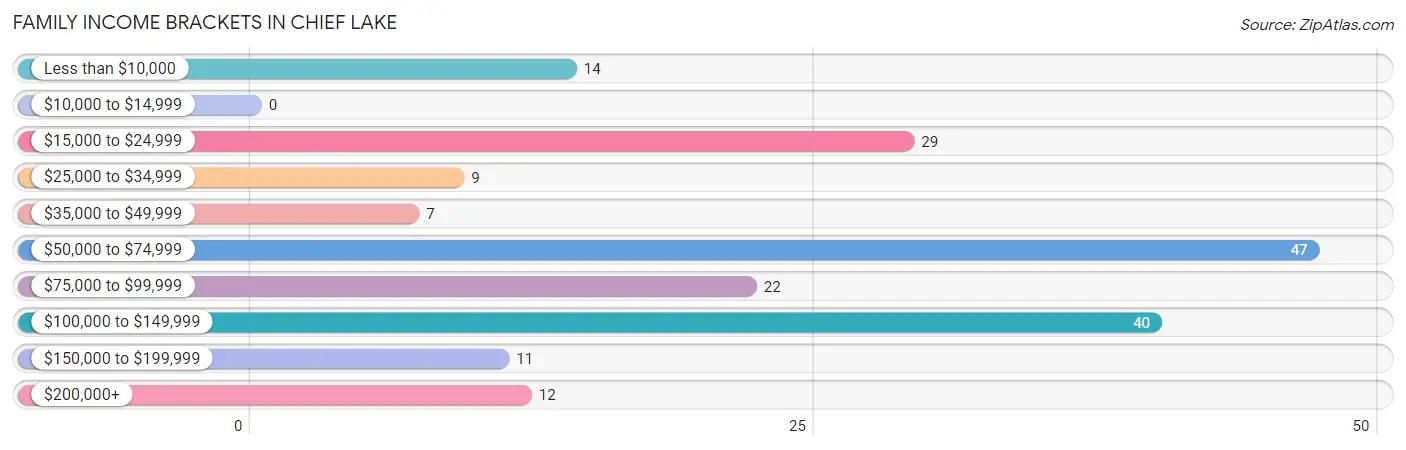
| Income Bracket | # Families | % Families |
| Less than $10,000 | 14 | 7.3% |
| $10,000 to $14,999 | 0 | 0.0% |
| $15,000 to $24,999 | 29 | 15.2% |
| $25,000 to $34,999 | 9 | 4.7% |
| $35,000 to $49,999 | 7 | 3.7% |
| $50,000 to $74,999 | 47 | 24.6% |
| $75,000 to $99,999 | 22 | 11.5% |
| $100,000 to $149,999 | 40 | 20.9% |
| $150,000 to $199,999 | 11 | 5.8% |
| $200,000+ | 12 | 6.3% |
Family Income by Famaliy Size in Chief Lake
3-person families (28 | 14.7%) account for the highest median family income in Chief Lake with $106,071 per family, while 3-person families (28 | 14.7%) have the highest median income of $35,357 per family member.
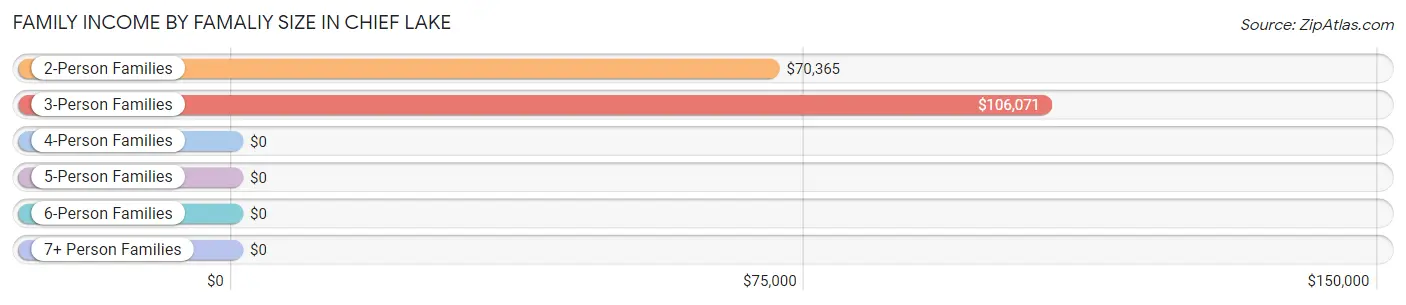
| Income Bracket | # Families | Median Income |
| 2-Person Families | 111 (58.1%) | $70,365 |
| 3-Person Families | 28 (14.7%) | $106,071 |
| 4-Person Families | 14 (7.3%) | $0 |
| 5-Person Families | 7 (3.7%) | $0 |
| 6-Person Families | 31 (16.2%) | $0 |
| 7+ Person Families | 0 (0.0%) | $0 |
| Total | 191 (100.0%) | $71,615 |
Family Income by Number of Earners in Chief Lake
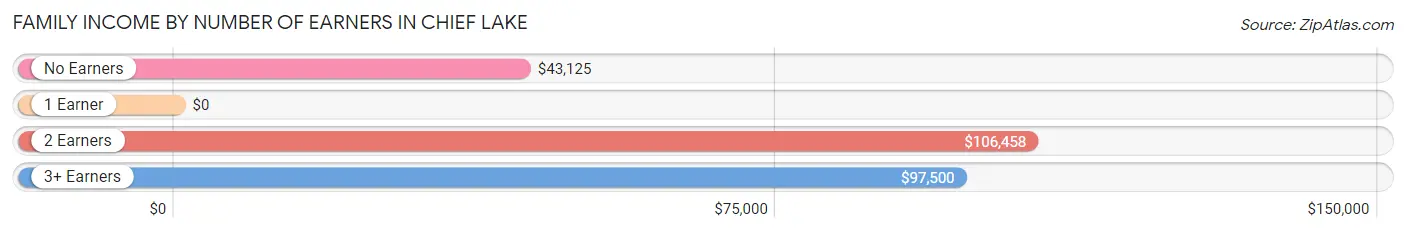
| Number of Earners | # Families | Median Income |
| No Earners | 39 (20.4%) | $43,125 |
| 1 Earner | 63 (33.0%) | $0 |
| 2 Earners | 53 (27.8%) | $106,458 |
| 3+ Earners | 36 (18.9%) | $97,500 |
| Total | 191 (100.0%) | $71,615 |
Household Income in Chief Lake
Household Income Brackets in Chief Lake
With 65 households falling in the category, the $50,000 to $74,999 income range is the most frequent in Chief Lake, accounting for 25.8% of all households. In contrast, only 8 households (3.2%) fall into the $10,000 to $14,999 income bracket, making it the least populous group.
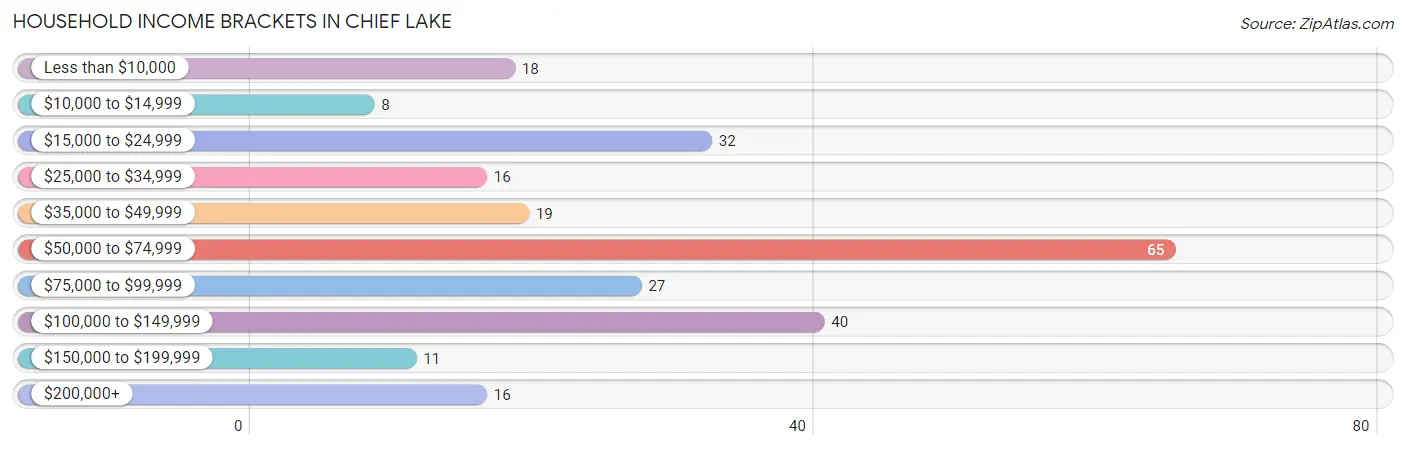
| Income Bracket | # Households | % Households |
| Less than $10,000 | 18 | 7.1% |
| $10,000 to $14,999 | 8 | 3.2% |
| $15,000 to $24,999 | 32 | 12.7% |
| $25,000 to $34,999 | 16 | 6.3% |
| $35,000 to $49,999 | 19 | 7.5% |
| $50,000 to $74,999 | 65 | 25.8% |
| $75,000 to $99,999 | 27 | 10.7% |
| $100,000 to $149,999 | 40 | 15.9% |
| $150,000 to $199,999 | 11 | 4.4% |
| $200,000+ | 16 | 6.3% |
Household Income by Householder Age in Chief Lake
The median household income in Chief Lake is $65,962, with the highest median household income of $71,250 found in the 25 to 44 years age bracket for the primary householder. A total of 55 households (21.8%) fall into this category.
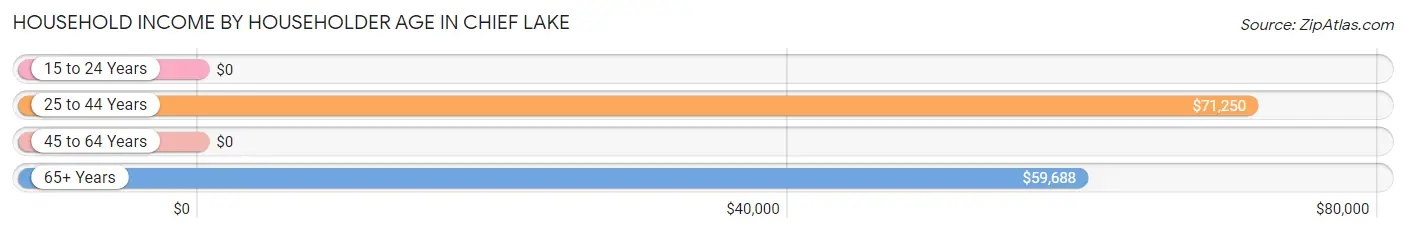
| Income Bracket | # Households | Median Income |
| 15 to 24 Years | 0 (0.0%) | $0 |
| 25 to 44 Years | 55 (21.8%) | $71,250 |
| 45 to 64 Years | 117 (46.4%) | $0 |
| 65+ Years | 80 (31.8%) | $59,688 |
| Total | 252 (100.0%) | $65,962 |
Poverty in Chief Lake
Income Below Poverty by Sex and Age in Chief Lake
With 19.0% poverty level for males and 15.9% for females among the residents of Chief Lake, 18 to 24 year old males and 6 to 11 year old females are the most vulnerable to poverty, with 4 males (100.0%) and 10 females (100.0%) in their respective age groups living below the poverty level.
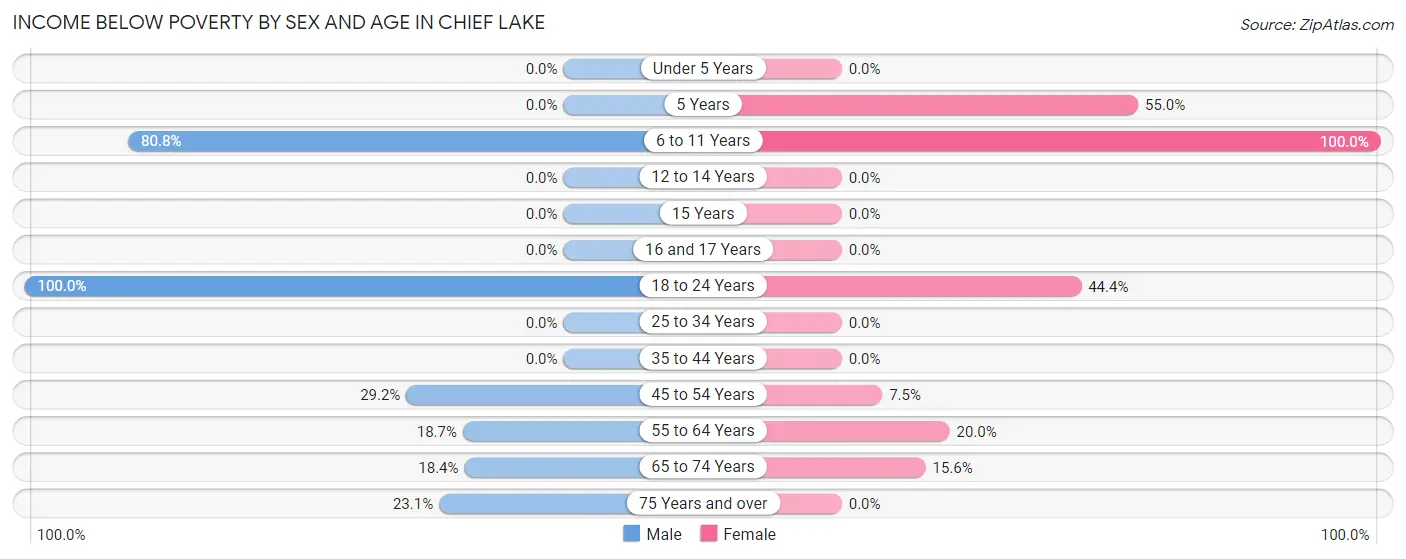
| Age Bracket | Male | Female |
| Under 5 Years | 0 (0.0%) | 0 (0.0%) |
| 5 Years | 0 (0.0%) | 11 (55.0%) |
| 6 to 11 Years | 21 (80.8%) | 10 (100.0%) |
| 12 to 14 Years | 0 (0.0%) | 0 (0.0%) |
| 15 Years | 0 (0.0%) | 0 (0.0%) |
| 16 and 17 Years | 0 (0.0%) | 0 (0.0%) |
| 18 to 24 Years | 4 (100.0%) | 8 (44.4%) |
| 25 to 34 Years | 0 (0.0%) | 0 (0.0%) |
| 35 to 44 Years | 0 (0.0%) | 0 (0.0%) |
| 45 to 54 Years | 7 (29.2%) | 3 (7.5%) |
| 55 to 64 Years | 14 (18.7%) | 11 (20.0%) |
| 65 to 74 Years | 9 (18.4%) | 7 (15.6%) |
| 75 Years and over | 3 (23.1%) | 0 (0.0%) |
| Total | 58 (19.0%) | 50 (15.9%) |
Income Above Poverty by Sex and Age in Chief Lake
According to the poverty statistics in Chief Lake, males aged under 5 years and females aged 12 to 14 years are the age groups that are most secure financially, with 100.0% of males and 100.0% of females in these age groups living above the poverty line.
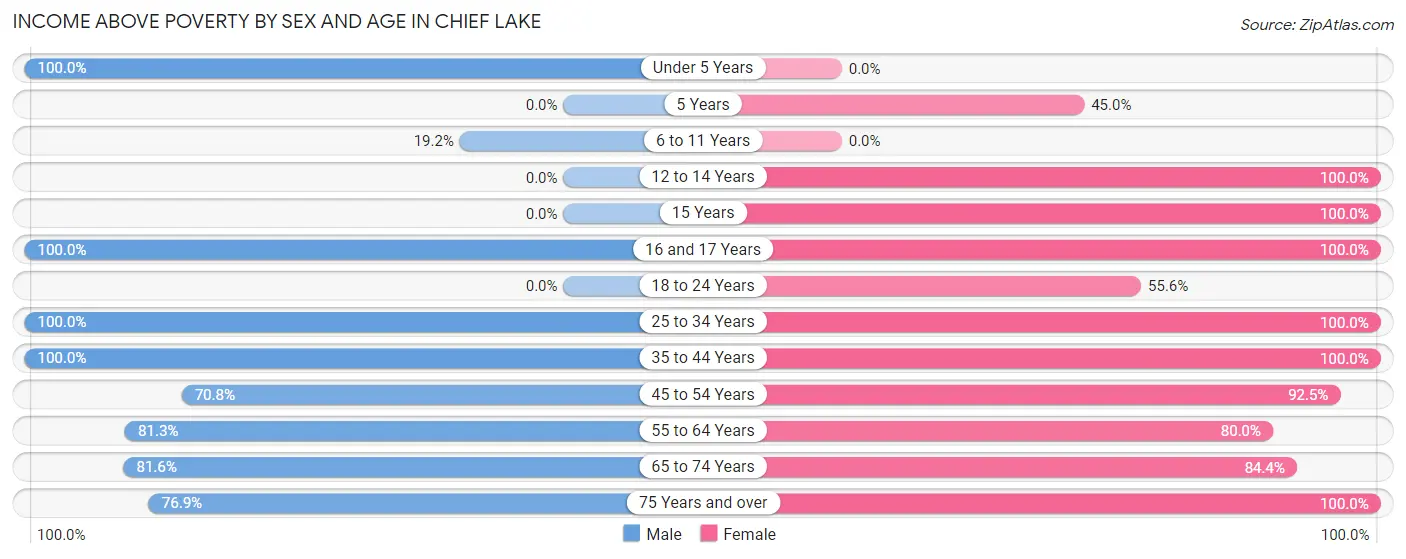
| Age Bracket | Male | Female |
| Under 5 Years | 38 (100.0%) | 0 (0.0%) |
| 5 Years | 0 (0.0%) | 9 (45.0%) |
| 6 to 11 Years | 5 (19.2%) | 0 (0.0%) |
| 12 to 14 Years | 0 (0.0%) | 28 (100.0%) |
| 15 Years | 0 (0.0%) | 4 (100.0%) |
| 16 and 17 Years | 22 (100.0%) | 21 (100.0%) |
| 18 to 24 Years | 0 (0.0%) | 10 (55.6%) |
| 25 to 34 Years | 37 (100.0%) | 42 (100.0%) |
| 35 to 44 Years | 18 (100.0%) | 20 (100.0%) |
| 45 to 54 Years | 17 (70.8%) | 37 (92.5%) |
| 55 to 64 Years | 61 (81.3%) | 44 (80.0%) |
| 65 to 74 Years | 40 (81.6%) | 38 (84.4%) |
| 75 Years and over | 10 (76.9%) | 12 (100.0%) |
| Total | 248 (81.0%) | 265 (84.1%) |
Income Below Poverty Among Married-Couple Families in Chief Lake
The poverty statistics for married-couple families in Chief Lake show that 11.4% or 14 of the total 123 families live below the poverty line. Families with no children have the highest poverty rate of 17.9%, comprising of 14 families. On the other hand, families with 1 or 2 children have the lowest poverty rate of 0.0%, which includes 0 families.
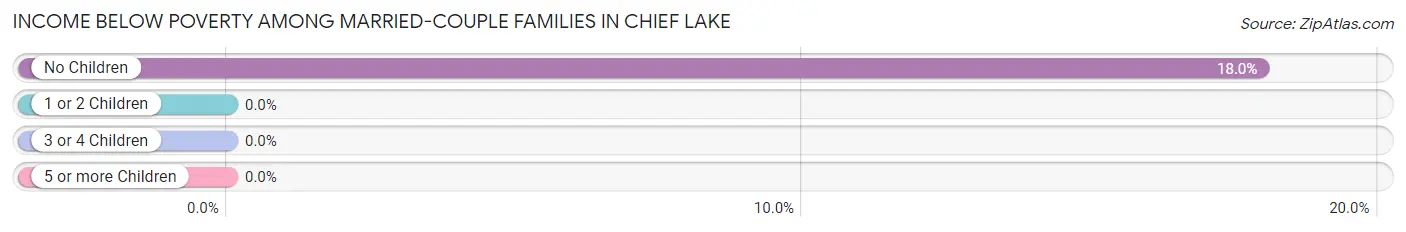
| Children | Above Poverty | Below Poverty |
| No Children | 64 (82.1%) | 14 (17.9%) |
| 1 or 2 Children | 27 (100.0%) | 0 (0.0%) |
| 3 or 4 Children | 18 (100.0%) | 0 (0.0%) |
| 5 or more Children | 0 (0.0%) | 0 (0.0%) |
| Total | 109 (88.6%) | 14 (11.4%) |
Income Below Poverty Among Single-Parent Households in Chief Lake
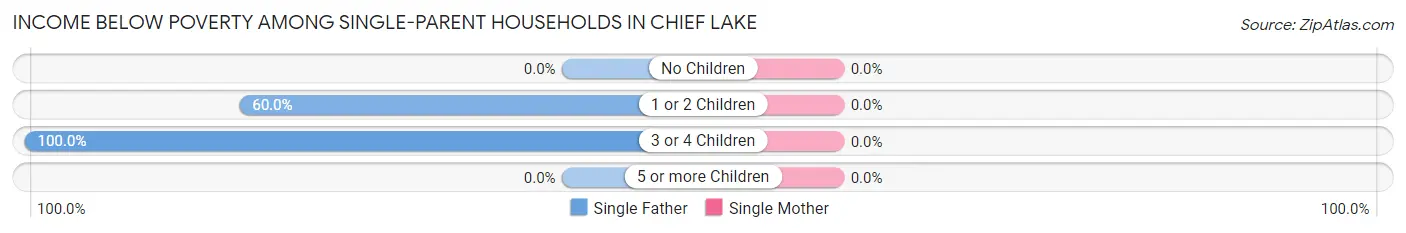
| Children | Single Father | Single Mother |
| No Children | 0 (0.0%) | 0 (0.0%) |
| 1 or 2 Children | 3 (60.0%) | 0 (0.0%) |
| 3 or 4 Children | 4 (100.0%) | 0 (0.0%) |
| 5 or more Children | 0 (0.0%) | 0 (0.0%) |
| Total | 7 (77.8%) | 0 (0.0%) |
Income Below Poverty Among Married-Couple vs Single-Parent Households in Chief Lake
The poverty data for Chief Lake shows that 14 of the married-couple family households (11.4%) and 7 of the single-parent households (10.3%) are living below the poverty level. Within the married-couple family households, those with no children have the highest poverty rate, with 14 households (17.9%) falling below the poverty line. Among the single-parent households, those with 3 or 4 children have the highest poverty rate, with 4 household (100.0%) living below poverty.
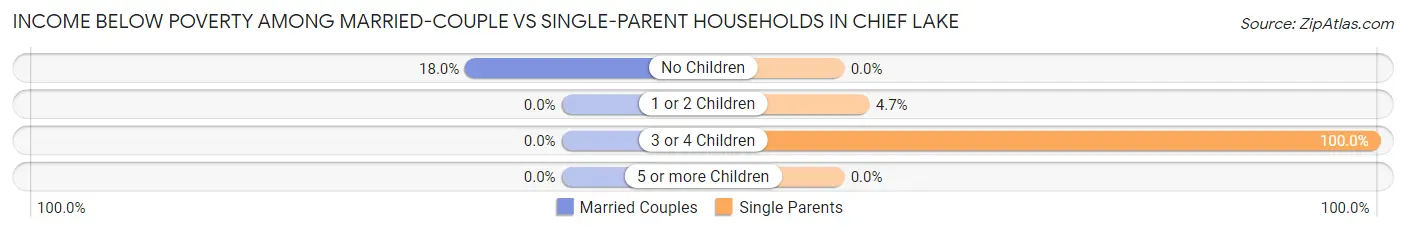
| Children | Married-Couple Families | Single-Parent Households |
| No Children | 14 (17.9%) | 0 (0.0%) |
| 1 or 2 Children | 0 (0.0%) | 3 (4.7%) |
| 3 or 4 Children | 0 (0.0%) | 4 (100.0%) |
| 5 or more Children | 0 (0.0%) | 0 (0.0%) |
| Total | 14 (11.4%) | 7 (10.3%) |
Race in Chief Lake
The most populous races in Chief Lake are Native / Alaskan (384 | 61.3%), White / Caucasian (197 | 31.5%), and Hispanic or Latino (84 | 13.4%).
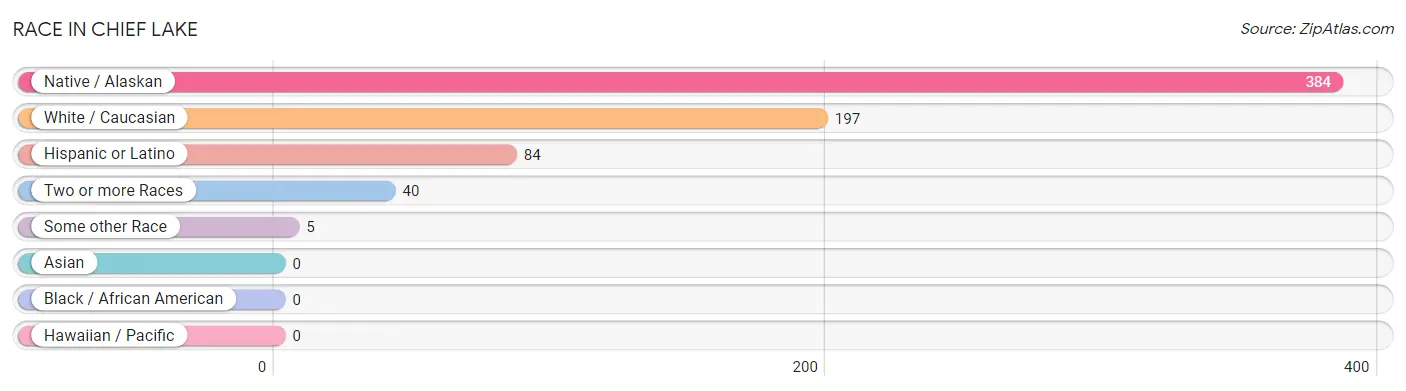
| Race | # Population | % Population |
| Asian | 0 | 0.0% |
| Black / African American | 0 | 0.0% |
| Hawaiian / Pacific | 0 | 0.0% |
| Hispanic or Latino | 84 | 13.4% |
| Native / Alaskan | 384 | 61.3% |
| White / Caucasian | 197 | 31.5% |
| Two or more Races | 40 | 6.4% |
| Some other Race | 5 | 0.8% |
| Total | 626 | 100.0% |
Ancestry in Chief Lake
The most populous ancestries reported in Chief Lake are Chippewa (399 | 63.7%), German (74 | 11.8%), Mexican (51 | 8.2%), Irish (24 | 3.8%), and Norwegian (23 | 3.7%), together accounting for 91.2% of all Chief Lake residents.
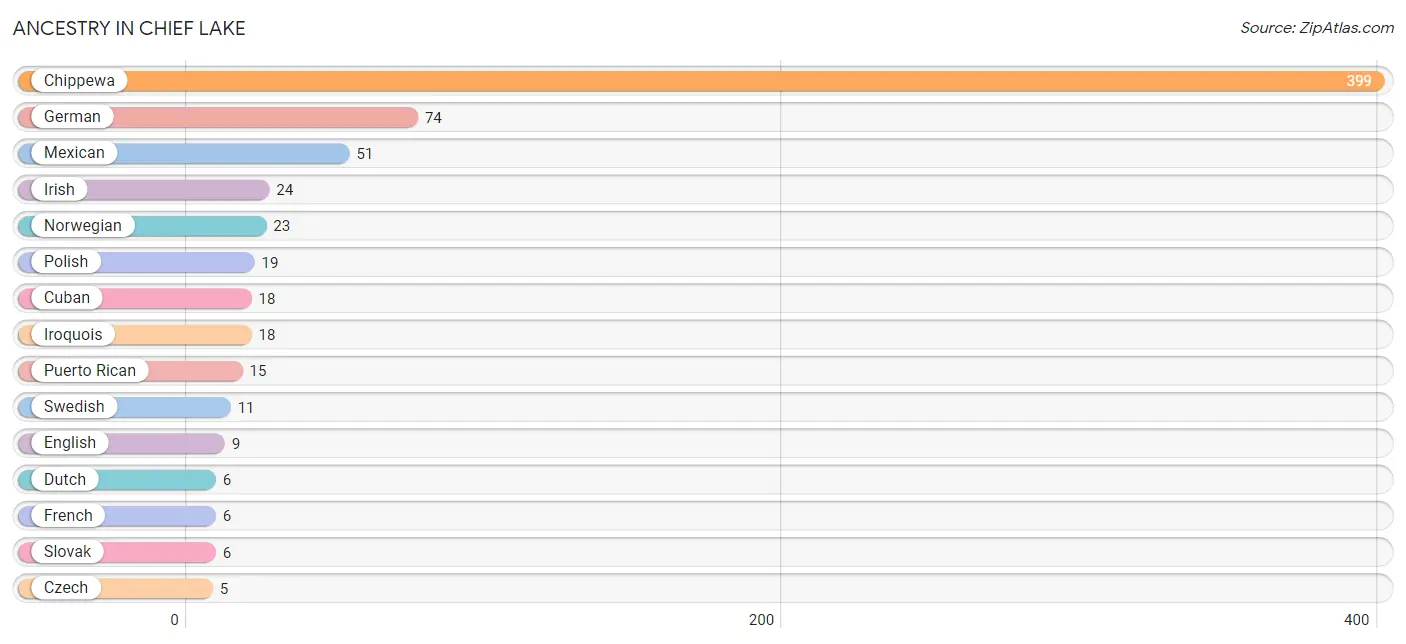
| Ancestry | # Population | % Population |
| American | 3 | 0.5% |
| Chippewa | 399 | 63.7% |
| Cuban | 18 | 2.9% |
| Czech | 5 | 0.8% |
| Dutch | 6 | 1.0% |
| English | 9 | 1.4% |
| European | 4 | 0.6% |
| French | 6 | 1.0% |
| German | 74 | 11.8% |
| Greek | 3 | 0.5% |
| Hungarian | 2 | 0.3% |
| Irish | 24 | 3.8% |
| Iroquois | 18 | 2.9% |
| Italian | 4 | 0.6% |
| Mexican | 51 | 8.2% |
| Norwegian | 23 | 3.7% |
| Polish | 19 | 3.0% |
| Pueblo | 1 | 0.2% |
| Puerto Rican | 15 | 2.4% |
| Slovak | 6 | 1.0% |
| Swedish | 11 | 1.8% | View All 21 Rows |
Immigrants in Chief Lake
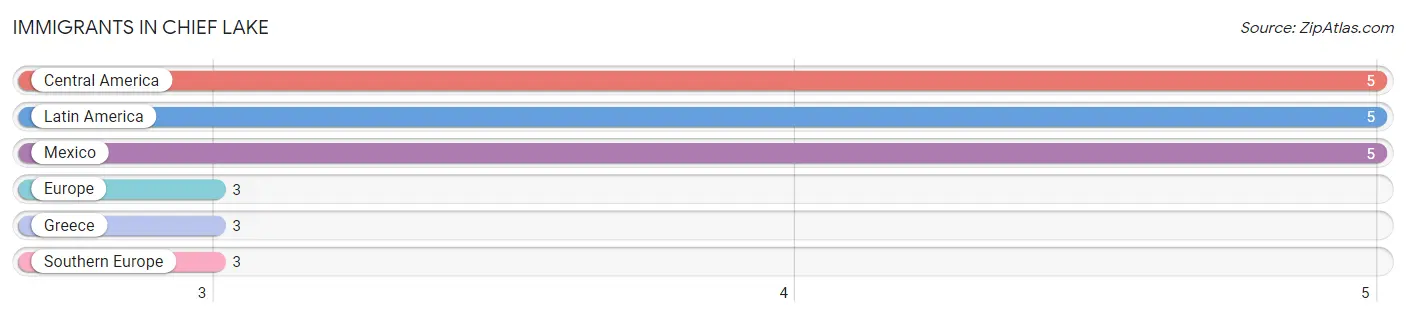
The most numerous immigrant groups reported in Chief Lake came from Central America (5 | 0.8%), Latin America (5 | 0.8%), Mexico (5 | 0.8%), Europe (3 | 0.5%), and Greece (3 | 0.5%), together accounting for 3.4% of all Chief Lake residents.
| Immigration Origin | # Population | % Population |
| Central America | 5 | 0.8% |
| Europe | 3 | 0.5% |
| Greece | 3 | 0.5% |
| Latin America | 5 | 0.8% |
| Mexico | 5 | 0.8% |
| Southern Europe | 3 | 0.5% | View All 6 Rows |
Sex and Age in Chief Lake
Sex and Age in Chief Lake
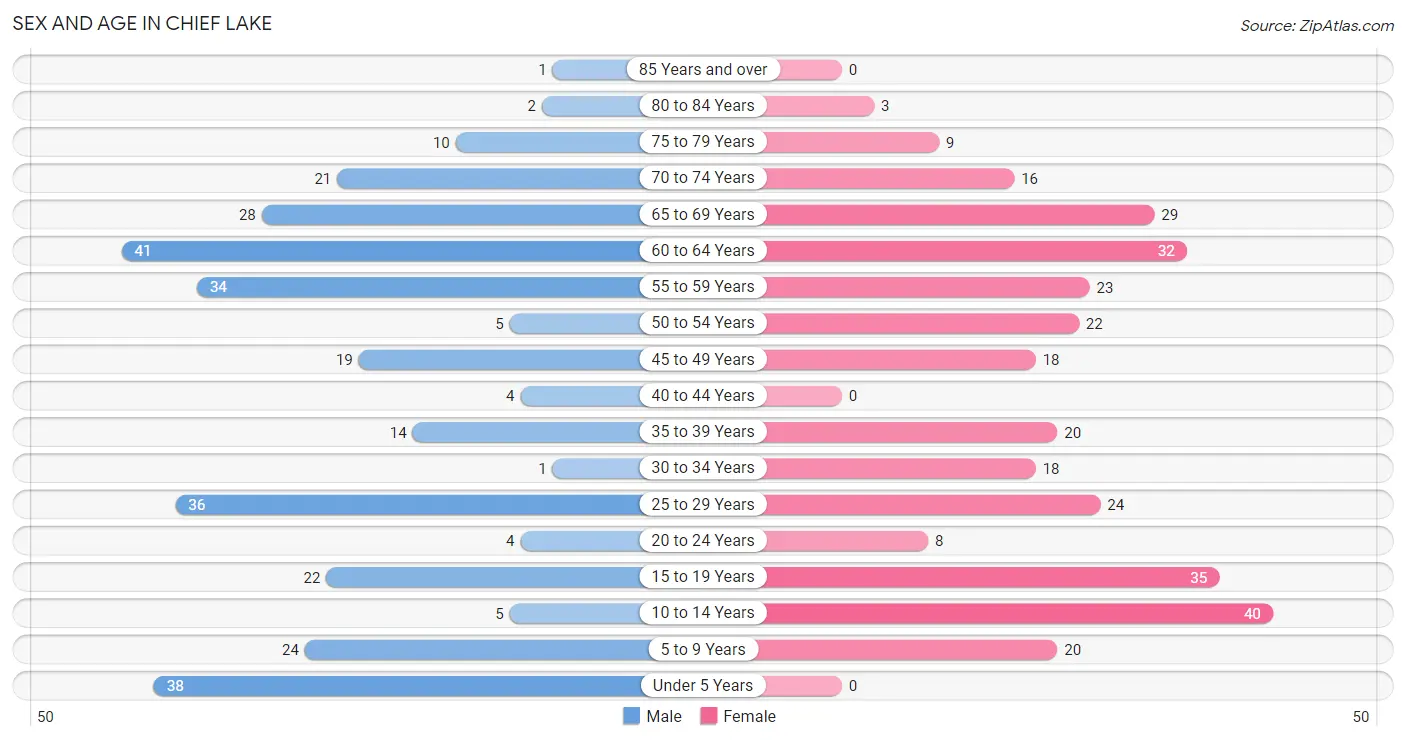
The most populous age groups in Chief Lake are 60 to 64 Years (41 | 13.3%) for men and 10 to 14 Years (40 | 12.6%) for women.
| Age Bracket | Male | Female |
| Under 5 Years | 38 (12.3%) | 0 (0.0%) |
| 5 to 9 Years | 24 (7.8%) | 20 (6.3%) |
| 10 to 14 Years | 5 (1.6%) | 40 (12.6%) |
| 15 to 19 Years | 22 (7.1%) | 35 (11.0%) |
| 20 to 24 Years | 4 (1.3%) | 8 (2.5%) |
| 25 to 29 Years | 36 (11.7%) | 24 (7.6%) |
| 30 to 34 Years | 1 (0.3%) | 18 (5.7%) |
| 35 to 39 Years | 14 (4.5%) | 20 (6.3%) |
| 40 to 44 Years | 4 (1.3%) | 0 (0.0%) |
| 45 to 49 Years | 19 (6.1%) | 18 (5.7%) |
| 50 to 54 Years | 5 (1.6%) | 22 (6.9%) |
| 55 to 59 Years | 34 (11.0%) | 23 (7.3%) |
| 60 to 64 Years | 41 (13.3%) | 32 (10.1%) |
| 65 to 69 Years | 28 (9.1%) | 29 (9.1%) |
| 70 to 74 Years | 21 (6.8%) | 16 (5.1%) |
| 75 to 79 Years | 10 (3.2%) | 9 (2.8%) |
| 80 to 84 Years | 2 (0.6%) | 3 (0.9%) |
| 85 Years and over | 1 (0.3%) | 0 (0.0%) |
| Total | 309 (100.0%) | 317 (100.0%) |
Families and Households in Chief Lake
Median Family Size in Chief Lake
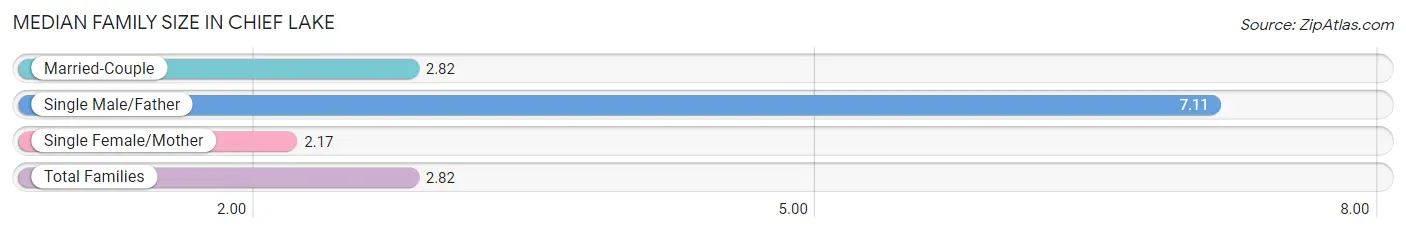
The median family size in Chief Lake is 2.82 persons per family, with single male/father families (9 | 4.7%) accounting for the largest median family size of 7.11 persons per family. On the other hand, single female/mother families (59 | 30.9%) represent the smallest median family size with 2.17 persons per family.
| Family Type | # Families | Family Size |
| Married-Couple | 123 (64.4%) | 2.82 |
| Single Male/Father | 9 (4.7%) | 7.11 |
| Single Female/Mother | 59 (30.9%) | 2.17 |
| Total Families | 191 (100.0%) | 2.82 |
Median Household Size in Chief Lake
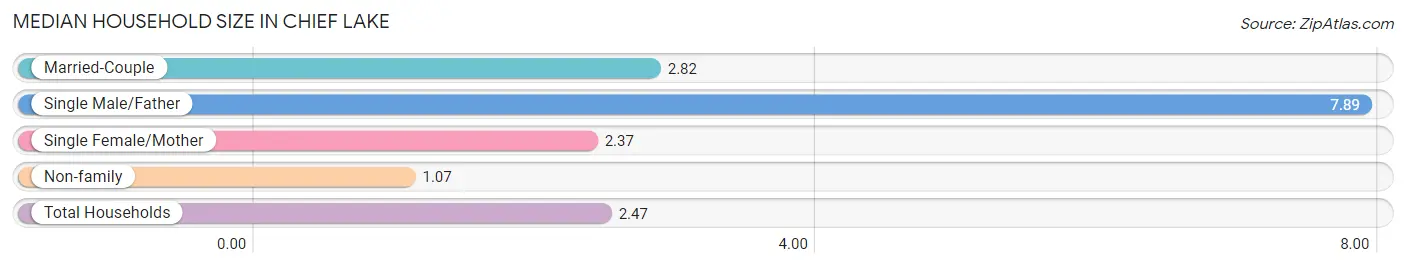
The median household size in Chief Lake is 2.47 persons per household, with single male/father households (9 | 3.6%) accounting for the largest median household size of 7.89 persons per household. non-family households (61 | 24.2%) represent the smallest median household size with 1.07 persons per household.
| Household Type | # Households | Household Size |
| Married-Couple | 123 (48.8%) | 2.82 |
| Single Male/Father | 9 (3.6%) | 7.89 |
| Single Female/Mother | 59 (23.4%) | 2.37 |
| Non-family | 61 (24.2%) | 1.07 |
| Total Households | 252 (100.0%) | 2.47 |
Household Size by Marriage Status in Chief Lake
Out of a total of 252 households in Chief Lake, 191 (75.8%) are family households, while 61 (24.2%) are nonfamily households. The most numerous type of family households are 2-person households, comprising 89, and the most common type of nonfamily households are 1-person households, comprising 57.
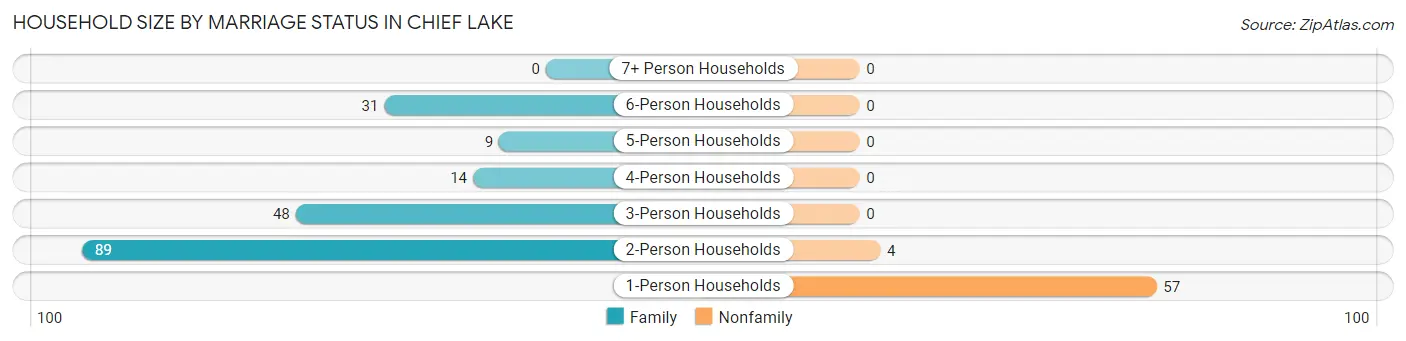
| Household Size | Family Households | Nonfamily Households |
| 1-Person Households | - | 57 (22.6%) |
| 2-Person Households | 89 (35.3%) | 4 (1.6%) |
| 3-Person Households | 48 (19.1%) | 0 (0.0%) |
| 4-Person Households | 14 (5.6%) | 0 (0.0%) |
| 5-Person Households | 9 (3.6%) | 0 (0.0%) |
| 6-Person Households | 31 (12.3%) | 0 (0.0%) |
| 7+ Person Households | 0 (0.0%) | 0 (0.0%) |
| Total | 191 (75.8%) | 61 (24.2%) |
Female Fertility in Chief Lake
Fertility by Age in Chief Lake
| Age Bracket | Women with Births | Births / 1,000 Women |
| 15 to 19 years | 0 (0.0%) | 0.0 |
| 20 to 34 years | 0 (0.0%) | 0.0 |
| 35 to 50 years | 0 (0.0%) | 0.0 |
| Total | 0 (0.0%) | 0.0 |
Fertility by Age by Marriage Status in Chief Lake
| Age Bracket | Married | Unmarried |
| 15 to 19 years | 0 (0.0%) | 0 (0.0%) |
| 20 to 34 years | 0 (0.0%) | 0 (0.0%) |
| 35 to 50 years | 0 (0.0%) | 0 (0.0%) |
| Total | 0 (0.0%) | 0 (0.0%) |
Fertility by Education in Chief Lake
| Educational Attainment | Women with Births | Births / 1,000 Women |
| Less than High School | 0 (0.0%) | 0.0 |
| High School Diploma | 0 (0.0%) | 0.0 |
| College or Associate's Degree | 0 (0.0%) | 0.0 |
| Bachelor's Degree | 0 (0.0%) | 0.0 |
| Graduate Degree | 0 (0.0%) | 0.0 |
| Total | 0 (0.0%) | 0.0 |
Fertility by Education by Marriage Status in Chief Lake
| Educational Attainment | Married | Unmarried |
| Less than High School | 0 (0.0%) | 0 (0.0%) |
| High School Diploma | 0 (0.0%) | 0 (0.0%) |
| College or Associate's Degree | 0 (0.0%) | 0 (0.0%) |
| Bachelor's Degree | 0 (0.0%) | 0 (0.0%) |
| Graduate Degree | 0 (0.0%) | 0 (0.0%) |
| Total | 0 (0.0%) | 0 (0.0%) |
Employment Characteristics in Chief Lake
Employment by Class of Employer in Chief Lake
Among the 270 employed individuals in Chief Lake, private company employees (152 | 56.3%), local government employees (45 | 16.7%), and federal government employees (26 | 9.6%) make up the most common classes of employment.
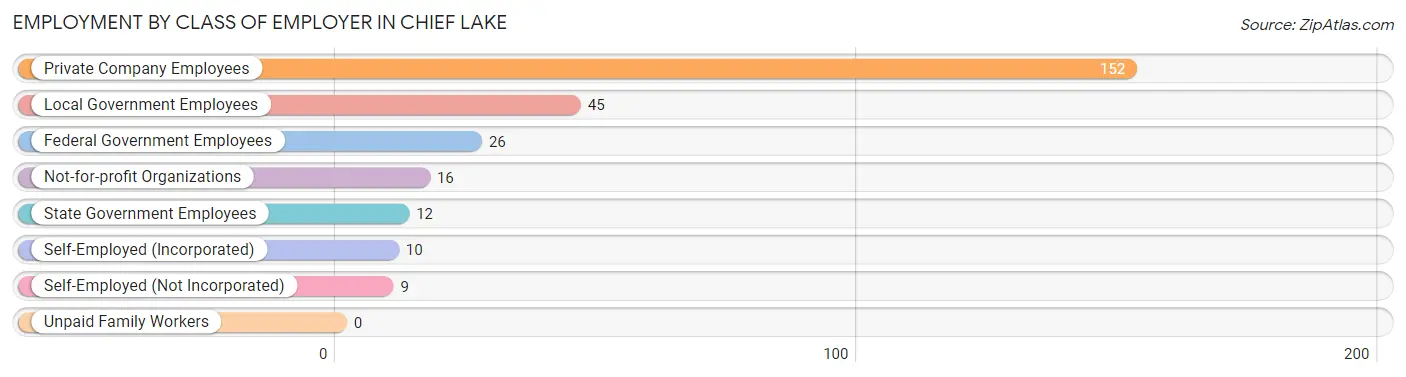
| Employer Class | # Employees | % Employees |
| Private Company Employees | 152 | 56.3% |
| Self-Employed (Incorporated) | 10 | 3.7% |
| Self-Employed (Not Incorporated) | 9 | 3.3% |
| Not-for-profit Organizations | 16 | 5.9% |
| Local Government Employees | 45 | 16.7% |
| State Government Employees | 12 | 4.4% |
| Federal Government Employees | 26 | 9.6% |
| Unpaid Family Workers | 0 | 0.0% |
| Total | 270 | 100.0% |
Employment Status by Age in Chief Lake
According to the labor force statistics for Chief Lake, out of the total population over 16 years of age (495), 59.6% or 295 individuals are in the labor force, with 6.4% or 19 of them unemployed. The age group with the highest labor force participation rate is 30 to 34 years, with 100.0% or 19 individuals in the labor force. Within the labor force, the 25 to 29 years age range has the highest percentage of unemployed individuals, with 34.8% or 16 of them being unemployed.
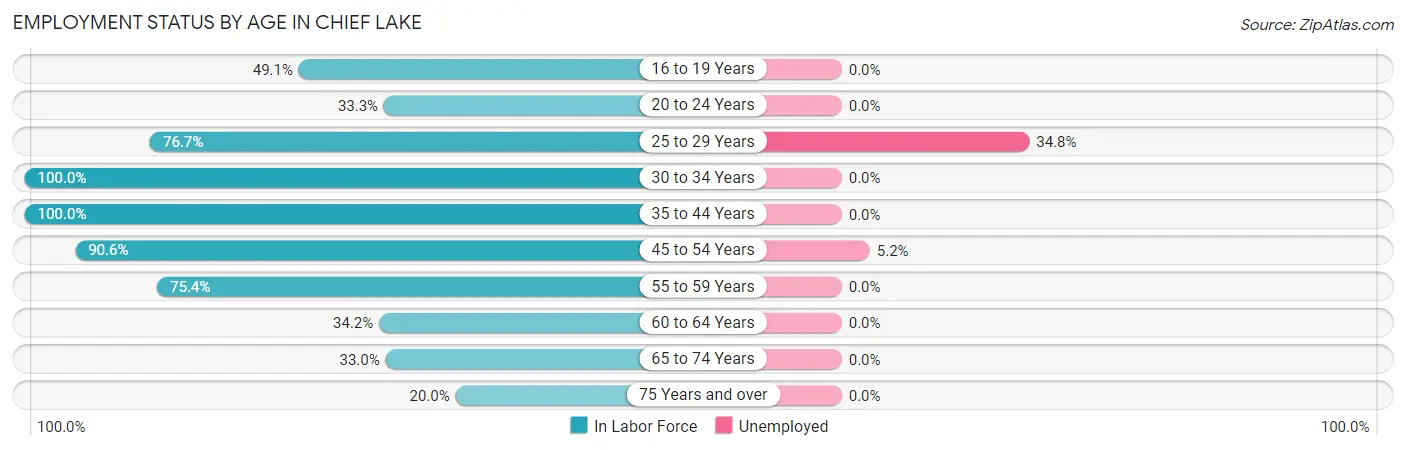
| Age Bracket | In Labor Force | Unemployed |
| 16 to 19 Years | 26 (49.1%) | 0 (0.0%) |
| 20 to 24 Years | 4 (33.3%) | 0 (0.0%) |
| 25 to 29 Years | 46 (76.7%) | 16 (34.8%) |
| 30 to 34 Years | 19 (100.0%) | 0 (0.0%) |
| 35 to 44 Years | 38 (100.0%) | 0 (0.0%) |
| 45 to 54 Years | 58 (90.6%) | 3 (5.2%) |
| 55 to 59 Years | 43 (75.4%) | 0 (0.0%) |
| 60 to 64 Years | 25 (34.2%) | 0 (0.0%) |
| 65 to 74 Years | 31 (33.0%) | 0 (0.0%) |
| 75 Years and over | 5 (20.0%) | 0 (0.0%) |
| Total | 295 (59.6%) | 19 (6.4%) |
Employment Status by Educational Attainment in Chief Lake
According to labor force statistics for Chief Lake, 73.6% of individuals (229) out of the total population between 25 and 64 years of age (311) are in the labor force, with 8.3% or 19 of them being unemployed. The group with the highest labor force participation rate are those with the educational attainment of college / associate degree, with 100.0% or 90 individuals in the labor force. Within the labor force, individuals with high school diploma education have the highest percentage of unemployment, with 30.0% or 12 of them being unemployed.
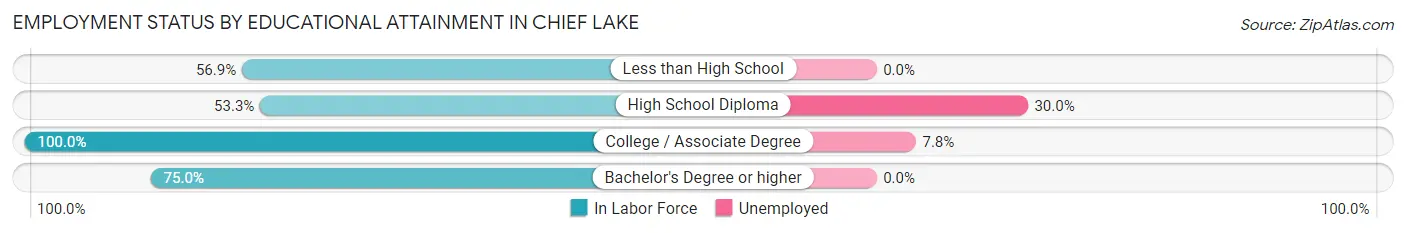
| Educational Attainment | In Labor Force | Unemployed |
| Less than High School | 33 (56.9%) | 0 (0.0%) |
| High School Diploma | 40 (53.3%) | 22 (30.0%) |
| College / Associate Degree | 90 (100.0%) | 7 (7.8%) |
| Bachelor's Degree or higher | 66 (75.0%) | 0 (0.0%) |
| Total | 229 (73.6%) | 26 (8.3%) |
Employment Occupations by Sex in Chief Lake
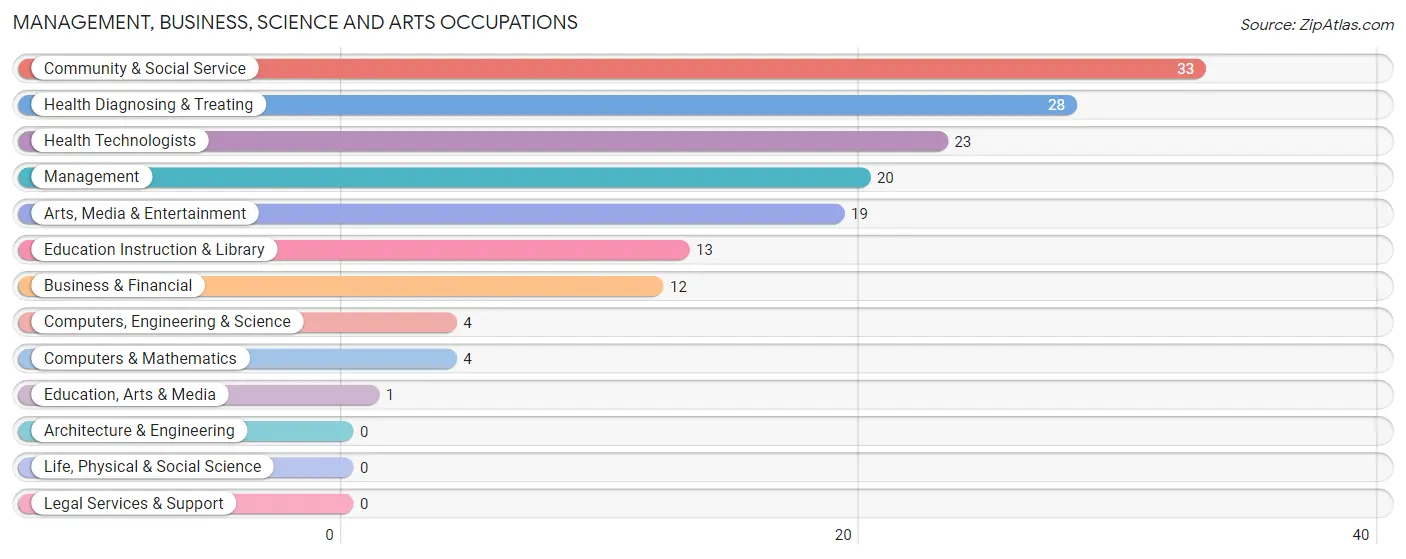
Management, Business, Science and Arts Occupations
The most common Management, Business, Science and Arts occupations in Chief Lake are Community & Social Service (33 | 12.0%), Health Diagnosing & Treating (28 | 10.1%), Health Technologists (23 | 8.3%), Management (20 | 7.2%), and Arts, Media & Entertainment (19 | 6.9%).
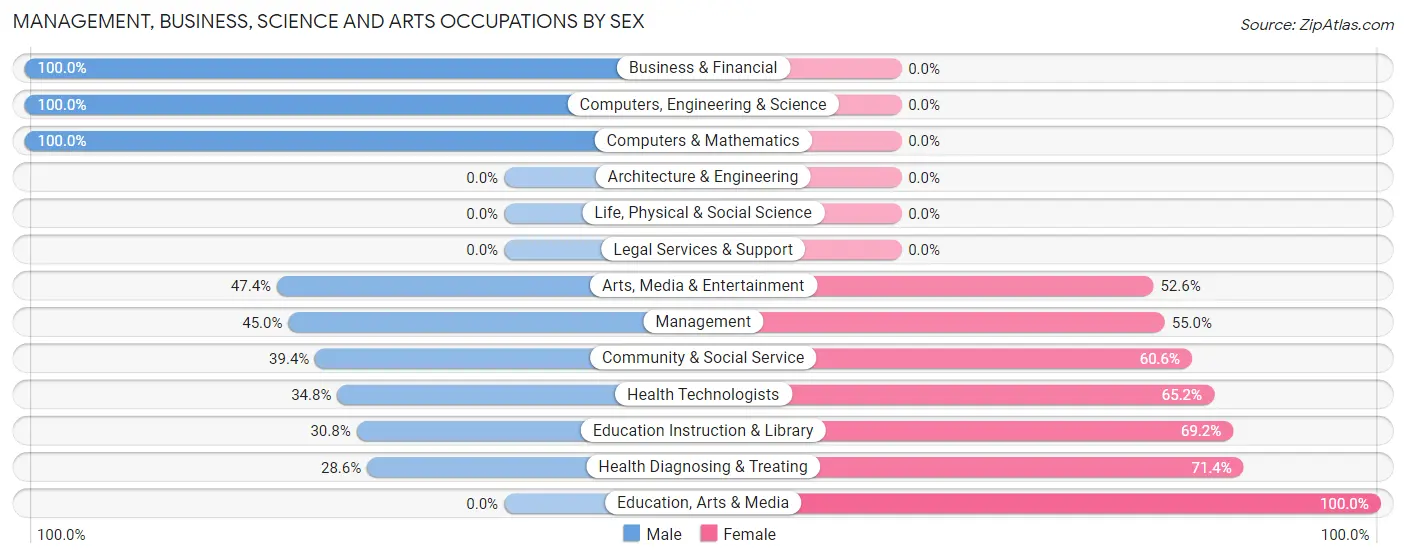
Management, Business, Science and Arts Occupations by Sex
Within the Management, Business, Science and Arts occupations in Chief Lake, the most male-oriented occupations are Business & Financial (100.0%), Computers, Engineering & Science (100.0%), and Computers & Mathematics (100.0%), while the most female-oriented occupations are Education, Arts & Media (100.0%), Health Diagnosing & Treating (71.4%), and Education Instruction & Library (69.2%).
| Occupation | Male | Female |
| Management | 9 (45.0%) | 11 (55.0%) |
| Business & Financial | 12 (100.0%) | 0 (0.0%) |
| Computers, Engineering & Science | 4 (100.0%) | 0 (0.0%) |
| Computers & Mathematics | 4 (100.0%) | 0 (0.0%) |
| Architecture & Engineering | 0 (0.0%) | 0 (0.0%) |
| Life, Physical & Social Science | 0 (0.0%) | 0 (0.0%) |
| Community & Social Service | 13 (39.4%) | 20 (60.6%) |
| Education, Arts & Media | 0 (0.0%) | 1 (100.0%) |
| Legal Services & Support | 0 (0.0%) | 0 (0.0%) |
| Education Instruction & Library | 4 (30.8%) | 9 (69.2%) |
| Arts, Media & Entertainment | 9 (47.4%) | 10 (52.6%) |
| Health Diagnosing & Treating | 8 (28.6%) | 20 (71.4%) |
| Health Technologists | 8 (34.8%) | 15 (65.2%) |
| Total (Category) | 46 (47.4%) | 51 (52.6%) |
| Total (Overall) | 118 (42.7%) | 158 (57.3%) |
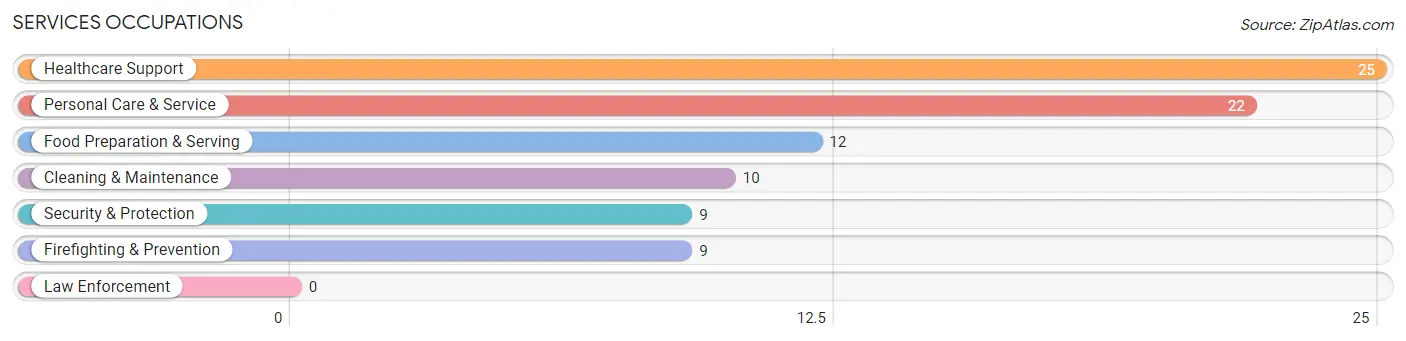
Services Occupations
The most common Services occupations in Chief Lake are Healthcare Support (25 | 9.1%), Personal Care & Service (22 | 8.0%), Food Preparation & Serving (12 | 4.3%), Cleaning & Maintenance (10 | 3.6%), and Security & Protection (9 | 3.3%).
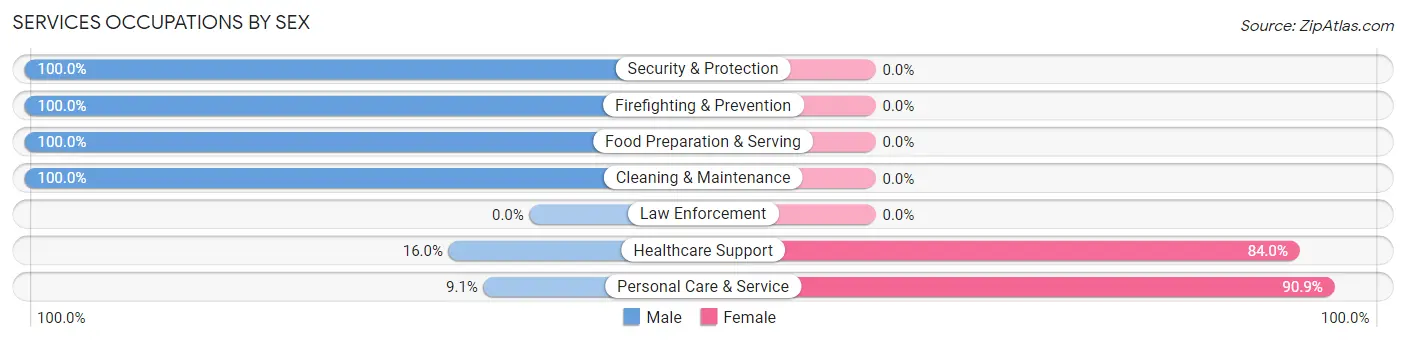
Services Occupations by Sex
Within the Services occupations in Chief Lake, the most male-oriented occupations are Security & Protection (100.0%), Firefighting & Prevention (100.0%), and Food Preparation & Serving (100.0%), while the most female-oriented occupations are Personal Care & Service (90.9%), and Healthcare Support (84.0%).
| Occupation | Male | Female |
| Healthcare Support | 4 (16.0%) | 21 (84.0%) |
| Security & Protection | 9 (100.0%) | 0 (0.0%) |
| Firefighting & Prevention | 9 (100.0%) | 0 (0.0%) |
| Law Enforcement | 0 (0.0%) | 0 (0.0%) |
| Food Preparation & Serving | 12 (100.0%) | 0 (0.0%) |
| Cleaning & Maintenance | 10 (100.0%) | 0 (0.0%) |
| Personal Care & Service | 2 (9.1%) | 20 (90.9%) |
| Total (Category) | 37 (47.4%) | 41 (52.6%) |
| Total (Overall) | 118 (42.7%) | 158 (57.3%) |
Sales and Office Occupations
The most common Sales and Office occupations in Chief Lake are Sales & Related (48 | 17.4%), and Office & Administration (18 | 6.5%).
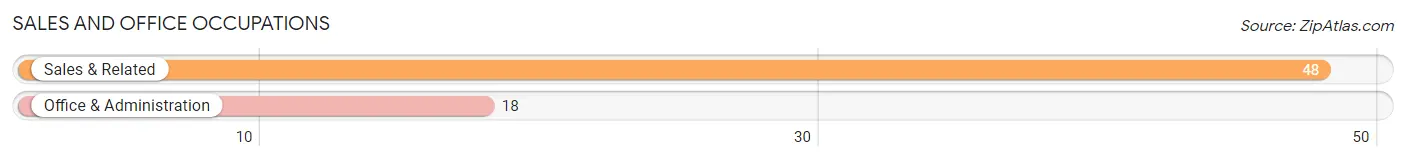
Sales and Office Occupations by Sex
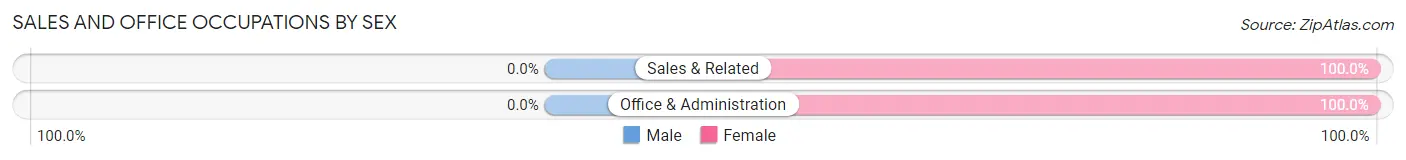
| Occupation | Male | Female |
| Sales & Related | 0 (0.0%) | 48 (100.0%) |
| Office & Administration | 0 (0.0%) | 18 (100.0%) |
| Total (Category) | 0 (0.0%) | 66 (100.0%) |
| Total (Overall) | 118 (42.7%) | 158 (57.3%) |
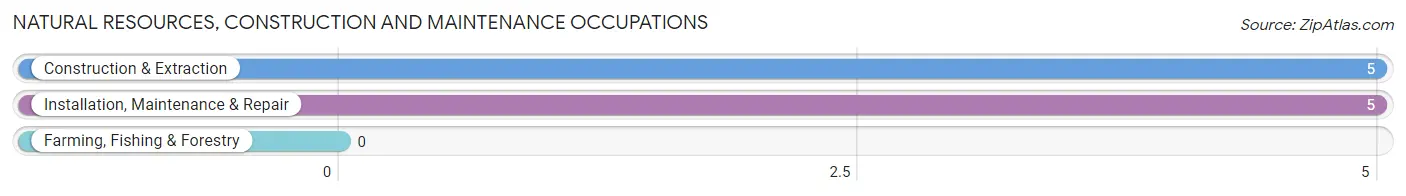
Natural Resources, Construction and Maintenance Occupations
The most common Natural Resources, Construction and Maintenance occupations in Chief Lake are Construction & Extraction (5 | 1.8%), and Installation, Maintenance & Repair (5 | 1.8%).
Natural Resources, Construction and Maintenance Occupations by Sex
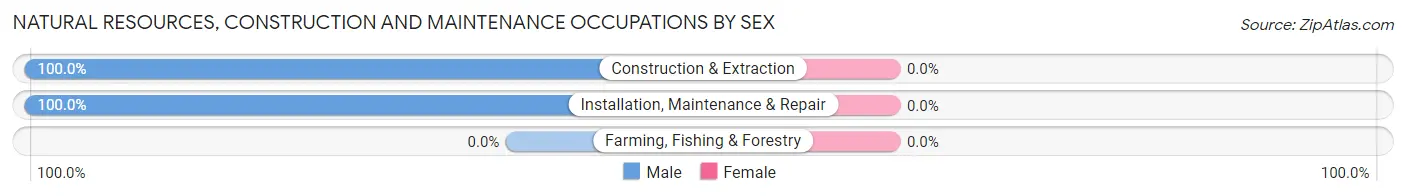
| Occupation | Male | Female |
| Farming, Fishing & Forestry | 0 (0.0%) | 0 (0.0%) |
| Construction & Extraction | 5 (100.0%) | 0 (0.0%) |
| Installation, Maintenance & Repair | 5 (100.0%) | 0 (0.0%) |
| Total (Category) | 10 (100.0%) | 0 (0.0%) |
| Total (Overall) | 118 (42.7%) | 158 (57.3%) |
Production, Transportation and Moving Occupations
The most common Production, Transportation and Moving occupations in Chief Lake are Production (18 | 6.5%), and Transportation (7 | 2.5%).
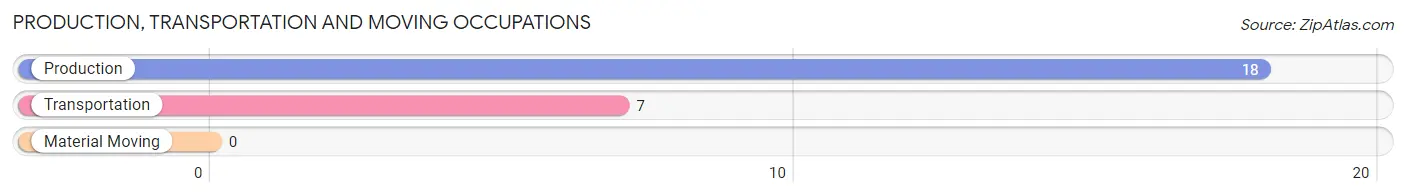
Production, Transportation and Moving Occupations by Sex
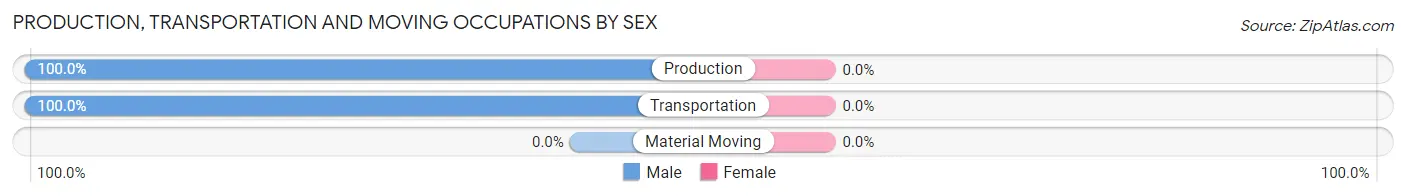
| Occupation | Male | Female |
| Production | 18 (100.0%) | 0 (0.0%) |
| Transportation | 7 (100.0%) | 0 (0.0%) |
| Material Moving | 0 (0.0%) | 0 (0.0%) |
| Total (Category) | 25 (100.0%) | 0 (0.0%) |
| Total (Overall) | 118 (42.7%) | 158 (57.3%) |
Employment Industries by Sex in Chief Lake
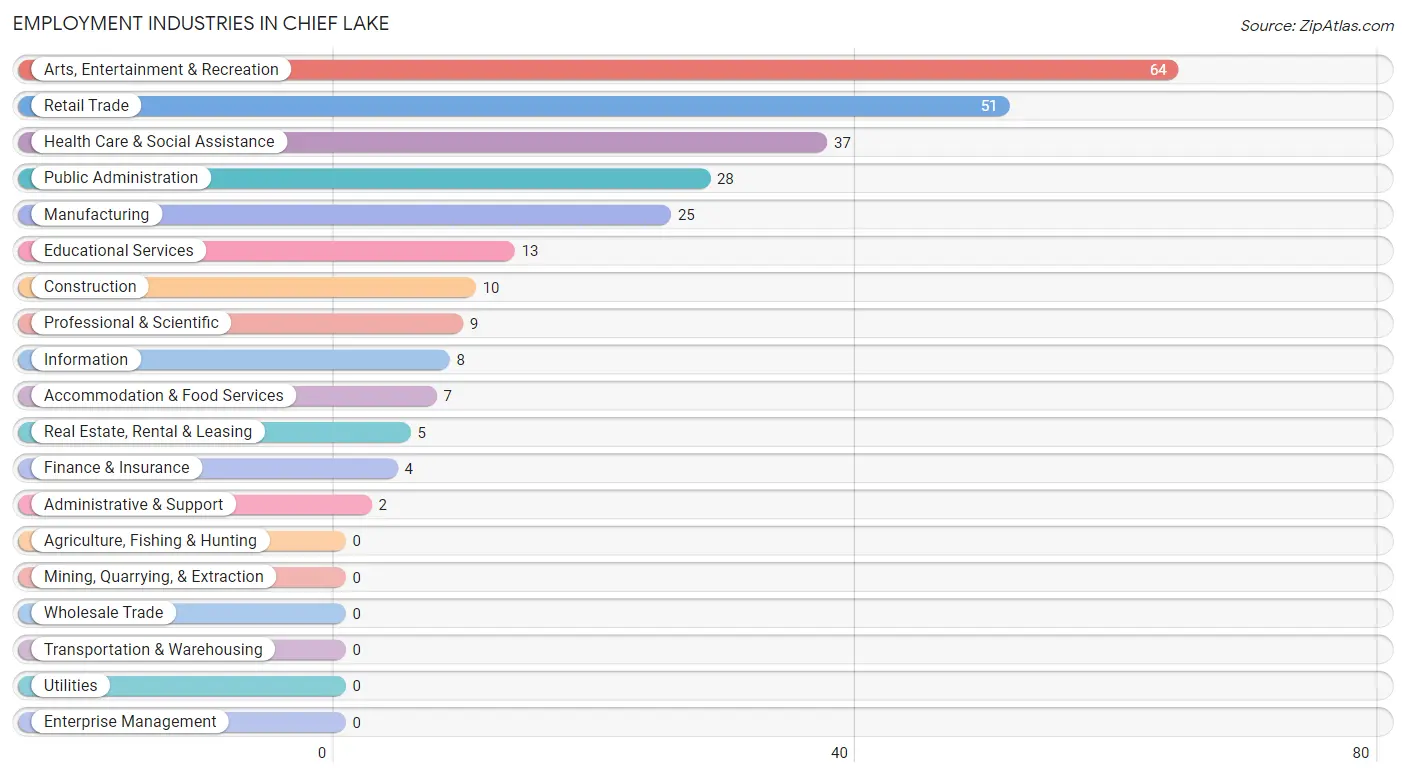
Employment Industries in Chief Lake
The major employment industries in Chief Lake include Arts, Entertainment & Recreation (64 | 23.2%), Retail Trade (51 | 18.5%), Health Care & Social Assistance (37 | 13.4%), Public Administration (28 | 10.1%), and Manufacturing (25 | 9.1%).
Employment Industries by Sex in Chief Lake
The Chief Lake industries that see more men than women are Construction (100.0%), Information (100.0%), and Accommodation & Food Services (100.0%), whereas the industries that tend to have a higher number of women are Finance & Insurance (100.0%), Real Estate, Rental & Leasing (100.0%), and Administrative & Support (100.0%).
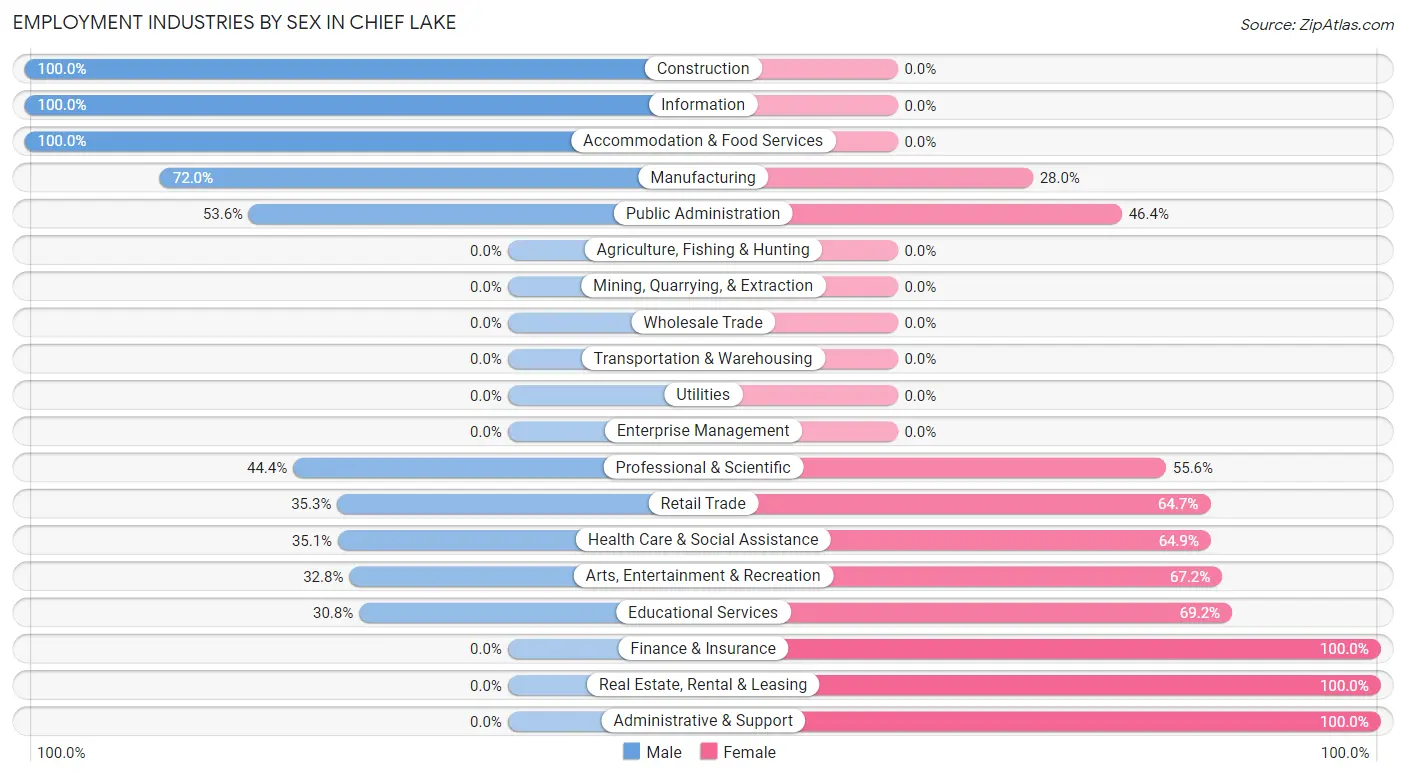
| Industry | Male | Female |
| Agriculture, Fishing & Hunting | 0 (0.0%) | 0 (0.0%) |
| Mining, Quarrying, & Extraction | 0 (0.0%) | 0 (0.0%) |
| Construction | 10 (100.0%) | 0 (0.0%) |
| Manufacturing | 18 (72.0%) | 7 (28.0%) |
| Wholesale Trade | 0 (0.0%) | 0 (0.0%) |
| Retail Trade | 18 (35.3%) | 33 (64.7%) |
| Transportation & Warehousing | 0 (0.0%) | 0 (0.0%) |
| Utilities | 0 (0.0%) | 0 (0.0%) |
| Information | 8 (100.0%) | 0 (0.0%) |
| Finance & Insurance | 0 (0.0%) | 4 (100.0%) |
| Real Estate, Rental & Leasing | 0 (0.0%) | 5 (100.0%) |
| Professional & Scientific | 4 (44.4%) | 5 (55.6%) |
| Enterprise Management | 0 (0.0%) | 0 (0.0%) |
| Administrative & Support | 0 (0.0%) | 2 (100.0%) |
| Educational Services | 4 (30.8%) | 9 (69.2%) |
| Health Care & Social Assistance | 13 (35.1%) | 24 (64.9%) |
| Arts, Entertainment & Recreation | 21 (32.8%) | 43 (67.2%) |
| Accommodation & Food Services | 7 (100.0%) | 0 (0.0%) |
| Public Administration | 15 (53.6%) | 13 (46.4%) |
| Total | 118 (42.7%) | 158 (57.3%) |
Education in Chief Lake
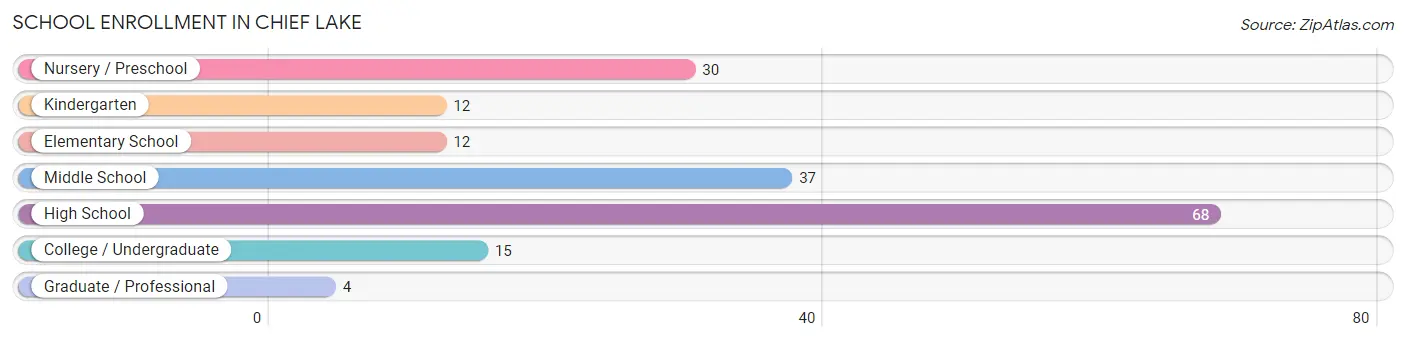
School Enrollment in Chief Lake
The most common levels of schooling among the 178 students in Chief Lake are high school (68 | 38.2%), middle school (37 | 20.8%), and nursery / preschool (30 | 16.9%).
| School Level | # Students | % Students |
| Nursery / Preschool | 30 | 16.9% |
| Kindergarten | 12 | 6.7% |
| Elementary School | 12 | 6.7% |
| Middle School | 37 | 20.8% |
| High School | 68 | 38.2% |
| College / Undergraduate | 15 | 8.4% |
| Graduate / Professional | 4 | 2.2% |
| Total | 178 | 100.0% |
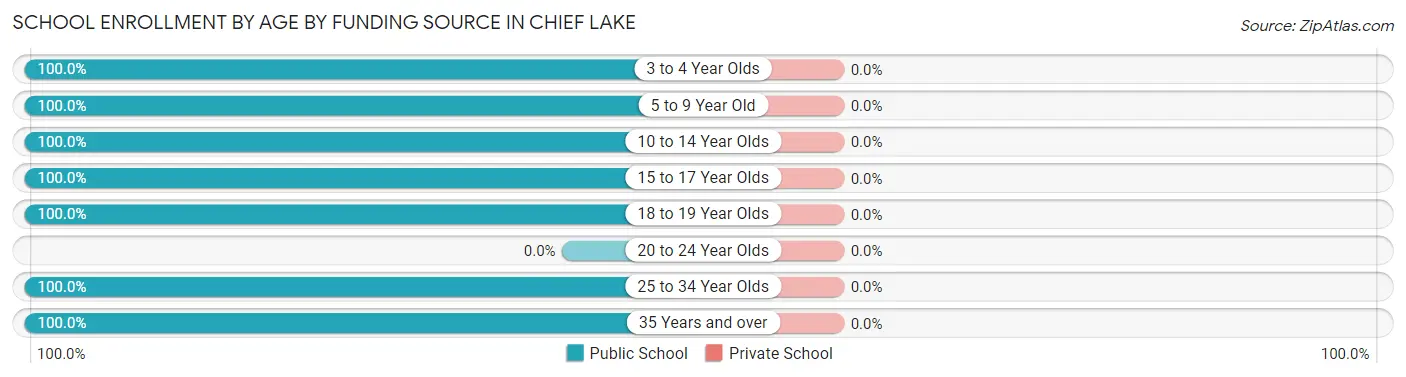
School Enrollment by Age by Funding Source in Chief Lake
| Age Bracket | Public School | Private School |
| 3 to 4 Year Olds | 10 (100.0%) | 0 (0.0%) |
| 5 to 9 Year Old | 44 (100.0%) | 0 (0.0%) |
| 10 to 14 Year Olds | 45 (100.0%) | 0 (0.0%) |
| 15 to 17 Year Olds | 47 (100.0%) | 0 (0.0%) |
| 18 to 19 Year Olds | 10 (100.0%) | 0 (0.0%) |
| 20 to 24 Year Olds | 0 (0.0%) | 0 (0.0%) |
| 25 to 34 Year Olds | 6 (100.0%) | 0 (0.0%) |
| 35 Years and over | 16 (100.0%) | 0 (0.0%) |
| Total | 178 (100.0%) | 0 (0.0%) |
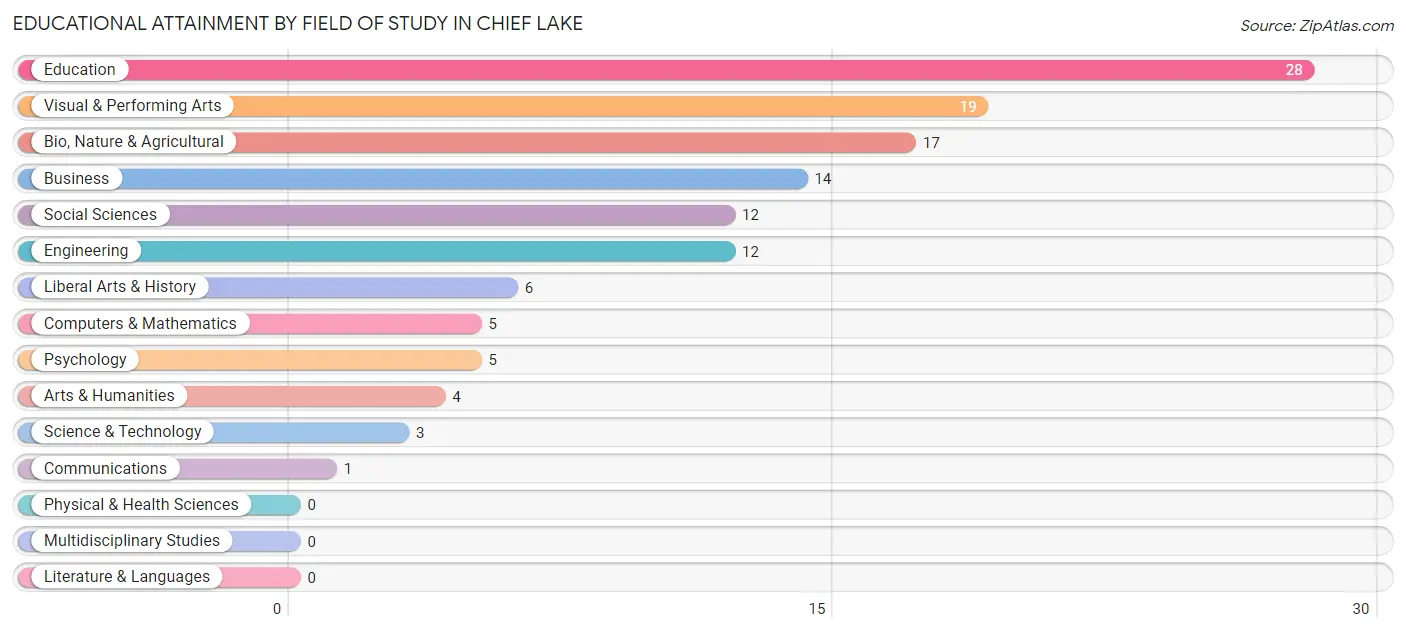
Educational Attainment by Field of Study in Chief Lake
Education (28 | 22.2%), visual & performing arts (19 | 15.1%), bio, nature & agricultural (17 | 13.5%), business (14 | 11.1%), and social sciences (12 | 9.5%) are the most common fields of study among 126 individuals in Chief Lake who have obtained a bachelor's degree or higher.
| Field of Study | # Graduates | % Graduates |
| Computers & Mathematics | 5 | 4.0% |
| Bio, Nature & Agricultural | 17 | 13.5% |
| Physical & Health Sciences | 0 | 0.0% |
| Psychology | 5 | 4.0% |
| Social Sciences | 12 | 9.5% |
| Engineering | 12 | 9.5% |
| Multidisciplinary Studies | 0 | 0.0% |
| Science & Technology | 3 | 2.4% |
| Business | 14 | 11.1% |
| Education | 28 | 22.2% |
| Literature & Languages | 0 | 0.0% |
| Liberal Arts & History | 6 | 4.8% |
| Visual & Performing Arts | 19 | 15.1% |
| Communications | 1 | 0.8% |
| Arts & Humanities | 4 | 3.2% |
| Total | 126 | 100.0% |
Transportation & Commute in Chief Lake
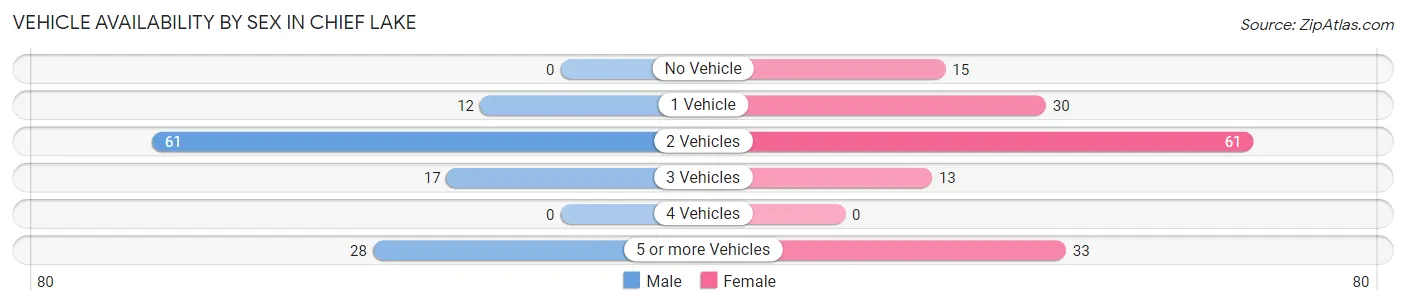
Vehicle Availability by Sex in Chief Lake
The most prevalent vehicle ownership categories in Chief Lake are males with 2 vehicles (61, accounting for 51.7%) and females with 2 vehicles (61, making up 40.1%).
| Vehicles Available | Male | Female |
| No Vehicle | 0 (0.0%) | 15 (9.9%) |
| 1 Vehicle | 12 (10.2%) | 30 (19.7%) |
| 2 Vehicles | 61 (51.7%) | 61 (40.1%) |
| 3 Vehicles | 17 (14.4%) | 13 (8.6%) |
| 4 Vehicles | 0 (0.0%) | 0 (0.0%) |
| 5 or more Vehicles | 28 (23.7%) | 33 (21.7%) |
| Total | 118 (100.0%) | 152 (100.0%) |
Commute Time in Chief Lake
The most frequently occuring commute durations in Chief Lake are 10 to 14 minutes (79 commuters, 32.5%), 15 to 19 minutes (73 commuters, 30.0%), and 20 to 24 minutes (54 commuters, 22.2%).
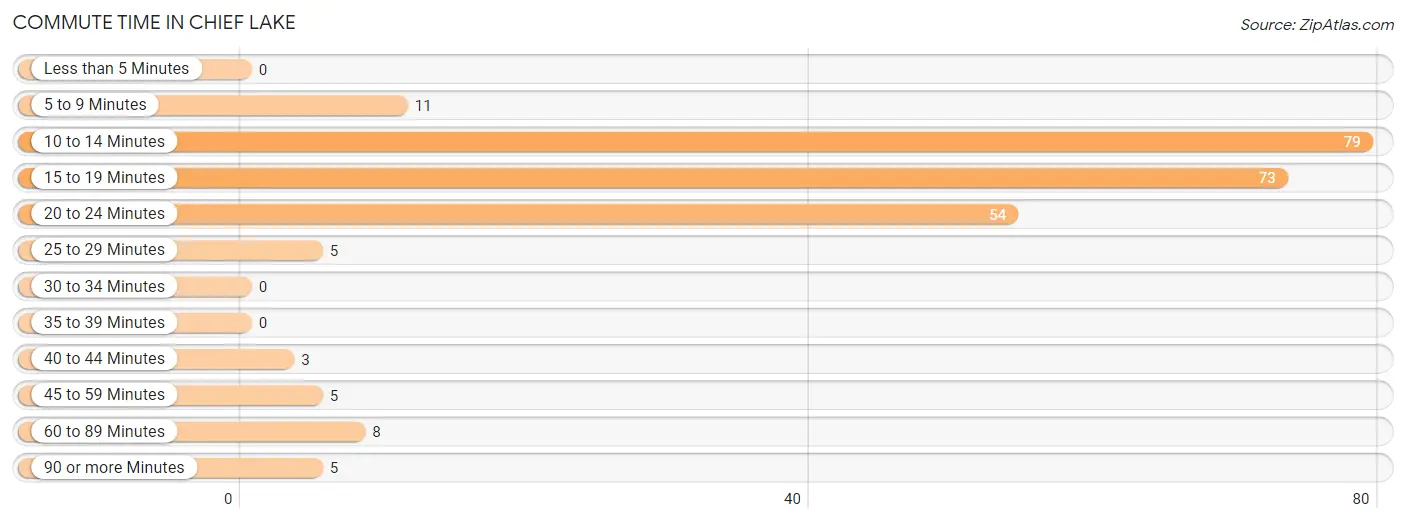
| Commute Time | # Commuters | % Commuters |
| Less than 5 Minutes | 0 | 0.0% |
| 5 to 9 Minutes | 11 | 4.5% |
| 10 to 14 Minutes | 79 | 32.5% |
| 15 to 19 Minutes | 73 | 30.0% |
| 20 to 24 Minutes | 54 | 22.2% |
| 25 to 29 Minutes | 5 | 2.1% |
| 30 to 34 Minutes | 0 | 0.0% |
| 35 to 39 Minutes | 0 | 0.0% |
| 40 to 44 Minutes | 3 | 1.2% |
| 45 to 59 Minutes | 5 | 2.1% |
| 60 to 89 Minutes | 8 | 3.3% |
| 90 or more Minutes | 5 | 2.1% |
Commute Time by Sex in Chief Lake
The most common commute times in Chief Lake are 10 to 14 minutes (43 commuters, 36.7%) for males and 15 to 19 minutes (41 commuters, 32.5%) for females.
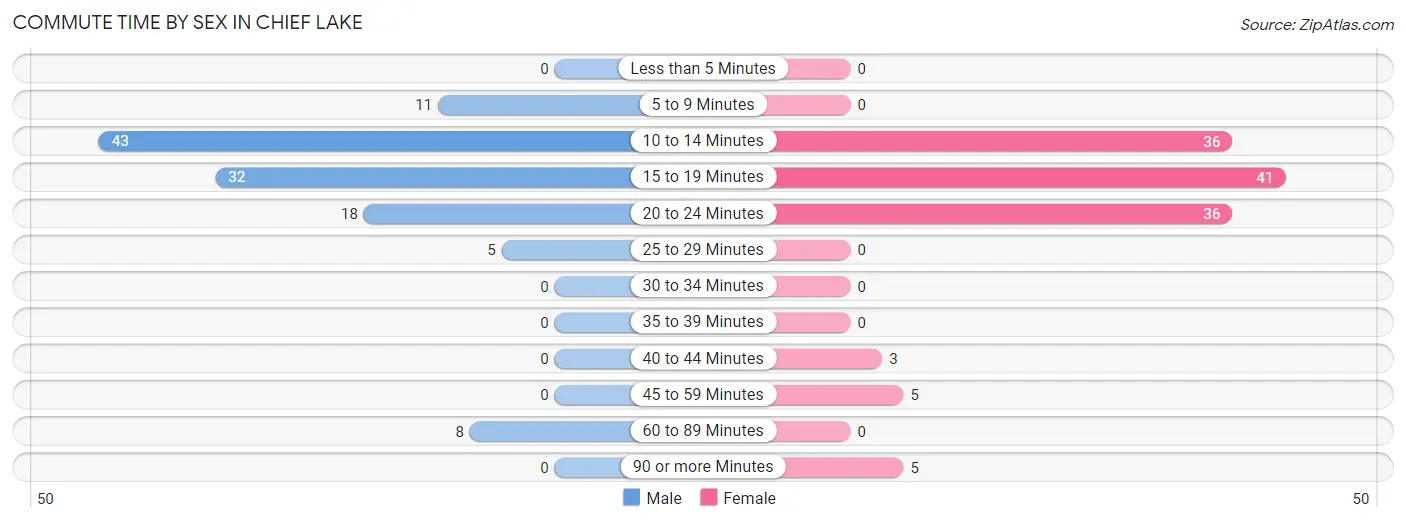
| Commute Time | Male | Female |
| Less than 5 Minutes | 0 (0.0%) | 0 (0.0%) |
| 5 to 9 Minutes | 11 (9.4%) | 0 (0.0%) |
| 10 to 14 Minutes | 43 (36.7%) | 36 (28.6%) |
| 15 to 19 Minutes | 32 (27.4%) | 41 (32.5%) |
| 20 to 24 Minutes | 18 (15.4%) | 36 (28.6%) |
| 25 to 29 Minutes | 5 (4.3%) | 0 (0.0%) |
| 30 to 34 Minutes | 0 (0.0%) | 0 (0.0%) |
| 35 to 39 Minutes | 0 (0.0%) | 0 (0.0%) |
| 40 to 44 Minutes | 0 (0.0%) | 3 (2.4%) |
| 45 to 59 Minutes | 0 (0.0%) | 5 (4.0%) |
| 60 to 89 Minutes | 8 (6.8%) | 0 (0.0%) |
| 90 or more Minutes | 0 (0.0%) | 5 (4.0%) |
Time of Departure to Work by Sex in Chief Lake
The most frequent times of departure to work in Chief Lake are 7:30 AM to 7:59 AM (37, 31.6%) for males and 7:30 AM to 7:59 AM (26, 20.6%) for females.
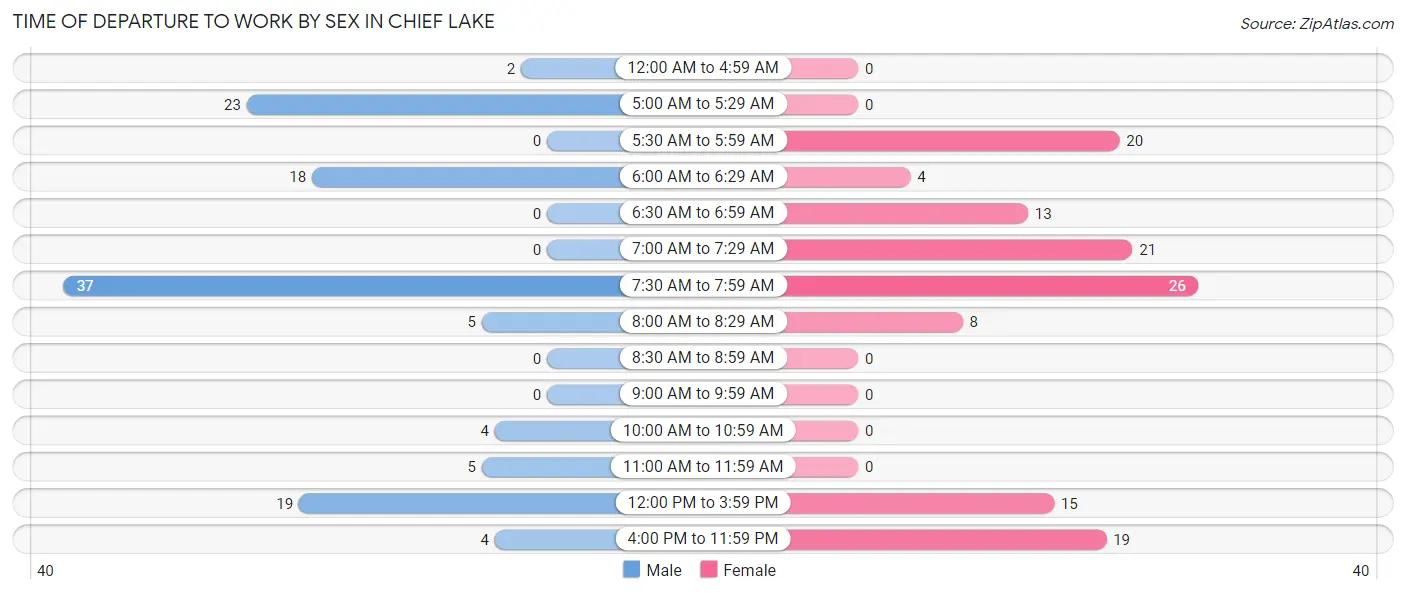
| Time of Departure | Male | Female |
| 12:00 AM to 4:59 AM | 2 (1.7%) | 0 (0.0%) |
| 5:00 AM to 5:29 AM | 23 (19.7%) | 0 (0.0%) |
| 5:30 AM to 5:59 AM | 0 (0.0%) | 20 (15.9%) |
| 6:00 AM to 6:29 AM | 18 (15.4%) | 4 (3.2%) |
| 6:30 AM to 6:59 AM | 0 (0.0%) | 13 (10.3%) |
| 7:00 AM to 7:29 AM | 0 (0.0%) | 21 (16.7%) |
| 7:30 AM to 7:59 AM | 37 (31.6%) | 26 (20.6%) |
| 8:00 AM to 8:29 AM | 5 (4.3%) | 8 (6.4%) |
| 8:30 AM to 8:59 AM | 0 (0.0%) | 0 (0.0%) |
| 9:00 AM to 9:59 AM | 0 (0.0%) | 0 (0.0%) |
| 10:00 AM to 10:59 AM | 4 (3.4%) | 0 (0.0%) |
| 11:00 AM to 11:59 AM | 5 (4.3%) | 0 (0.0%) |
| 12:00 PM to 3:59 PM | 19 (16.2%) | 15 (11.9%) |
| 4:00 PM to 11:59 PM | 4 (3.4%) | 19 (15.1%) |
| Total | 117 (100.0%) | 126 (100.0%) |
Housing Occupancy in Chief Lake
Occupancy by Ownership in Chief Lake
Of the total 252 dwellings in Chief Lake, owner-occupied units account for 202 (80.2%), while renter-occupied units make up 50 (19.8%).
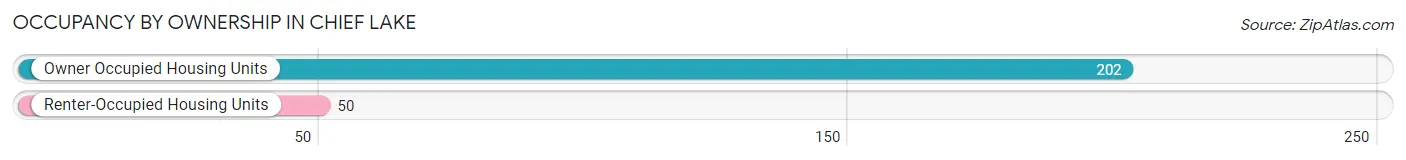
| Occupancy | # Housing Units | % Housing Units |
| Owner Occupied Housing Units | 202 | 80.2% |
| Renter-Occupied Housing Units | 50 | 19.8% |
| Total Occupied Housing Units | 252 | 100.0% |
Occupancy by Household Size in Chief Lake
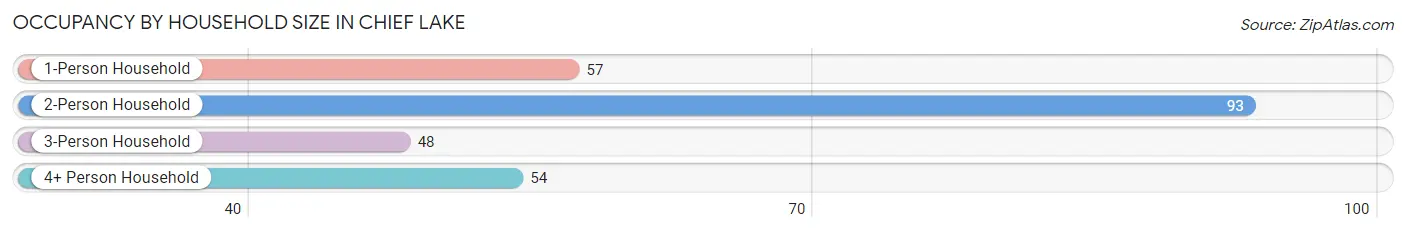
| Household Size | # Housing Units | % Housing Units |
| 1-Person Household | 57 | 22.6% |
| 2-Person Household | 93 | 36.9% |
| 3-Person Household | 48 | 19.1% |
| 4+ Person Household | 54 | 21.4% |
| Total Housing Units | 252 | 100.0% |
Occupancy by Ownership by Household Size in Chief Lake
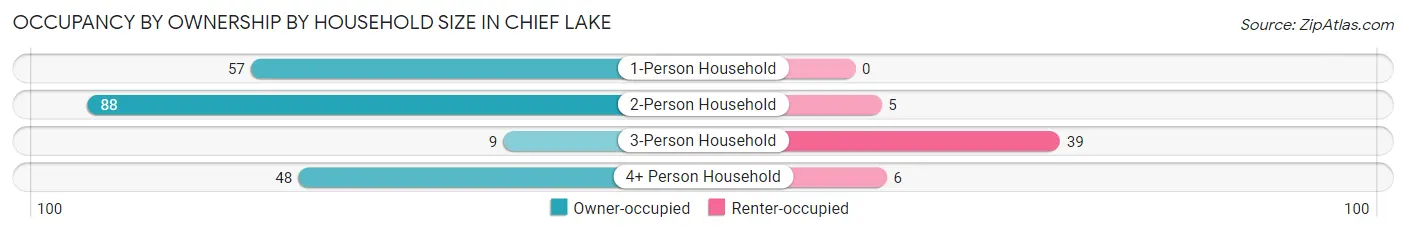
| Household Size | Owner-occupied | Renter-occupied |
| 1-Person Household | 57 (100.0%) | 0 (0.0%) |
| 2-Person Household | 88 (94.6%) | 5 (5.4%) |
| 3-Person Household | 9 (18.8%) | 39 (81.2%) |
| 4+ Person Household | 48 (88.9%) | 6 (11.1%) |
| Total Housing Units | 202 (80.2%) | 50 (19.8%) |
Occupancy by Educational Attainment in Chief Lake
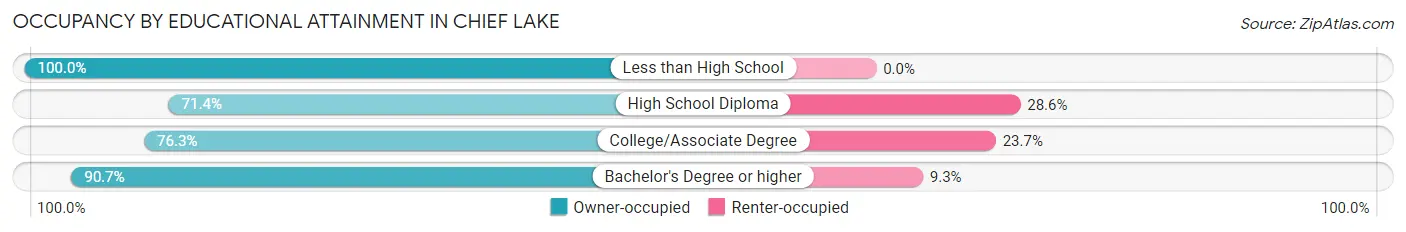
| Household Size | Owner-occupied | Renter-occupied |
| Less than High School | 24 (100.0%) | 0 (0.0%) |
| High School Diploma | 55 (71.4%) | 22 (28.6%) |
| College/Associate Degree | 74 (76.3%) | 23 (23.7%) |
| Bachelor's Degree or higher | 49 (90.7%) | 5 (9.3%) |
Occupancy by Age of Householder in Chief Lake
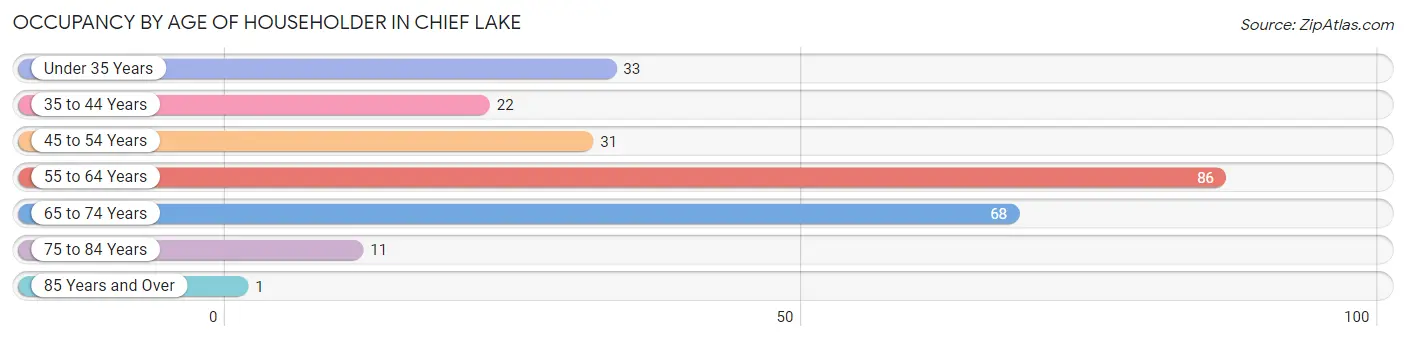
| Age Bracket | # Households | % Households |
| Under 35 Years | 33 | 13.1% |
| 35 to 44 Years | 22 | 8.7% |
| 45 to 54 Years | 31 | 12.3% |
| 55 to 64 Years | 86 | 34.1% |
| 65 to 74 Years | 68 | 27.0% |
| 75 to 84 Years | 11 | 4.4% |
| 85 Years and Over | 1 | 0.4% |
| Total | 252 | 100.0% |
Housing Finances in Chief Lake
Median Income by Occupancy in Chief Lake
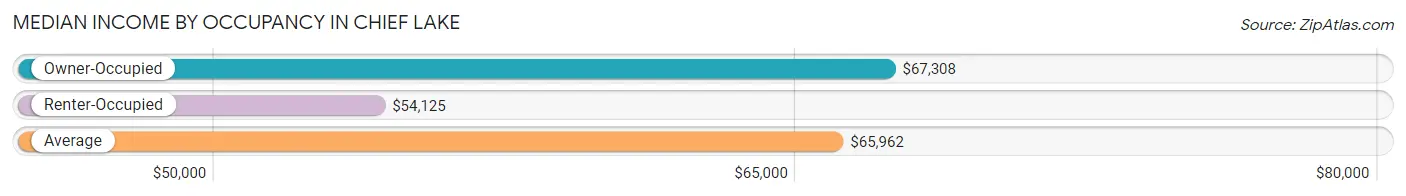
| Occupancy Type | # Households | Median Income |
| Owner-Occupied | 202 (80.2%) | $67,308 |
| Renter-Occupied | 50 (19.8%) | $54,125 |
| Average | 252 (100.0%) | $65,962 |
Occupancy by Householder Income Bracket in Chief Lake
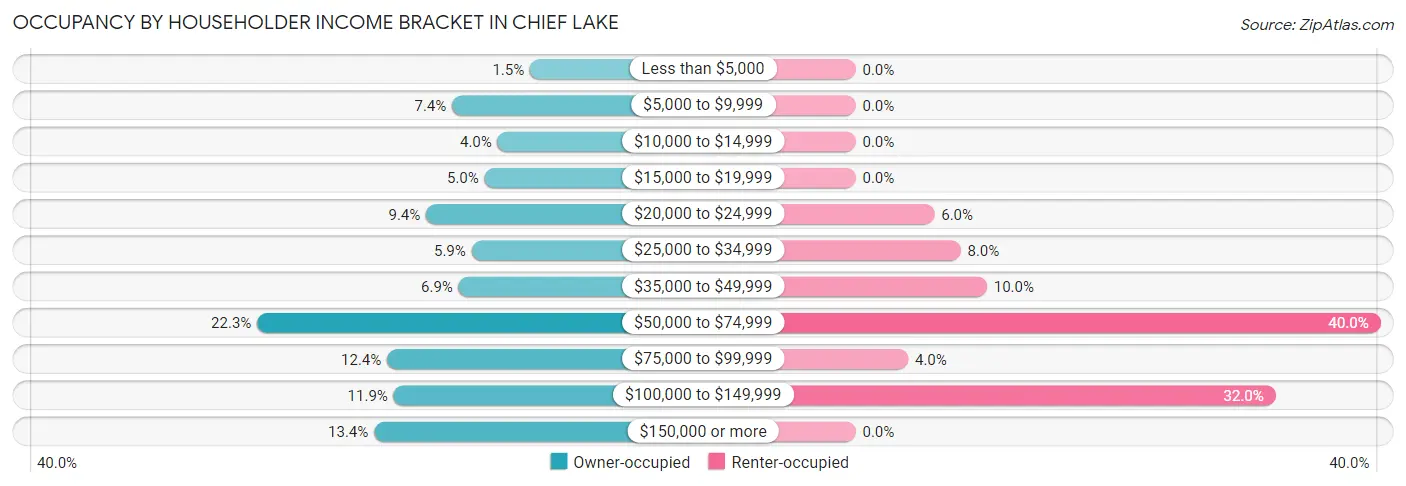
| Income Bracket | Owner-occupied | Renter-occupied |
| Less than $5,000 | 3 (1.5%) | 0 (0.0%) |
| $5,000 to $9,999 | 15 (7.4%) | 0 (0.0%) |
| $10,000 to $14,999 | 8 (4.0%) | 0 (0.0%) |
| $15,000 to $19,999 | 10 (5.0%) | 0 (0.0%) |
| $20,000 to $24,999 | 19 (9.4%) | 3 (6.0%) |
| $25,000 to $34,999 | 12 (5.9%) | 4 (8.0%) |
| $35,000 to $49,999 | 14 (6.9%) | 5 (10.0%) |
| $50,000 to $74,999 | 45 (22.3%) | 20 (40.0%) |
| $75,000 to $99,999 | 25 (12.4%) | 2 (4.0%) |
| $100,000 to $149,999 | 24 (11.9%) | 16 (32.0%) |
| $150,000 or more | 27 (13.4%) | 0 (0.0%) |
| Total | 202 (100.0%) | 50 (100.0%) |
Monthly Housing Cost Tiers in Chief Lake
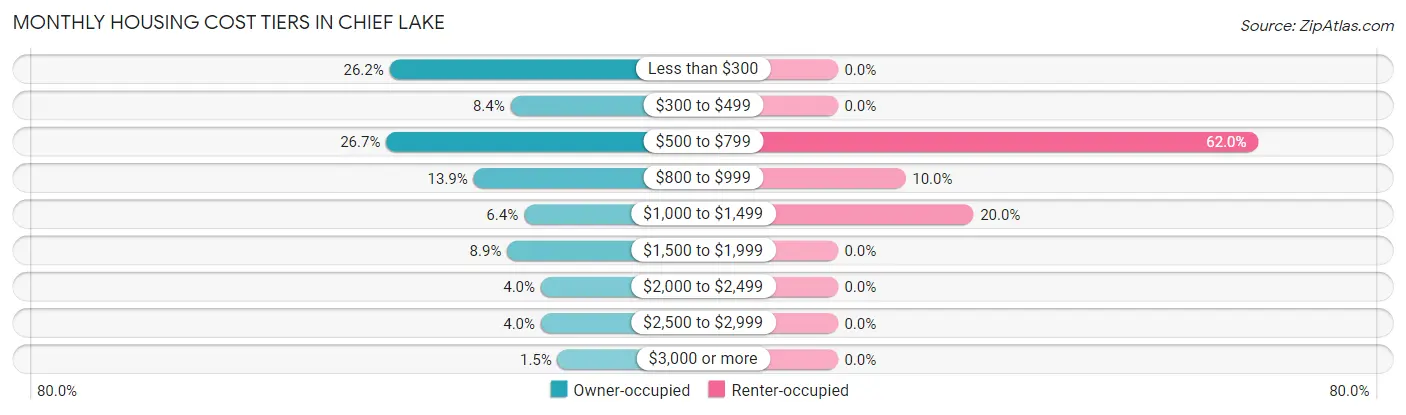
| Monthly Cost | Owner-occupied | Renter-occupied |
| Less than $300 | 53 (26.2%) | 0 (0.0%) |
| $300 to $499 | 17 (8.4%) | 0 (0.0%) |
| $500 to $799 | 54 (26.7%) | 31 (62.0%) |
| $800 to $999 | 28 (13.9%) | 5 (10.0%) |
| $1,000 to $1,499 | 13 (6.4%) | 10 (20.0%) |
| $1,500 to $1,999 | 18 (8.9%) | 0 (0.0%) |
| $2,000 to $2,499 | 8 (4.0%) | 0 (0.0%) |
| $2,500 to $2,999 | 8 (4.0%) | 0 (0.0%) |
| $3,000 or more | 3 (1.5%) | 0 (0.0%) |
| Total | 202 (100.0%) | 50 (100.0%) |
Physical Housing Characteristics in Chief Lake
Housing Structures in Chief Lake
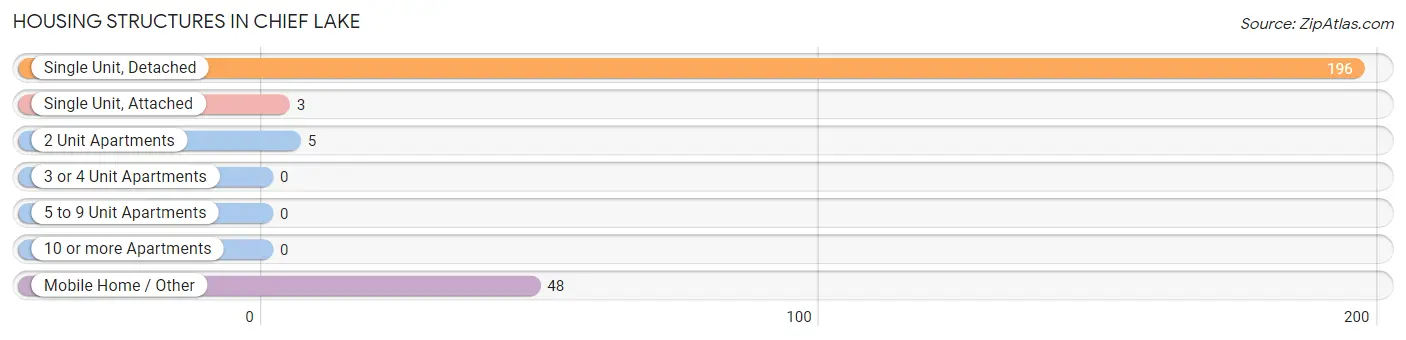
| Structure Type | # Housing Units | % Housing Units |
| Single Unit, Detached | 196 | 77.8% |
| Single Unit, Attached | 3 | 1.2% |
| 2 Unit Apartments | 5 | 2.0% |
| 3 or 4 Unit Apartments | 0 | 0.0% |
| 5 to 9 Unit Apartments | 0 | 0.0% |
| 10 or more Apartments | 0 | 0.0% |
| Mobile Home / Other | 48 | 19.1% |
| Total | 252 | 100.0% |
Housing Structures by Occupancy in Chief Lake
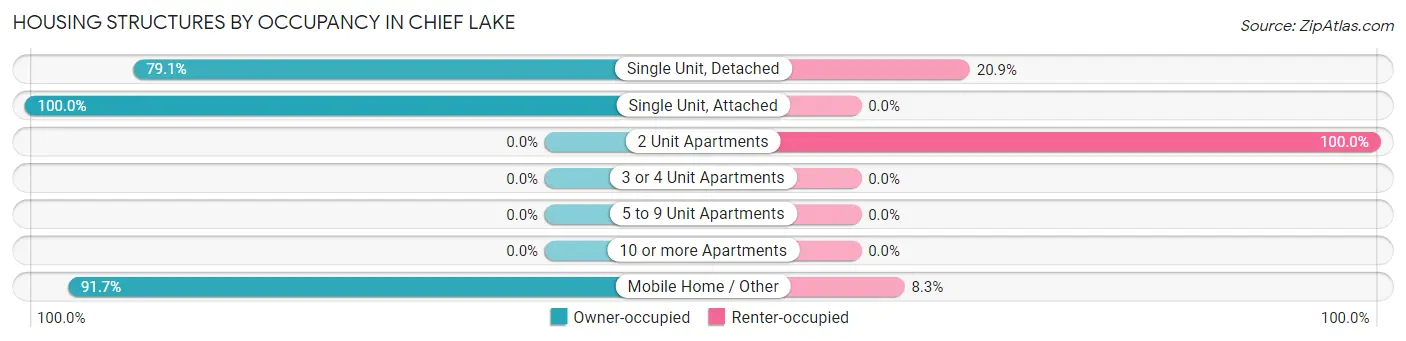
| Structure Type | Owner-occupied | Renter-occupied |
| Single Unit, Detached | 155 (79.1%) | 41 (20.9%) |
| Single Unit, Attached | 3 (100.0%) | 0 (0.0%) |
| 2 Unit Apartments | 0 (0.0%) | 5 (100.0%) |
| 3 or 4 Unit Apartments | 0 (0.0%) | 0 (0.0%) |
| 5 to 9 Unit Apartments | 0 (0.0%) | 0 (0.0%) |
| 10 or more Apartments | 0 (0.0%) | 0 (0.0%) |
| Mobile Home / Other | 44 (91.7%) | 4 (8.3%) |
| Total | 202 (80.2%) | 50 (19.8%) |
Housing Structures by Number of Rooms in Chief Lake
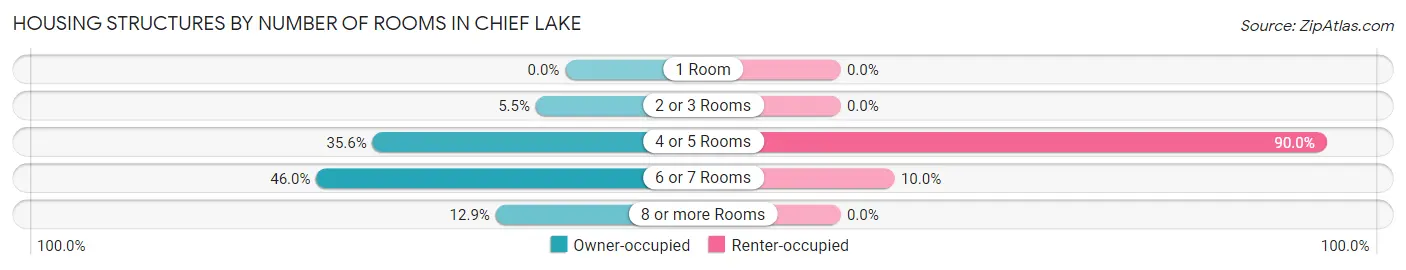
| Number of Rooms | Owner-occupied | Renter-occupied |
| 1 Room | 0 (0.0%) | 0 (0.0%) |
| 2 or 3 Rooms | 11 (5.4%) | 0 (0.0%) |
| 4 or 5 Rooms | 72 (35.6%) | 45 (90.0%) |
| 6 or 7 Rooms | 93 (46.0%) | 5 (10.0%) |
| 8 or more Rooms | 26 (12.9%) | 0 (0.0%) |
| Total | 202 (100.0%) | 50 (100.0%) |
Housing Structure by Heating Type in Chief Lake
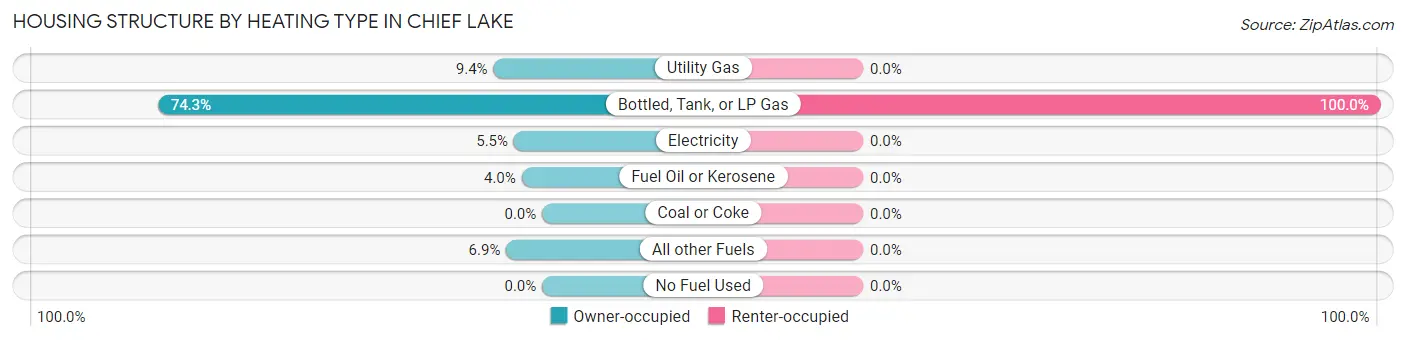
| Heating Type | Owner-occupied | Renter-occupied |
| Utility Gas | 19 (9.4%) | 0 (0.0%) |
| Bottled, Tank, or LP Gas | 150 (74.3%) | 50 (100.0%) |
| Electricity | 11 (5.4%) | 0 (0.0%) |
| Fuel Oil or Kerosene | 8 (4.0%) | 0 (0.0%) |
| Coal or Coke | 0 (0.0%) | 0 (0.0%) |
| All other Fuels | 14 (6.9%) | 0 (0.0%) |
| No Fuel Used | 0 (0.0%) | 0 (0.0%) |
| Total | 202 (100.0%) | 50 (100.0%) |
Household Vehicle Usage in Chief Lake
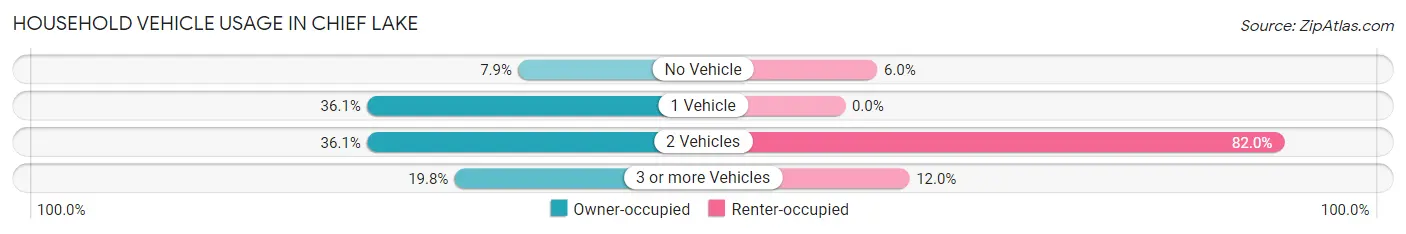
| Vehicles per Household | Owner-occupied | Renter-occupied |
| No Vehicle | 16 (7.9%) | 3 (6.0%) |
| 1 Vehicle | 73 (36.1%) | 0 (0.0%) |
| 2 Vehicles | 73 (36.1%) | 41 (82.0%) |
| 3 or more Vehicles | 40 (19.8%) | 6 (12.0%) |
| Total | 202 (100.0%) | 50 (100.0%) |
Real Estate & Mortgages in Chief Lake
Real Estate and Mortgage Overview in Chief Lake
| Characteristic | Without Mortgage | With Mortgage |
| Housing Units | 136 | 66 |
| Median Property Value | - | - |
| Median Household Income | $58,125 | $12 |
| Monthly Housing Costs | $450 | $3 |
| Real Estate Taxes | $4,735 | $23 |
Property Value by Mortgage Status in Chief Lake
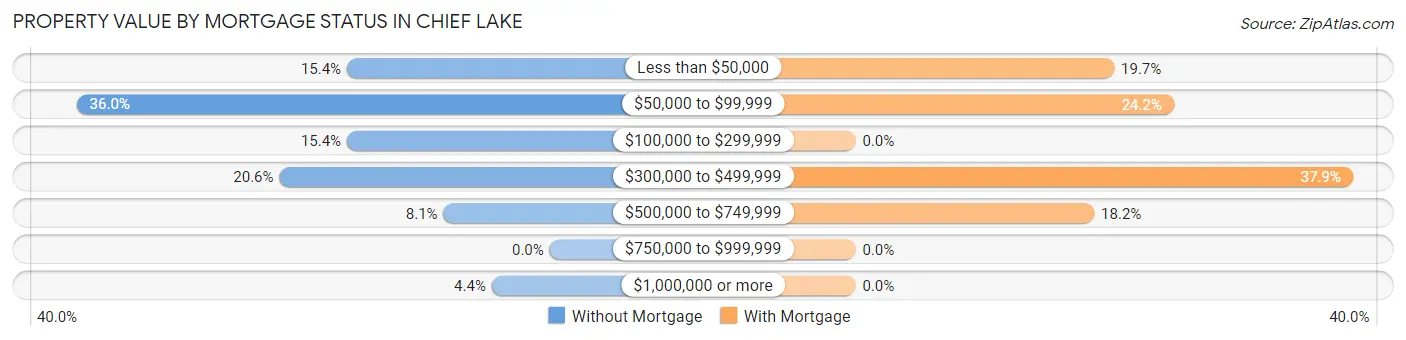
| Property Value | Without Mortgage | With Mortgage |
| Less than $50,000 | 21 (15.4%) | 13 (19.7%) |
| $50,000 to $99,999 | 49 (36.0%) | 16 (24.2%) |
| $100,000 to $299,999 | 21 (15.4%) | 0 (0.0%) |
| $300,000 to $499,999 | 28 (20.6%) | 25 (37.9%) |
| $500,000 to $749,999 | 11 (8.1%) | 12 (18.2%) |
| $750,000 to $999,999 | 0 (0.0%) | 0 (0.0%) |
| $1,000,000 or more | 6 (4.4%) | 0 (0.0%) |
| Total | 136 (100.0%) | 66 (100.0%) |
Household Income by Mortgage Status in Chief Lake
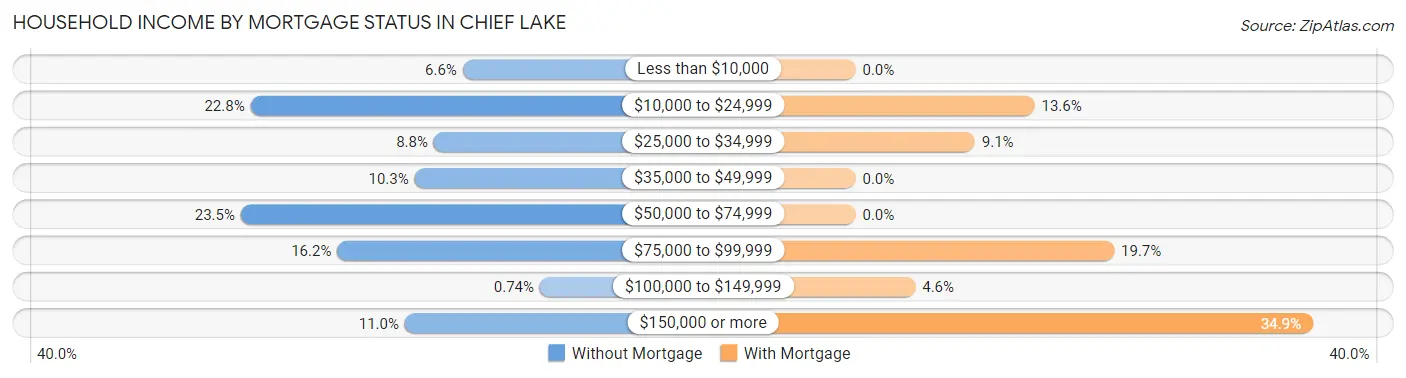
| Household Income | Without Mortgage | With Mortgage |
| Less than $10,000 | 9 (6.6%) | 0 (0.0%) |
| $10,000 to $24,999 | 31 (22.8%) | 9 (13.6%) |
| $25,000 to $34,999 | 12 (8.8%) | 6 (9.1%) |
| $35,000 to $49,999 | 14 (10.3%) | 0 (0.0%) |
| $50,000 to $74,999 | 32 (23.5%) | 0 (0.0%) |
| $75,000 to $99,999 | 22 (16.2%) | 13 (19.7%) |
| $100,000 to $149,999 | 1 (0.7%) | 3 (4.5%) |
| $150,000 or more | 15 (11.0%) | 23 (34.8%) |
| Total | 136 (100.0%) | 66 (100.0%) |
Property Value to Household Income Ratio in Chief Lake
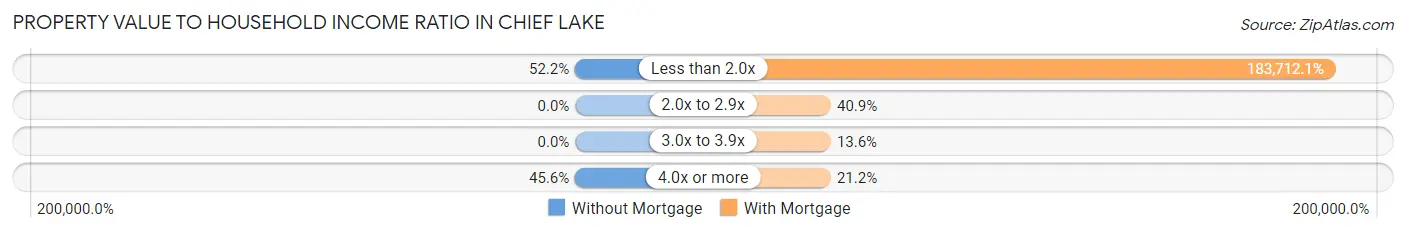
| Value-to-Income Ratio | Without Mortgage | With Mortgage |
| Less than 2.0x | 71 (52.2%) | 121,250 (183,712.1%) |
| 2.0x to 2.9x | 0 (0.0%) | 27 (40.9%) |
| 3.0x to 3.9x | 0 (0.0%) | 9 (13.6%) |
| 4.0x or more | 62 (45.6%) | 14 (21.2%) |
| Total | 136 (100.0%) | 66 (100.0%) |
Real Estate Taxes by Mortgage Status in Chief Lake
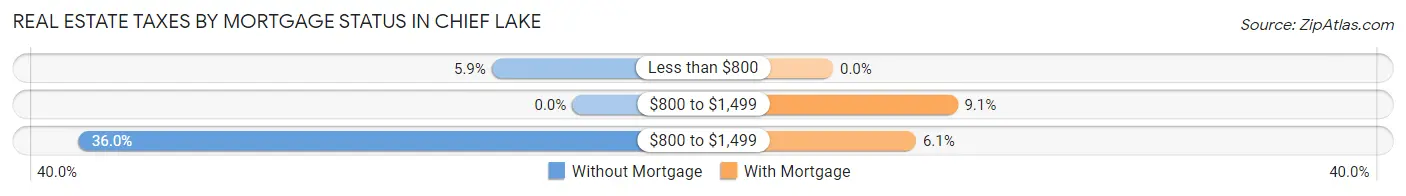
| Property Taxes | Without Mortgage | With Mortgage |
| Less than $800 | 8 (5.9%) | 0 (0.0%) |
| $800 to $1,499 | 0 (0.0%) | 6 (9.1%) |
| $800 to $1,499 | 49 (36.0%) | 4 (6.1%) |
| Total | 136 (100.0%) | 66 (100.0%) |
Health & Disability in Chief Lake
Health Insurance Coverage by Age in Chief Lake
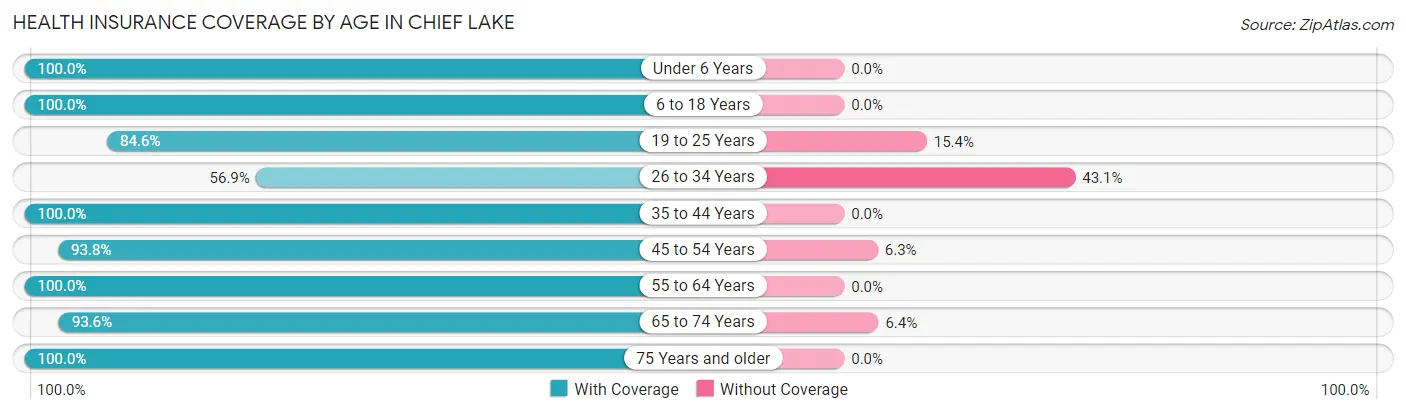
| Age Bracket | With Coverage | Without Coverage |
| Under 6 Years | 58 (100.0%) | 0 (0.0%) |
| 6 to 18 Years | 126 (100.0%) | 0 (0.0%) |
| 19 to 25 Years | 22 (84.6%) | 4 (15.4%) |
| 26 to 34 Years | 37 (56.9%) | 28 (43.1%) |
| 35 to 44 Years | 38 (100.0%) | 0 (0.0%) |
| 45 to 54 Years | 60 (93.8%) | 4 (6.2%) |
| 55 to 64 Years | 130 (100.0%) | 0 (0.0%) |
| 65 to 74 Years | 88 (93.6%) | 6 (6.4%) |
| 75 Years and older | 25 (100.0%) | 0 (0.0%) |
| Total | 584 (93.3%) | 42 (6.7%) |
Health Insurance Coverage by Citizenship Status in Chief Lake
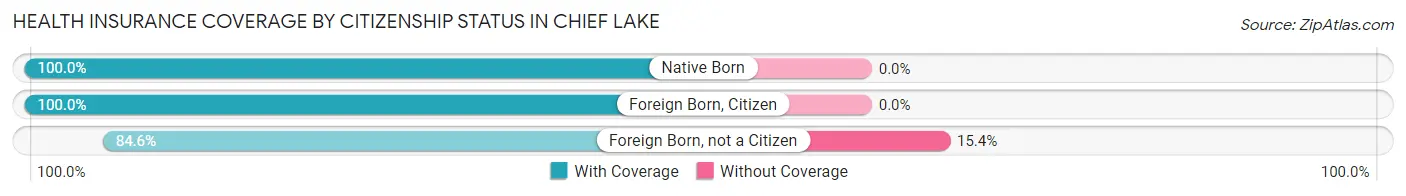
| Citizenship Status | With Coverage | Without Coverage |
| Native Born | 58 (100.0%) | 0 (0.0%) |
| Foreign Born, Citizen | 126 (100.0%) | 0 (0.0%) |
| Foreign Born, not a Citizen | 22 (84.6%) | 4 (15.4%) |
Health Insurance Coverage by Household Income in Chief Lake
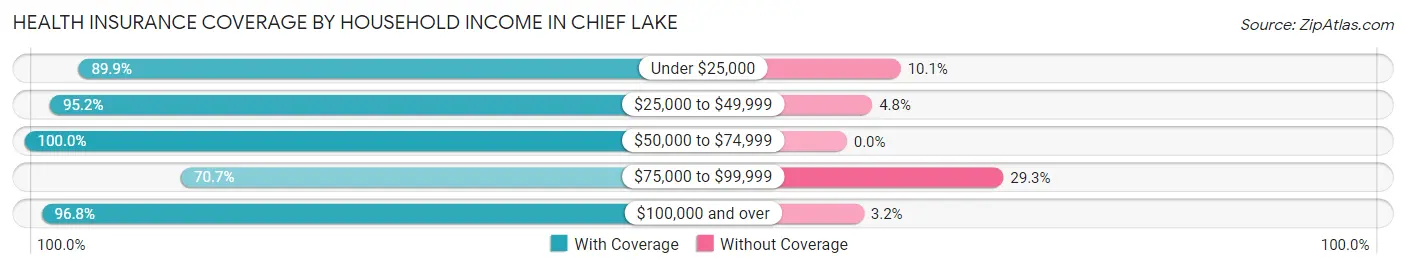
| Household Income | With Coverage | Without Coverage |
| Under $25,000 | 89 (89.9%) | 10 (10.1%) |
| $25,000 to $49,999 | 80 (95.2%) | 4 (4.8%) |
| $50,000 to $74,999 | 177 (100.0%) | 0 (0.0%) |
| $75,000 to $99,999 | 53 (70.7%) | 22 (29.3%) |
| $100,000 and over | 182 (96.8%) | 6 (3.2%) |
Public vs Private Health Insurance Coverage by Age in Chief Lake
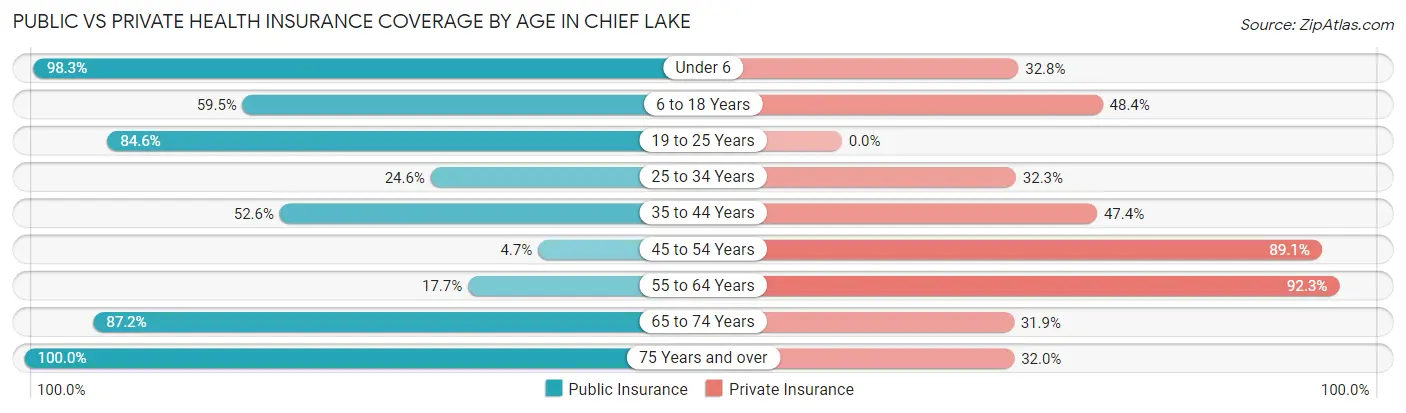
| Age Bracket | Public Insurance | Private Insurance |
| Under 6 | 57 (98.3%) | 19 (32.8%) |
| 6 to 18 Years | 75 (59.5%) | 61 (48.4%) |
| 19 to 25 Years | 22 (84.6%) | 0 (0.0%) |
| 25 to 34 Years | 16 (24.6%) | 21 (32.3%) |
| 35 to 44 Years | 20 (52.6%) | 18 (47.4%) |
| 45 to 54 Years | 3 (4.7%) | 57 (89.1%) |
| 55 to 64 Years | 23 (17.7%) | 120 (92.3%) |
| 65 to 74 Years | 82 (87.2%) | 30 (31.9%) |
| 75 Years and over | 25 (100.0%) | 8 (32.0%) |
| Total | 323 (51.6%) | 334 (53.3%) |
Disability Status by Sex by Age in Chief Lake
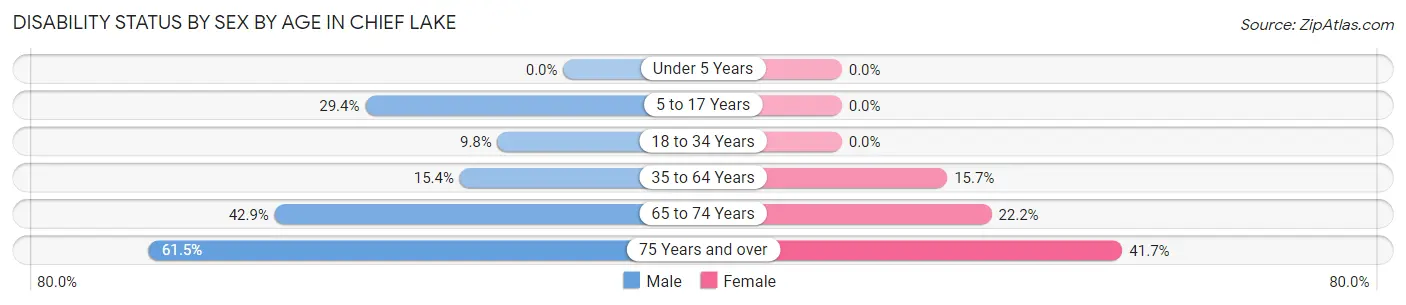
| Age Bracket | Male | Female |
| Under 5 Years | 0 (0.0%) | 0 (0.0%) |
| 5 to 17 Years | 15 (29.4%) | 0 (0.0%) |
| 18 to 34 Years | 4 (9.8%) | 0 (0.0%) |
| 35 to 64 Years | 18 (15.4%) | 18 (15.7%) |
| 65 to 74 Years | 21 (42.9%) | 10 (22.2%) |
| 75 Years and over | 8 (61.5%) | 5 (41.7%) |
Disability Class by Sex by Age in Chief Lake
Disability Class: Hearing Difficulty
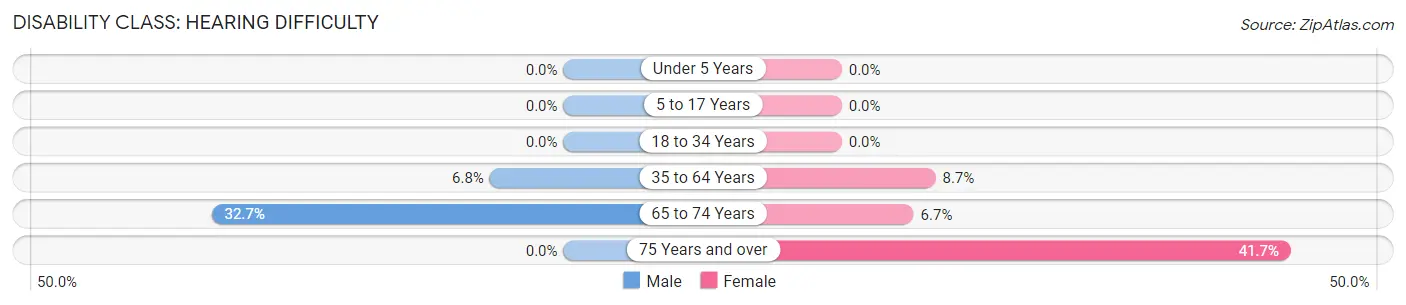
| Age Bracket | Male | Female |
| Under 5 Years | 0 (0.0%) | 0 (0.0%) |
| 5 to 17 Years | 0 (0.0%) | 0 (0.0%) |
| 18 to 34 Years | 0 (0.0%) | 0 (0.0%) |
| 35 to 64 Years | 8 (6.8%) | 10 (8.7%) |
| 65 to 74 Years | 16 (32.7%) | 3 (6.7%) |
| 75 Years and over | 0 (0.0%) | 5 (41.7%) |
Disability Class: Vision Difficulty
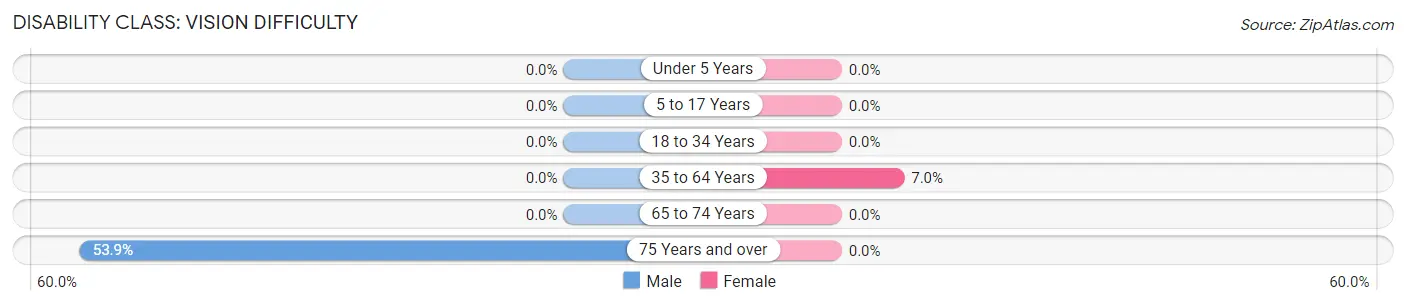
| Age Bracket | Male | Female |
| Under 5 Years | 0 (0.0%) | 0 (0.0%) |
| 5 to 17 Years | 0 (0.0%) | 0 (0.0%) |
| 18 to 34 Years | 0 (0.0%) | 0 (0.0%) |
| 35 to 64 Years | 0 (0.0%) | 8 (7.0%) |
| 65 to 74 Years | 0 (0.0%) | 0 (0.0%) |
| 75 Years and over | 7 (53.8%) | 0 (0.0%) |
Disability Class: Cognitive Difficulty
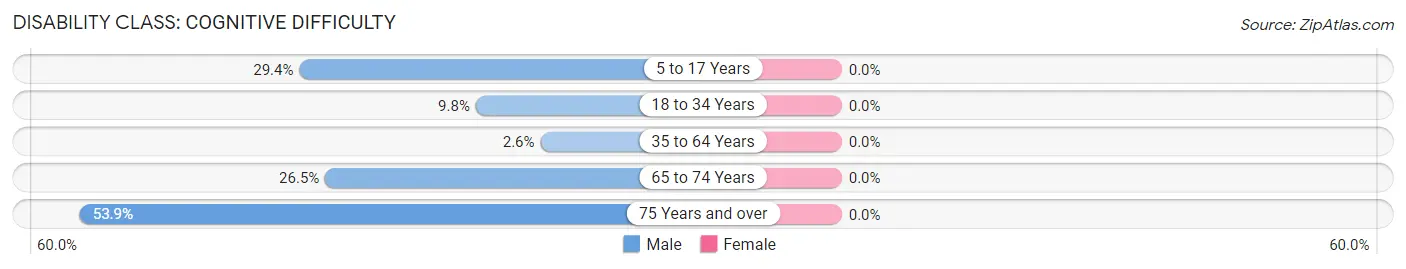
| Age Bracket | Male | Female |
| 5 to 17 Years | 15 (29.4%) | 0 (0.0%) |
| 18 to 34 Years | 4 (9.8%) | 0 (0.0%) |
| 35 to 64 Years | 3 (2.6%) | 0 (0.0%) |
| 65 to 74 Years | 13 (26.5%) | 0 (0.0%) |
| 75 Years and over | 7 (53.8%) | 0 (0.0%) |
Disability Class: Ambulatory Difficulty
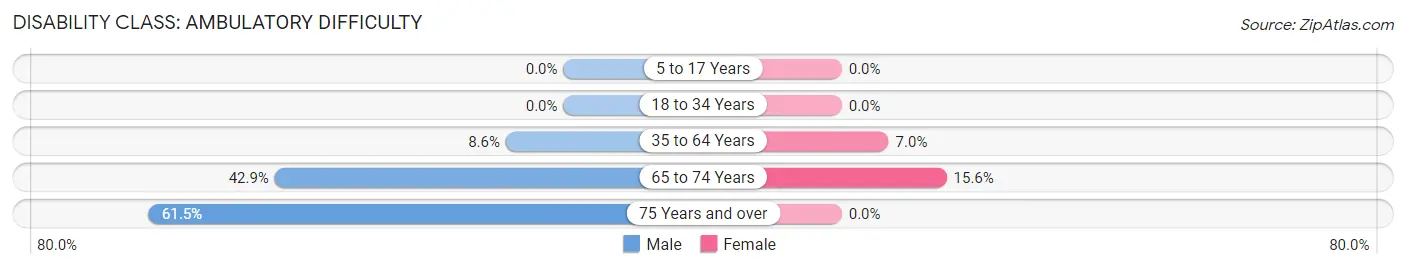
| Age Bracket | Male | Female |
| 5 to 17 Years | 0 (0.0%) | 0 (0.0%) |
| 18 to 34 Years | 0 (0.0%) | 0 (0.0%) |
| 35 to 64 Years | 10 (8.6%) | 8 (7.0%) |
| 65 to 74 Years | 21 (42.9%) | 7 (15.6%) |
| 75 Years and over | 8 (61.5%) | 0 (0.0%) |
Disability Class: Self-Care Difficulty
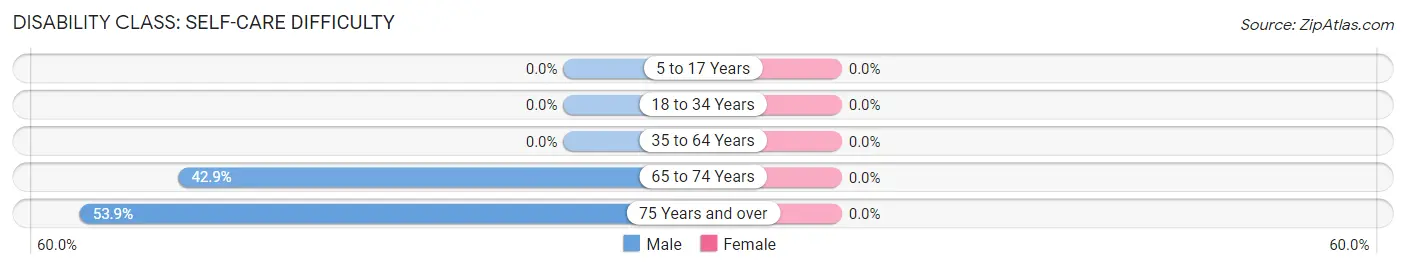
| Age Bracket | Male | Female |
| 5 to 17 Years | 0 (0.0%) | 0 (0.0%) |
| 18 to 34 Years | 0 (0.0%) | 0 (0.0%) |
| 35 to 64 Years | 0 (0.0%) | 0 (0.0%) |
| 65 to 74 Years | 21 (42.9%) | 0 (0.0%) |
| 75 Years and over | 7 (53.8%) | 0 (0.0%) |
Technology Access in Chief Lake
Computing Device Access in Chief Lake
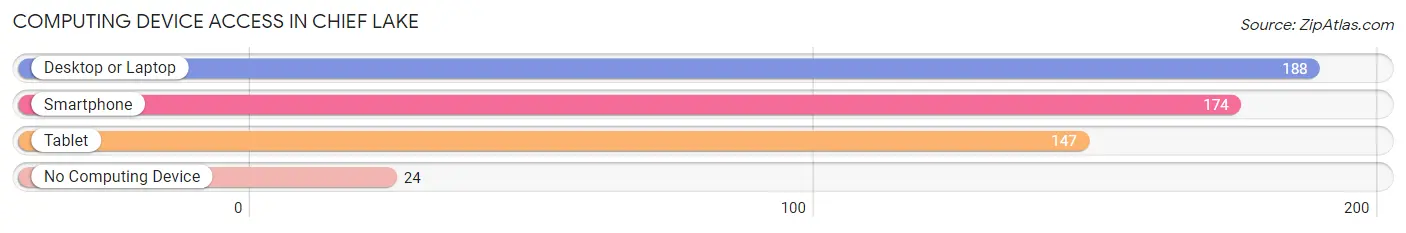
| Device Type | # Households | % Households |
| Desktop or Laptop | 188 | 74.6% |
| Smartphone | 174 | 69.1% |
| Tablet | 147 | 58.3% |
| No Computing Device | 24 | 9.5% |
| Total | 252 | 100.0% |
Internet Access in Chief Lake
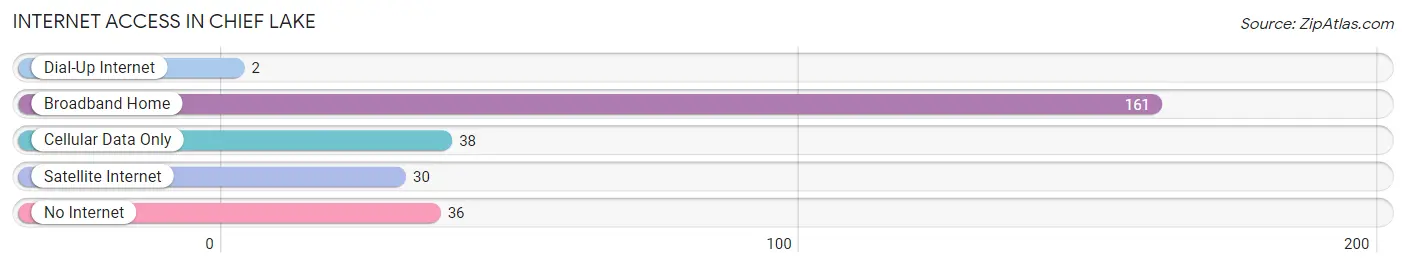
| Internet Type | # Households | % Households |
| Dial-Up Internet | 2 | 0.8% |
| Broadband Home | 161 | 63.9% |
| Cellular Data Only | 38 | 15.1% |
| Satellite Internet | 30 | 11.9% |
| No Internet | 36 | 14.3% |
| Total | 252 | 100.0% |
Chief Lake Summary
Lake Chief is a small town located in the state of Wisconsin, in the United States of America. It is situated in the county of Vilas, and is part of the Eagle River-Three Lakes census-designated place. The town has a population of approximately 1,000 people, and is located on the shores of Lake Chief, a large lake in the area.
History
The area around Lake Chief has been inhabited for thousands of years, with evidence of human activity dating back to the Paleo-Indian period. The first Europeans to settle in the area were French fur traders, who established trading posts in the area in the late 1700s. The area was later settled by German and Scandinavian immigrants, who established farms and logging operations in the area.
The town of Lake Chief was officially founded in 1887, when the first post office was established. The town was named after the lake, which was named after Chief Lake, a local Native American chief. The town grew slowly over the years, and by the early 1900s, it had become a popular tourist destination, with several resorts and lodges being established in the area.
Geography
Lake Chief is located in the northern part of Wisconsin, in Vilas County. It is situated on the shores of Lake Chief, a large lake in the area. The town is surrounded by forests and lakes, and is part of the Eagle River-Three Lakes census-designated place. The town is located approximately 30 miles north of the city of Eagle River, and is about 90 miles north of the state capital of Madison.
The town has a total area of 1.2 square miles, all of which is land. The town is located at an elevation of 1,072 feet above sea level. The climate in the area is classified as humid continental, with cold winters and warm summers.
Economy
The economy of Lake Chief is largely based on tourism and recreation. The town is a popular destination for fishing, boating, and other outdoor activities. There are several resorts and lodges in the area, as well as several restaurants and shops. The town is also home to several small businesses, including a grocery store, a hardware store, and a gas station.
Demographics
As of the 2010 census, the population of Lake Chief was 1,000 people. The racial makeup of the town was 97.2% White, 0.7% Native American, 0.3% Asian, 0.2% from other races, and 1.6% from two or more races. The median household income in the town was $41,250, and the median family income was $50,000. The per capita income in the town was $20,000.
Conclusion
Lake Chief is a small town located in the state of Wisconsin, in the United States of America. It is situated in the county of Vilas, and is part of the Eagle River-Three Lakes census-designated place. The town has a population of approximately 1,000 people, and is located on the shores of Lake Chief, a large lake in the area. The economy of Lake Chief is largely based on tourism and recreation, and the town is a popular destination for fishing, boating, and other outdoor activities. The racial makeup of the town is predominantly White, with a small percentage of Native American, Asian, and other races. The median household income in the town is $41,250, and the per capita income is $20,000.
Common Questions
What is Per Capita Income in Chief Lake?
Per Capita income in Chief Lake is $45,055.
What is the Median Family Income in Chief Lake?
Median Family Income in Chief Lake is $71,615.
What is the Median Household income in Chief Lake?
Median Household Income in Chief Lake is $65,962.
What is Income or Wage Gap in Chief Lake?
Income or Wage Gap in Chief Lake is 31.4%.
Women in Chief Lake earn 68.6 cents for every dollar earned by a man.
What is Inequality or Gini Index in Chief Lake?
Inequality or Gini Index in Chief Lake is 0.61.
What is the Total Population of Chief Lake?
Total Population of Chief Lake is 626.
What is the Total Male Population of Chief Lake?
Total Male Population of Chief Lake is 309.
What is the Total Female Population of Chief Lake?
Total Female Population of Chief Lake is 317.
What is the Ratio of Males per 100 Females in Chief Lake?
There are 97.48 Males per 100 Females in Chief Lake.
What is the Ratio of Females per 100 Males in Chief Lake?
There are 102.59 Females per 100 Males in Chief Lake.
What is the Median Population Age in Chief Lake?
Median Population Age in Chief Lake is 45.0 Years.
What is the Average Family Size in Chief Lake
Average Family Size in Chief Lake is 2.8 People.
What is the Average Household Size in Chief Lake
Average Household Size in Chief Lake is 2.5 People.
How Large is the Labor Force in Chief Lake?
There are 295 People in the Labor Forcein in Chief Lake.
What is the Percentage of People in the Labor Force in Chief Lake?
59.6% of People are in the Labor Force in Chief Lake.
What is the Unemployment Rate in Chief Lake?
Unemployment Rate in Chief Lake is 6.4%.