Pence, WI Map & Demographics
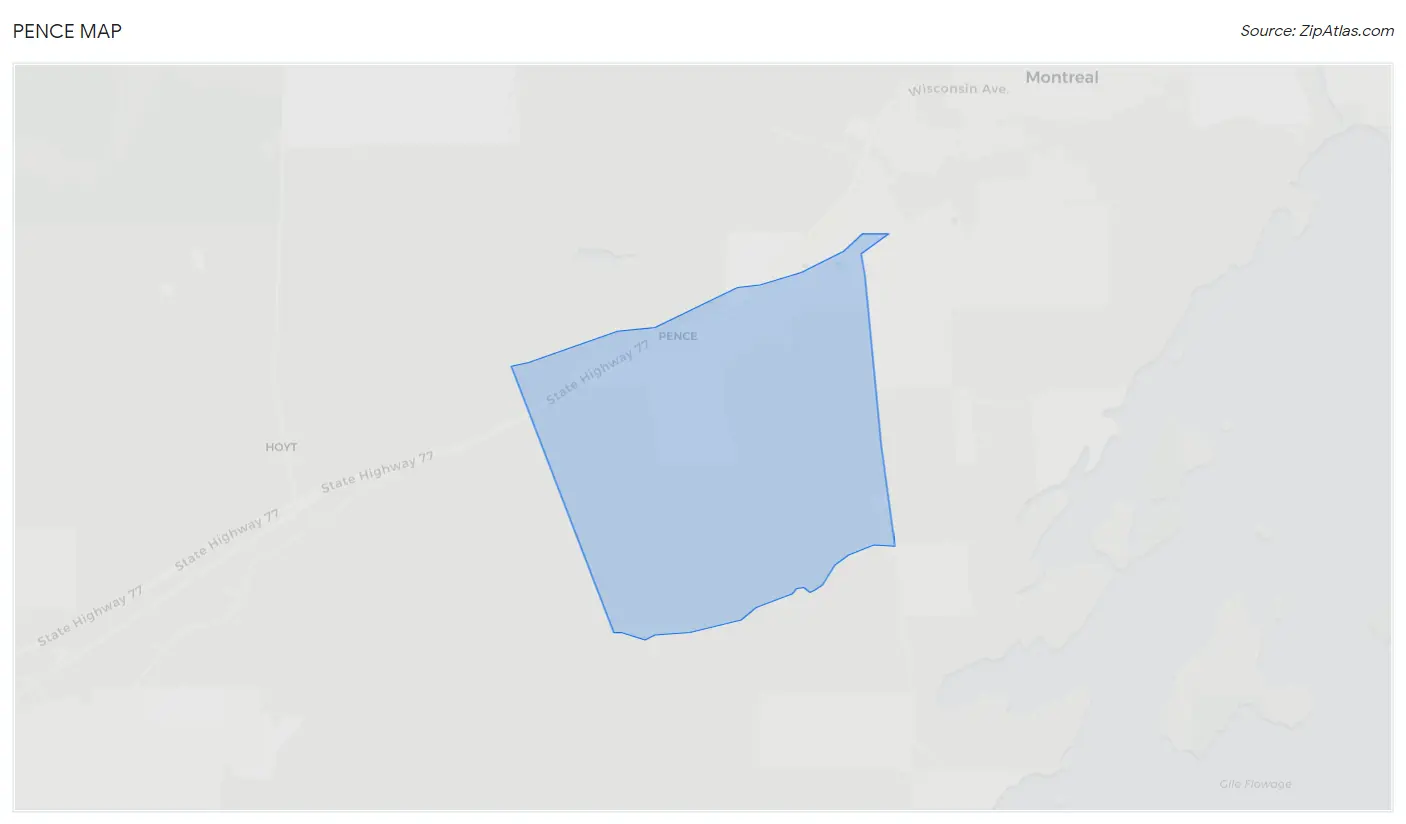
Pence Map
Pence Overview
$28,876
PER CAPITA INCOME
$84,167
AVG FAMILY INCOME
$43,000
AVG HOUSEHOLD INCOME
0.42
INEQUALITY / GINI INDEX
121
TOTAL POPULATION
58
MALE POPULATION
63
FEMALE POPULATION
92.06
MALES / 100 FEMALES
108.62
FEMALES / 100 MALES
58.3
MEDIAN AGE
3.0
AVG FAMILY SIZE
2.0
AVG HOUSEHOLD SIZE
35
LABOR FORCE [ PEOPLE ]
34.7%
PERCENT IN LABOR FORCE
5.7%
UNEMPLOYMENT RATE
Pence Area Codes
Income in Pence
Income Overview in Pence
Per Capita Income in Pence is $28,876, while median incomes of families and households are $84,167 and $43,000 respectively.
| Characteristic | Number | Measure |
| Per Capita Income | 121 | $28,876 |
| Median Family Income | 28 | $84,167 |
| Mean Family Income | 28 | $88,654 |
| Median Household Income | 60 | $43,000 |
| Mean Household Income | 60 | $57,243 |
| Income Deficit | 28 | $0 |
| Wage / Income Gap (%) | 121 | 0.00% |
| Wage / Income Gap ($) | 121 | 100.00¢ per $1 |
| Gini / Inequality Index | 121 | 0.42 |
Earnings by Sex in Pence
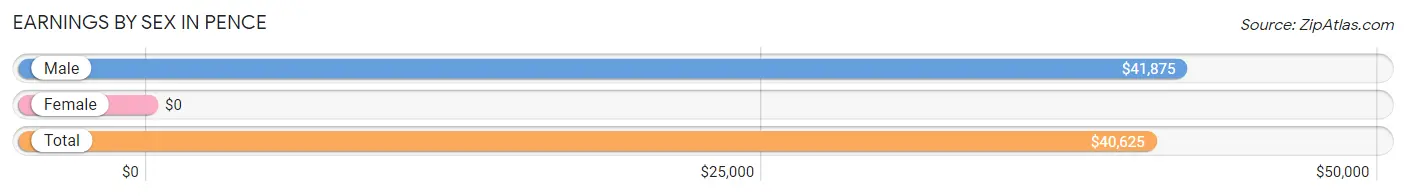
| Sex | Number | Average Earnings |
| Male | 25 (53.2%) | $41,875 |
| Female | 22 (46.8%) | $0 |
| Total | 47 (100.0%) | $40,625 |
Earnings by Sex by Income Bracket in Pence
The most common earnings brackets in Pence are $2,499 or less for men (8 | 32.0%) and $20,000 to $22,499 for women (6 | 27.3%).
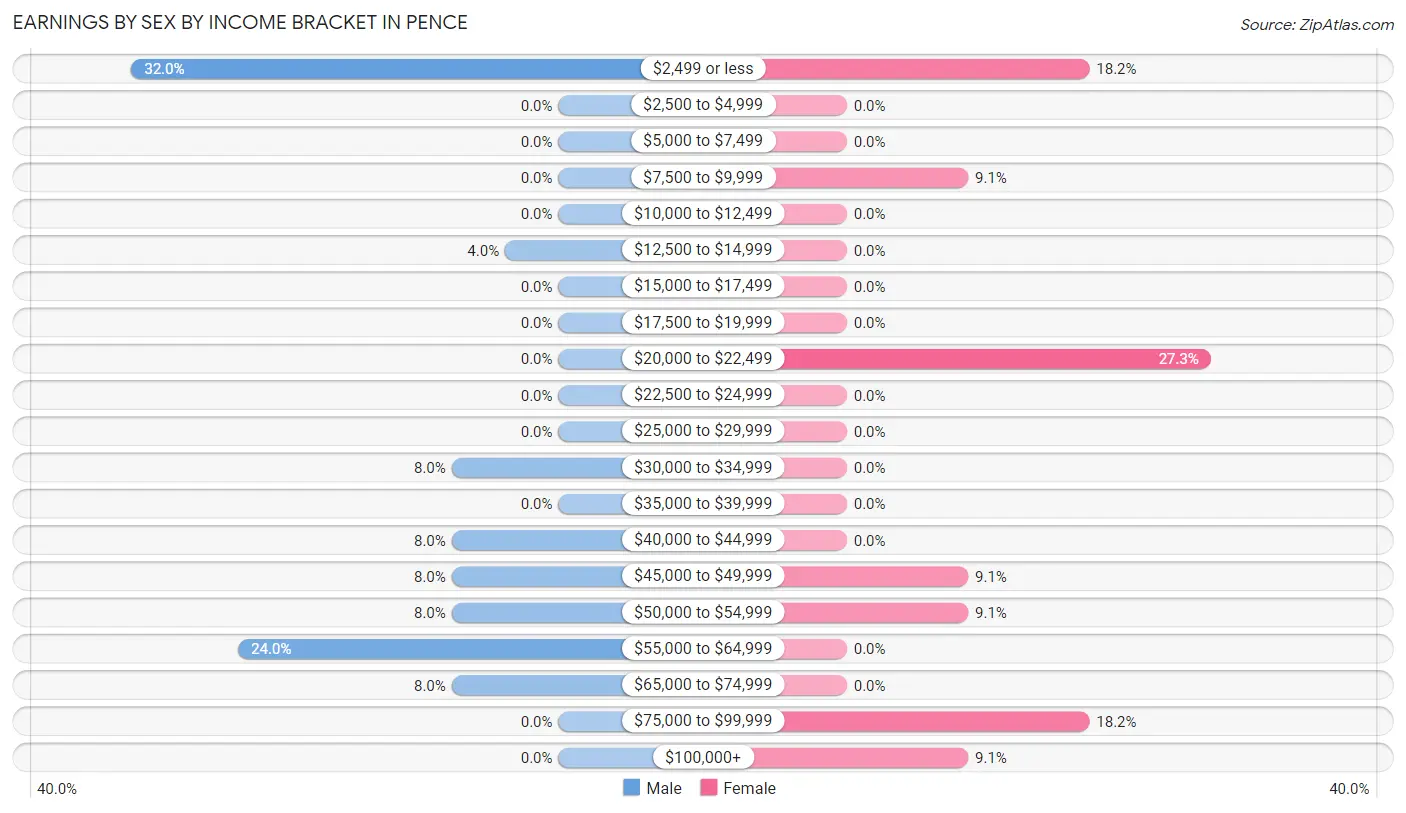
| Income | Male | Female |
| $2,499 or less | 8 (32.0%) | 4 (18.2%) |
| $2,500 to $4,999 | 0 (0.0%) | 0 (0.0%) |
| $5,000 to $7,499 | 0 (0.0%) | 0 (0.0%) |
| $7,500 to $9,999 | 0 (0.0%) | 2 (9.1%) |
| $10,000 to $12,499 | 0 (0.0%) | 0 (0.0%) |
| $12,500 to $14,999 | 1 (4.0%) | 0 (0.0%) |
| $15,000 to $17,499 | 0 (0.0%) | 0 (0.0%) |
| $17,500 to $19,999 | 0 (0.0%) | 0 (0.0%) |
| $20,000 to $22,499 | 0 (0.0%) | 6 (27.3%) |
| $22,500 to $24,999 | 0 (0.0%) | 0 (0.0%) |
| $25,000 to $29,999 | 0 (0.0%) | 0 (0.0%) |
| $30,000 to $34,999 | 2 (8.0%) | 0 (0.0%) |
| $35,000 to $39,999 | 0 (0.0%) | 0 (0.0%) |
| $40,000 to $44,999 | 2 (8.0%) | 0 (0.0%) |
| $45,000 to $49,999 | 2 (8.0%) | 2 (9.1%) |
| $50,000 to $54,999 | 2 (8.0%) | 2 (9.1%) |
| $55,000 to $64,999 | 6 (24.0%) | 0 (0.0%) |
| $65,000 to $74,999 | 2 (8.0%) | 0 (0.0%) |
| $75,000 to $99,999 | 0 (0.0%) | 4 (18.2%) |
| $100,000+ | 0 (0.0%) | 2 (9.1%) |
| Total | 25 (100.0%) | 22 (100.0%) |
Earnings by Sex by Educational Attainment in Pence
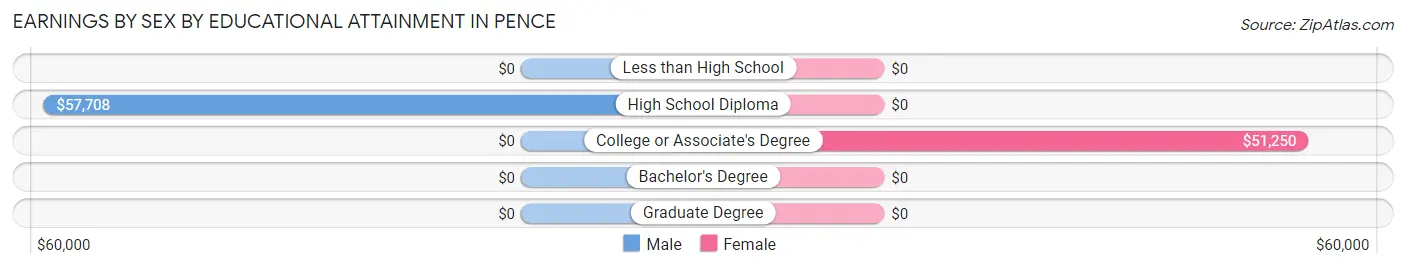
| Educational Attainment | Male Income | Female Income |
| Less than High School | - | - |
| High School Diploma | $57,708 | $0 |
| College or Associate's Degree | - | - |
| Bachelor's Degree | - | - |
| Graduate Degree | - | - |
| Total | $48,125 | $0 |
Family Income in Pence
Family Income Brackets in Pence
According to the Pence family income data, there are 12 families falling into the $75,000 to $99,999 income range, which is the most common income bracket and makes up 42.9% of all families.
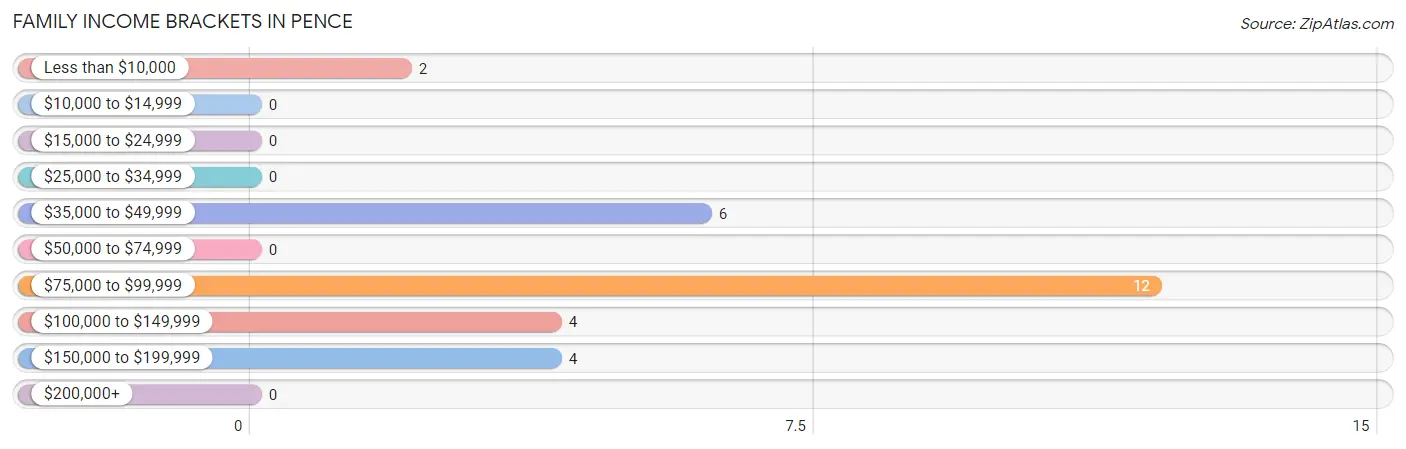
| Income Bracket | # Families | % Families |
| Less than $10,000 | 2 | 7.1% |
| $10,000 to $14,999 | 0 | 0.0% |
| $15,000 to $24,999 | 0 | 0.0% |
| $25,000 to $34,999 | 0 | 0.0% |
| $35,000 to $49,999 | 6 | 21.4% |
| $50,000 to $74,999 | 0 | 0.0% |
| $75,000 to $99,999 | 12 | 42.9% |
| $100,000 to $149,999 | 4 | 14.3% |
| $150,000 to $199,999 | 4 | 14.3% |
| $200,000+ | 0 | 0.0% |
Family Income by Famaliy Size in Pence
3-person families (16 | 57.1%) account for the highest median family income in Pence with $87,500 per family, while 2-person families (10 | 35.7%) have the highest median income of $38,125 per family member.
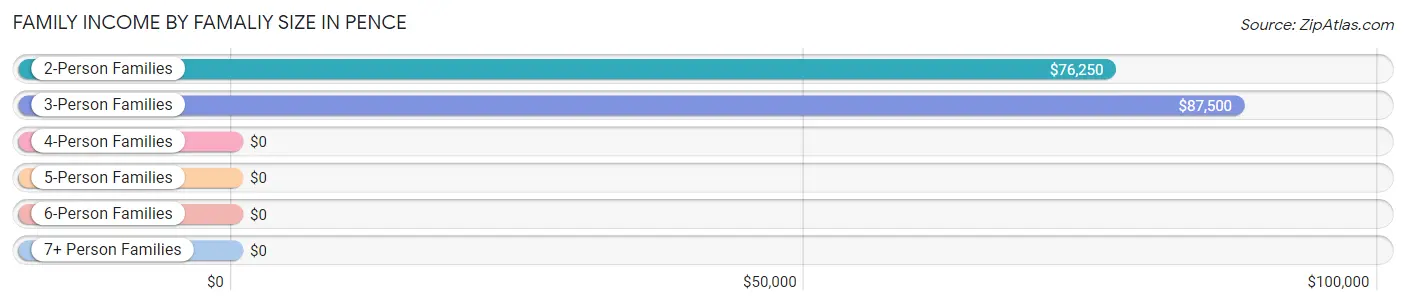
| Income Bracket | # Families | Median Income |
| 2-Person Families | 10 (35.7%) | $76,250 |
| 3-Person Families | 16 (57.1%) | $87,500 |
| 4-Person Families | 2 (7.1%) | $0 |
| 5-Person Families | 0 (0.0%) | $0 |
| 6-Person Families | 0 (0.0%) | $0 |
| 7+ Person Families | 0 (0.0%) | $0 |
| Total | 28 (100.0%) | $84,167 |
Family Income by Number of Earners in Pence
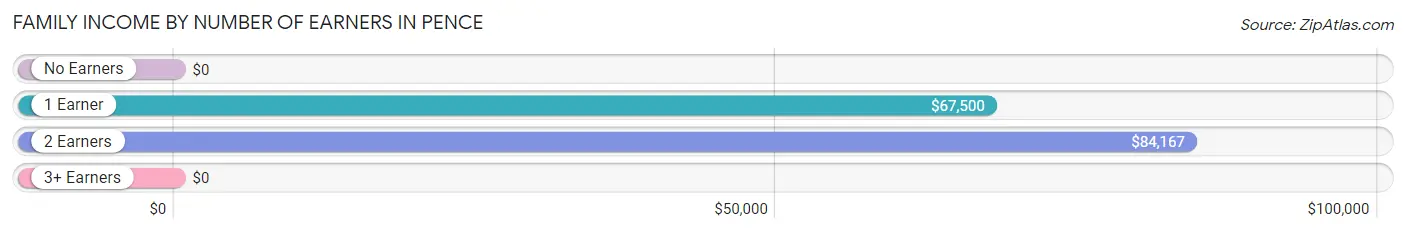
| Number of Earners | # Families | Median Income |
| No Earners | 8 (28.6%) | $0 |
| 1 Earner | 8 (28.6%) | $67,500 |
| 2 Earners | 12 (42.9%) | $84,167 |
| 3+ Earners | 0 (0.0%) | $0 |
| Total | 28 (100.0%) | $84,167 |
Household Income in Pence
Household Income Brackets in Pence
With 14 households falling in the category, the $75,000 to $99,999 income range is the most frequent in Pence, accounting for 23.3% of all households.
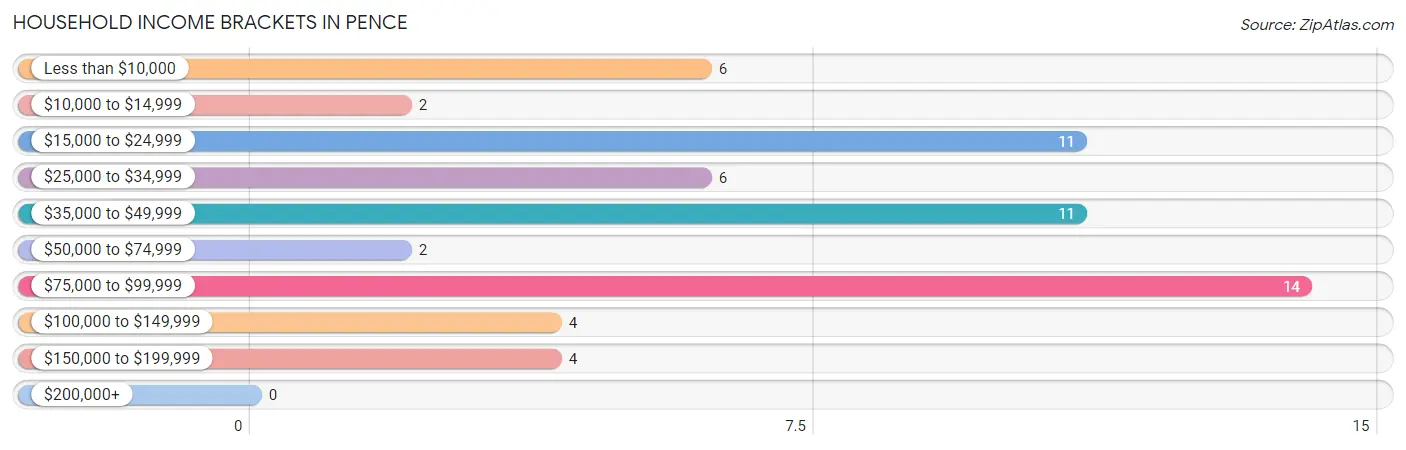
| Income Bracket | # Households | % Households |
| Less than $10,000 | 6 | 10.0% |
| $10,000 to $14,999 | 2 | 3.3% |
| $15,000 to $24,999 | 11 | 18.3% |
| $25,000 to $34,999 | 6 | 10.0% |
| $35,000 to $49,999 | 11 | 18.3% |
| $50,000 to $74,999 | 2 | 3.3% |
| $75,000 to $99,999 | 14 | 23.3% |
| $100,000 to $149,999 | 4 | 6.7% |
| $150,000 to $199,999 | 4 | 6.7% |
| $200,000+ | 0 | 0.0% |
Household Income by Householder Age in Pence
The median household income in Pence is $43,000, with the highest median household income of $76,250 found in the 45 to 64 years age bracket for the primary householder. A total of 26 households (43.3%) fall into this category.
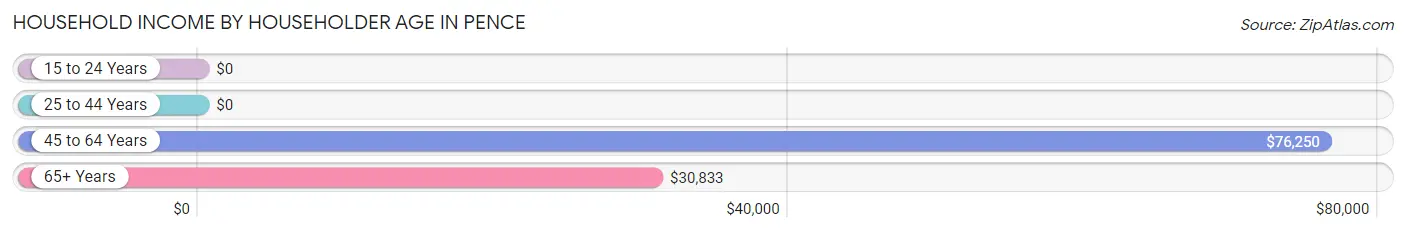
| Income Bracket | # Households | Median Income |
| 15 to 24 Years | 0 (0.0%) | $0 |
| 25 to 44 Years | 4 (6.7%) | $0 |
| 45 to 64 Years | 26 (43.3%) | $76,250 |
| 65+ Years | 30 (50.0%) | $30,833 |
| Total | 60 (100.0%) | $43,000 |
Poverty in Pence
Income Below Poverty by Sex and Age in Pence
With 13.8% poverty level for males and 9.5% for females among the residents of Pence, 16 and 17 year old males and 35 to 44 year old females are the most vulnerable to poverty, with 3 males (60.0%) and 2 females (33.3%) in their respective age groups living below the poverty level.
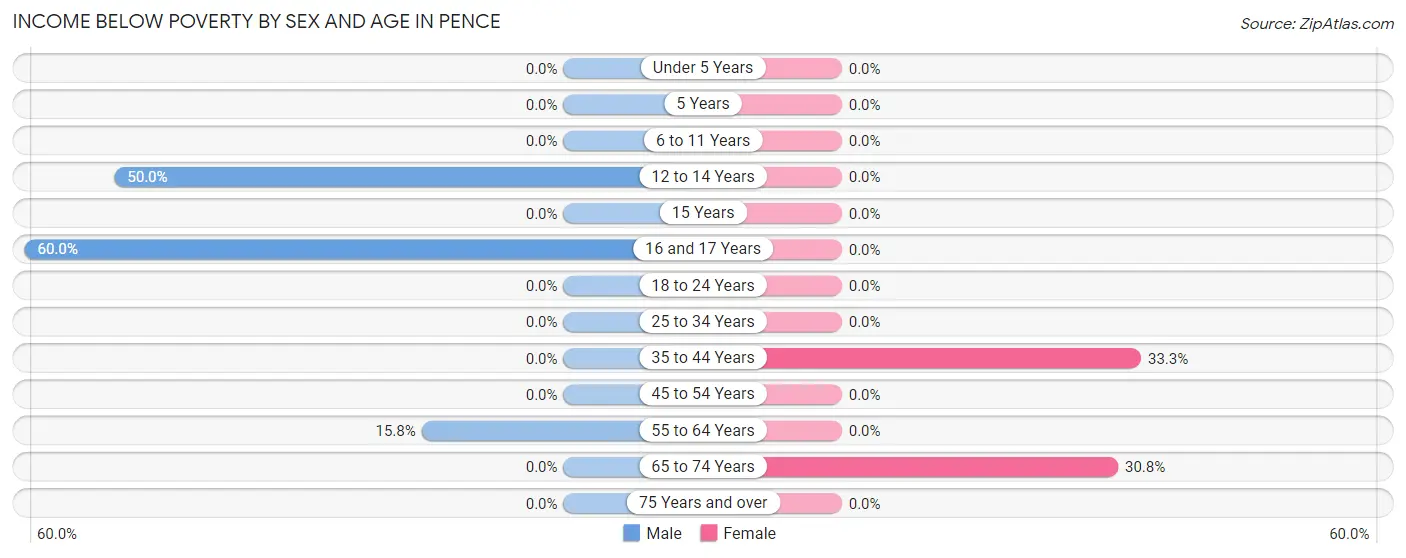
| Age Bracket | Male | Female |
| Under 5 Years | 0 (0.0%) | 0 (0.0%) |
| 5 Years | 0 (0.0%) | 0 (0.0%) |
| 6 to 11 Years | 0 (0.0%) | 0 (0.0%) |
| 12 to 14 Years | 2 (50.0%) | 0 (0.0%) |
| 15 Years | 0 (0.0%) | 0 (0.0%) |
| 16 and 17 Years | 3 (60.0%) | 0 (0.0%) |
| 18 to 24 Years | 0 (0.0%) | 0 (0.0%) |
| 25 to 34 Years | 0 (0.0%) | 0 (0.0%) |
| 35 to 44 Years | 0 (0.0%) | 2 (33.3%) |
| 45 to 54 Years | 0 (0.0%) | 0 (0.0%) |
| 55 to 64 Years | 3 (15.8%) | 0 (0.0%) |
| 65 to 74 Years | 0 (0.0%) | 4 (30.8%) |
| 75 Years and over | 0 (0.0%) | 0 (0.0%) |
| Total | 8 (13.8%) | 6 (9.5%) |
Income Above Poverty by Sex and Age in Pence
According to the poverty statistics in Pence, males aged under 5 years and females aged 12 to 14 years are the age groups that are most secure financially, with 100.0% of males and 100.0% of females in these age groups living above the poverty line.
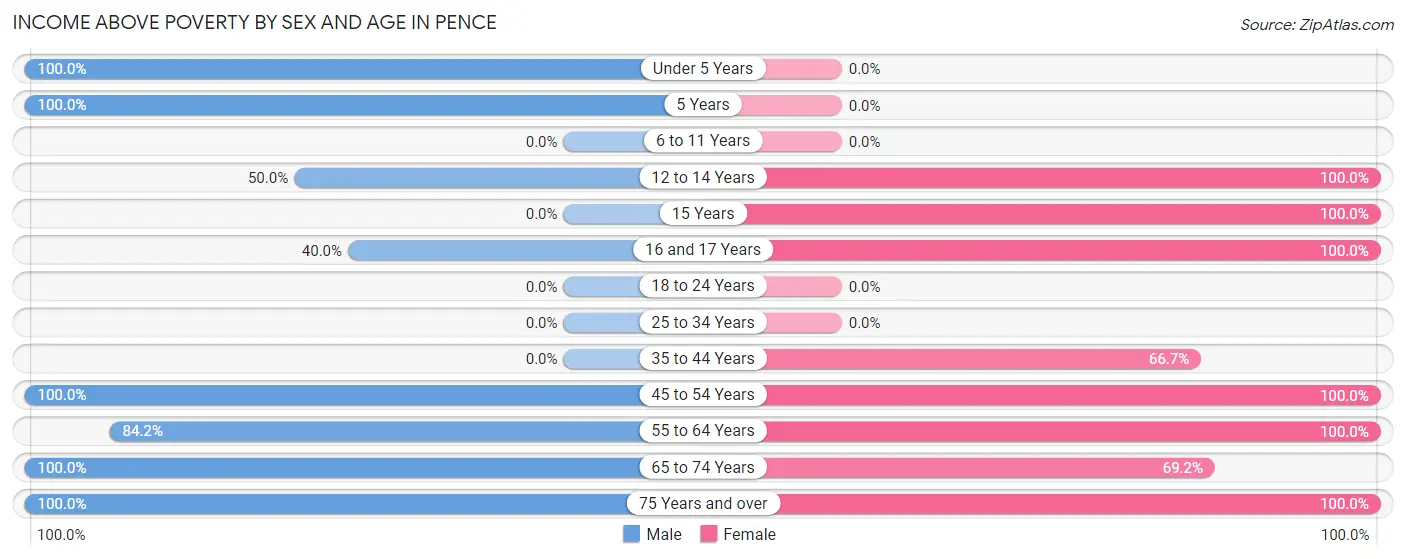
| Age Bracket | Male | Female |
| Under 5 Years | 4 (100.0%) | 0 (0.0%) |
| 5 Years | 2 (100.0%) | 0 (0.0%) |
| 6 to 11 Years | 0 (0.0%) | 0 (0.0%) |
| 12 to 14 Years | 2 (50.0%) | 1 (100.0%) |
| 15 Years | 0 (0.0%) | 9 (100.0%) |
| 16 and 17 Years | 2 (40.0%) | 4 (100.0%) |
| 18 to 24 Years | 0 (0.0%) | 0 (0.0%) |
| 25 to 34 Years | 0 (0.0%) | 0 (0.0%) |
| 35 to 44 Years | 0 (0.0%) | 4 (66.7%) |
| 45 to 54 Years | 6 (100.0%) | 12 (100.0%) |
| 55 to 64 Years | 16 (84.2%) | 2 (100.0%) |
| 65 to 74 Years | 3 (100.0%) | 9 (69.2%) |
| 75 Years and over | 15 (100.0%) | 16 (100.0%) |
| Total | 50 (86.2%) | 57 (90.5%) |
Income Below Poverty Among Married-Couple Families in Pence
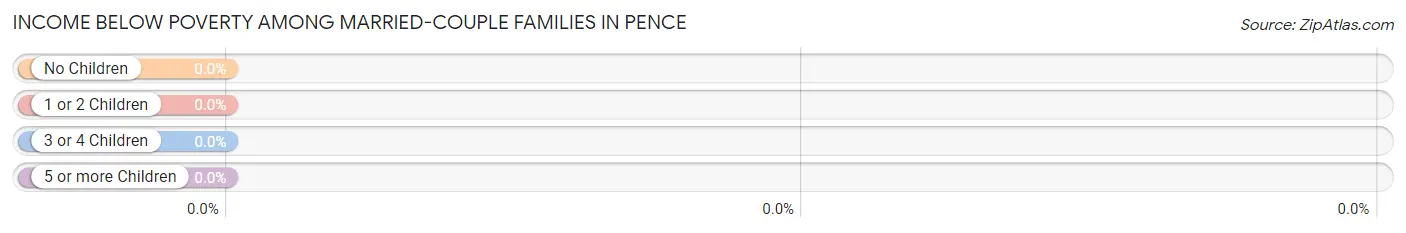
| Children | Above Poverty | Below Poverty |
| No Children | 12 (100.0%) | 0 (0.0%) |
| 1 or 2 Children | 10 (100.0%) | 0 (0.0%) |
| 3 or 4 Children | 0 (0.0%) | 0 (0.0%) |
| 5 or more Children | 0 (0.0%) | 0 (0.0%) |
| Total | 22 (100.0%) | 0 (0.0%) |
Income Below Poverty Among Single-Parent Households in Pence
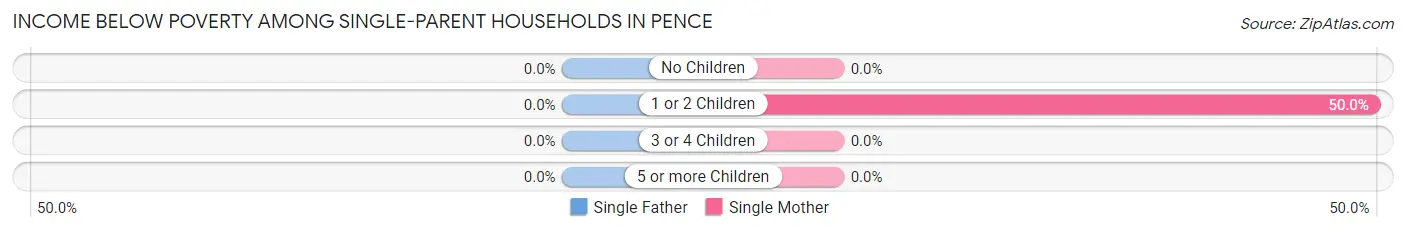
| Children | Single Father | Single Mother |
| No Children | 0 (0.0%) | 0 (0.0%) |
| 1 or 2 Children | 0 (0.0%) | 2 (50.0%) |
| 3 or 4 Children | 0 (0.0%) | 0 (0.0%) |
| 5 or more Children | 0 (0.0%) | 0 (0.0%) |
| Total | 0 (0.0%) | 2 (50.0%) |
Income Below Poverty Among Married-Couple vs Single-Parent Households in Pence
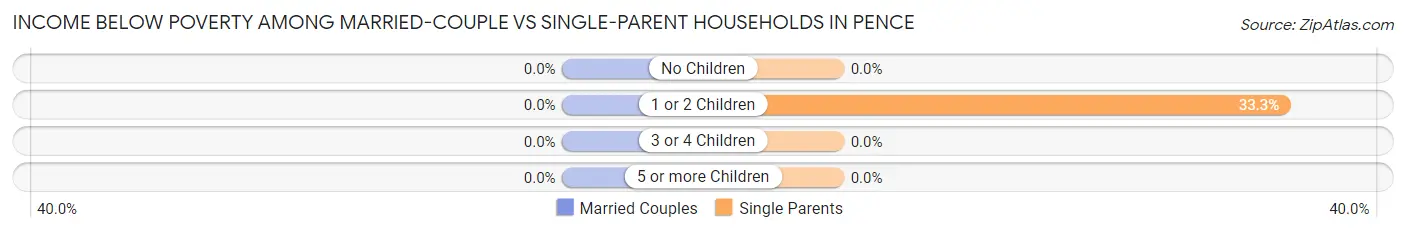
| Children | Married-Couple Families | Single-Parent Households |
| No Children | 0 (0.0%) | 0 (0.0%) |
| 1 or 2 Children | 0 (0.0%) | 2 (33.3%) |
| 3 or 4 Children | 0 (0.0%) | 0 (0.0%) |
| 5 or more Children | 0 (0.0%) | 0 (0.0%) |
| Total | 0 (0.0%) | 2 (33.3%) |
Race in Pence
The most populous races in Pence are White / Caucasian (117 | 96.7%), and Two or more Races (4 | 3.3%).
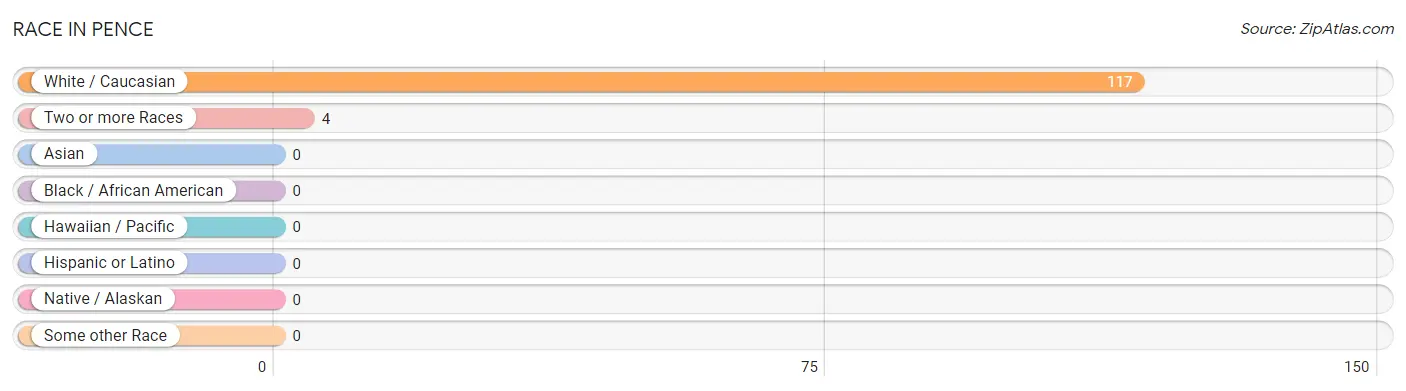
| Race | # Population | % Population |
| Asian | 0 | 0.0% |
| Black / African American | 0 | 0.0% |
| Hawaiian / Pacific | 0 | 0.0% |
| Hispanic or Latino | 0 | 0.0% |
| Native / Alaskan | 0 | 0.0% |
| White / Caucasian | 117 | 96.7% |
| Two or more Races | 4 | 3.3% |
| Some other Race | 0 | 0.0% |
| Total | 121 | 100.0% |
Ancestry in Pence
The most populous ancestries reported in Pence are Finnish (40 | 33.1%), Italian (33 | 27.3%), German (22 | 18.2%), Swedish (19 | 15.7%), and Polish (17 | 14.1%), together accounting for 108.3% of all Pence residents.
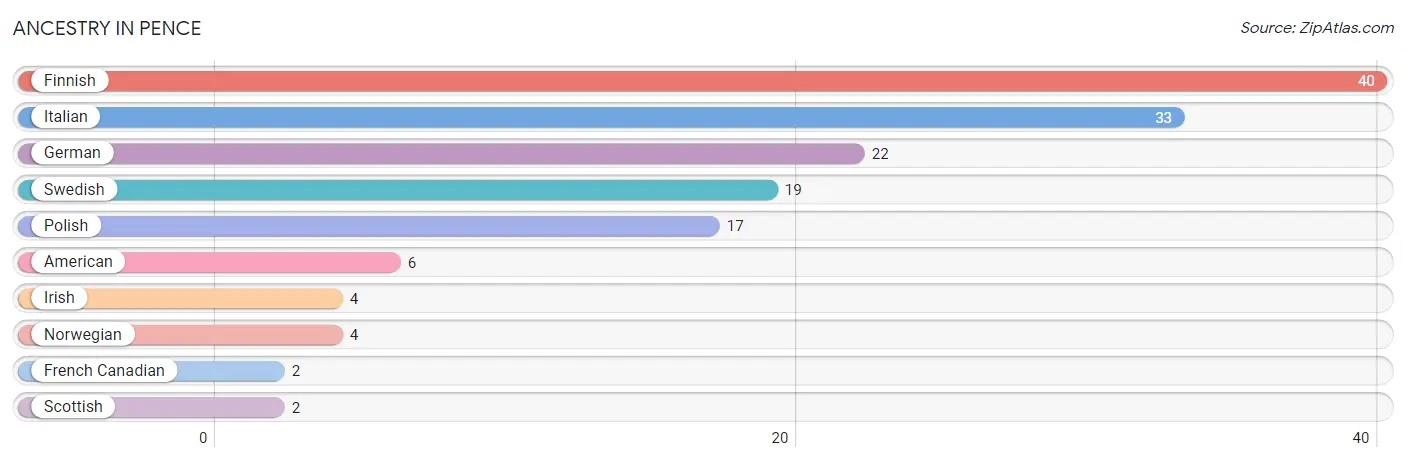
| Ancestry | # Population | % Population |
| American | 6 | 5.0% |
| Finnish | 40 | 33.1% |
| French Canadian | 2 | 1.7% |
| German | 22 | 18.2% |
| Irish | 4 | 3.3% |
| Italian | 33 | 27.3% |
| Norwegian | 4 | 3.3% |
| Polish | 17 | 14.1% |
| Scottish | 2 | 1.7% |
| Swedish | 19 | 15.7% | View All 10 Rows |
Immigrants in Pence

| Immigration Origin | # Population | % Population | View All 0 Rows |
Sex and Age in Pence
Sex and Age in Pence
The most populous age groups in Pence are 55 to 59 Years (13 | 22.4%) for men and 15 to 19 Years (13 | 20.6%) for women.
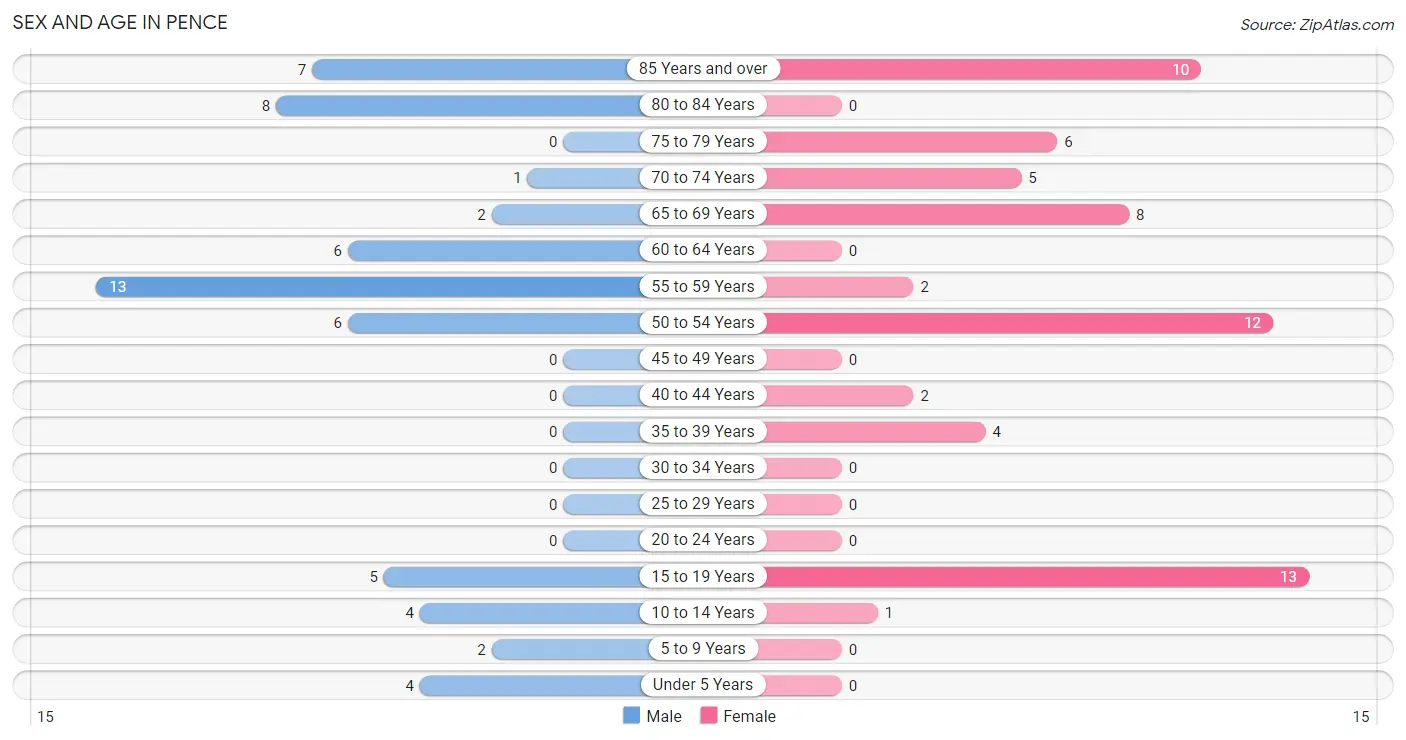
| Age Bracket | Male | Female |
| Under 5 Years | 4 (6.9%) | 0 (0.0%) |
| 5 to 9 Years | 2 (3.5%) | 0 (0.0%) |
| 10 to 14 Years | 4 (6.9%) | 1 (1.6%) |
| 15 to 19 Years | 5 (8.6%) | 13 (20.6%) |
| 20 to 24 Years | 0 (0.0%) | 0 (0.0%) |
| 25 to 29 Years | 0 (0.0%) | 0 (0.0%) |
| 30 to 34 Years | 0 (0.0%) | 0 (0.0%) |
| 35 to 39 Years | 0 (0.0%) | 4 (6.4%) |
| 40 to 44 Years | 0 (0.0%) | 2 (3.2%) |
| 45 to 49 Years | 0 (0.0%) | 0 (0.0%) |
| 50 to 54 Years | 6 (10.3%) | 12 (19.1%) |
| 55 to 59 Years | 13 (22.4%) | 2 (3.2%) |
| 60 to 64 Years | 6 (10.3%) | 0 (0.0%) |
| 65 to 69 Years | 2 (3.5%) | 8 (12.7%) |
| 70 to 74 Years | 1 (1.7%) | 5 (7.9%) |
| 75 to 79 Years | 0 (0.0%) | 6 (9.5%) |
| 80 to 84 Years | 8 (13.8%) | 0 (0.0%) |
| 85 Years and over | 7 (12.1%) | 10 (15.9%) |
| Total | 58 (100.0%) | 63 (100.0%) |
Families and Households in Pence
Median Family Size in Pence
The median family size in Pence is 3.00 persons per family, with single female/mother families (4 | 14.3%) accounting for the largest median family size of 3.25 persons per family. On the other hand, married-couple families (22 | 78.6%) represent the smallest median family size with 2.95 persons per family.
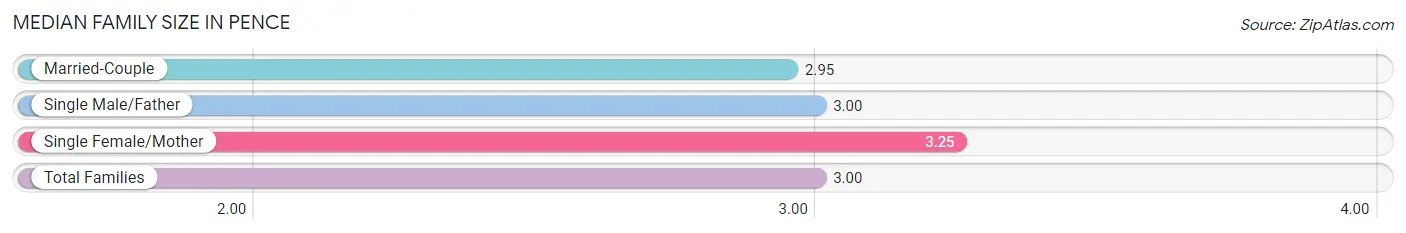
| Family Type | # Families | Family Size |
| Married-Couple | 22 (78.6%) | 2.95 |
| Single Male/Father | 2 (7.1%) | 3.00 |
| Single Female/Mother | 4 (14.3%) | 3.25 |
| Total Families | 28 (100.0%) | 3.00 |
Median Household Size in Pence
The median household size in Pence is 2.02 persons per household, with single female/mother households (4 | 6.7%) accounting for the largest median household size of 3.25 persons per household. non-family households (32 | 53.3%) represent the smallest median household size with 1.16 persons per household.
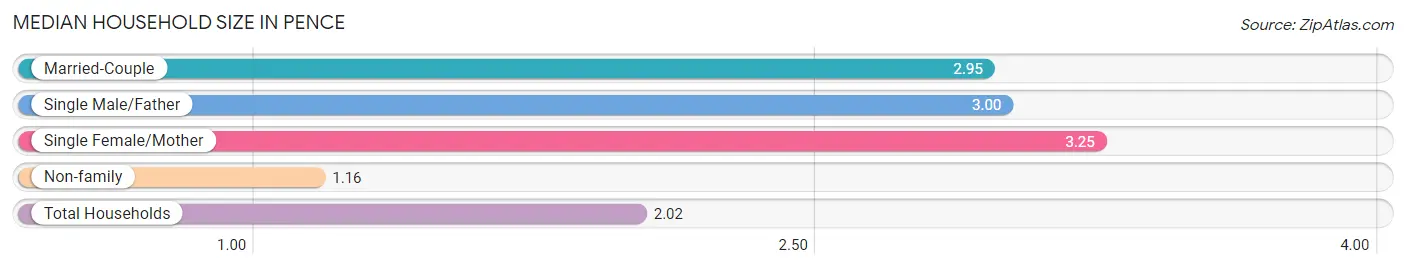
| Household Type | # Households | Household Size |
| Married-Couple | 22 (36.7%) | 2.95 |
| Single Male/Father | 2 (3.3%) | 3.00 |
| Single Female/Mother | 4 (6.7%) | 3.25 |
| Non-family | 32 (53.3%) | 1.16 |
| Total Households | 60 (100.0%) | 2.02 |
Household Size by Marriage Status in Pence
Out of a total of 60 households in Pence, 28 (46.7%) are family households, while 32 (53.3%) are nonfamily households. The most numerous type of family households are 3-person households, comprising 16, and the most common type of nonfamily households are 1-person households, comprising 24.
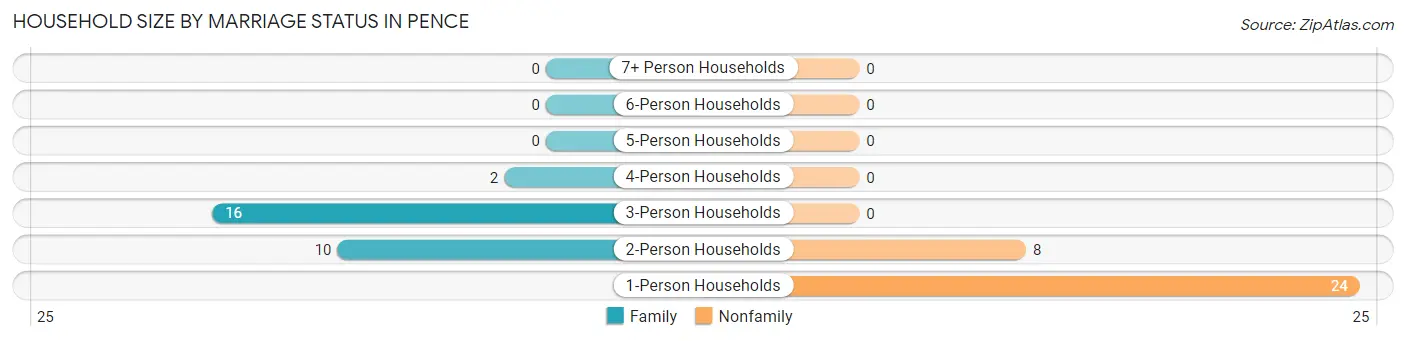
| Household Size | Family Households | Nonfamily Households |
| 1-Person Households | - | 24 (40.0%) |
| 2-Person Households | 10 (16.7%) | 8 (13.3%) |
| 3-Person Households | 16 (26.7%) | 0 (0.0%) |
| 4-Person Households | 2 (3.3%) | 0 (0.0%) |
| 5-Person Households | 0 (0.0%) | 0 (0.0%) |
| 6-Person Households | 0 (0.0%) | 0 (0.0%) |
| 7+ Person Households | 0 (0.0%) | 0 (0.0%) |
| Total | 28 (46.7%) | 32 (53.3%) |
Female Fertility in Pence
Fertility by Age in Pence
| Age Bracket | Women with Births | Births / 1,000 Women |
| 15 to 19 years | 0 (0.0%) | 0.0 |
| 20 to 34 years | 0 (0.0%) | 0.0 |
| 35 to 50 years | 0 (0.0%) | 0.0 |
| Total | 0 (0.0%) | 0.0 |
Fertility by Age by Marriage Status in Pence
| Age Bracket | Married | Unmarried |
| 15 to 19 years | 0 (0.0%) | 0 (0.0%) |
| 20 to 34 years | 0 (0.0%) | 0 (0.0%) |
| 35 to 50 years | 0 (0.0%) | 0 (0.0%) |
| Total | 0 (0.0%) | 0 (0.0%) |
Fertility by Education in Pence
| Educational Attainment | Women with Births | Births / 1,000 Women |
| Less than High School | 0 (0.0%) | 0.0 |
| High School Diploma | 0 (0.0%) | 0.0 |
| College or Associate's Degree | 0 (0.0%) | 0.0 |
| Bachelor's Degree | 0 (0.0%) | 0.0 |
| Graduate Degree | 0 (0.0%) | 0.0 |
| Total | 0 (0.0%) | 0.0 |
Fertility by Education by Marriage Status in Pence
| Educational Attainment | Married | Unmarried |
| Less than High School | 0 (0.0%) | 0 (0.0%) |
| High School Diploma | 0 (0.0%) | 0 (0.0%) |
| College or Associate's Degree | 0 (0.0%) | 0 (0.0%) |
| Bachelor's Degree | 0 (0.0%) | 0 (0.0%) |
| Graduate Degree | 0 (0.0%) | 0 (0.0%) |
| Total | 0 (0.0%) | 0 (0.0%) |
Employment Characteristics in Pence
Employment by Class of Employer in Pence
Among the 33 employed individuals in Pence, private company employees (17 | 51.5%), self-employed (incorporated) (6 | 18.2%), and self-employed (not incorporated) (4 | 12.1%) make up the most common classes of employment.
| Employer Class | # Employees | % Employees |
| Private Company Employees | 17 | 51.5% |
| Self-Employed (Incorporated) | 6 | 18.2% |
| Self-Employed (Not Incorporated) | 4 | 12.1% |
| Not-for-profit Organizations | 2 | 6.1% |
| Local Government Employees | 2 | 6.1% |
| State Government Employees | 2 | 6.1% |
| Federal Government Employees | 0 | 0.0% |
| Unpaid Family Workers | 0 | 0.0% |
| Total | 33 | 100.0% |
Employment Status by Age in Pence
According to the labor force statistics for Pence, out of the total population over 16 years of age (101), 34.7% or 35 individuals are in the labor force, with 5.7% or 2 of them unemployed. The age group with the highest labor force participation rate is 45 to 54 years, with 100.0% or 18 individuals in the labor force. Within the labor force, the 60 to 64 years age range has the highest percentage of unemployed individuals, with 50.0% or 2 of them being unemployed.
| Age Bracket | In Labor Force | Unemployed |
| 16 to 19 Years | 0 (0.0%) | 0 (0.0%) |
| 20 to 24 Years | 0 (0.0%) | 0 (0.0%) |
| 25 to 29 Years | 0 (0.0%) | 0 (0.0%) |
| 30 to 34 Years | 0 (0.0%) | 0 (0.0%) |
| 35 to 44 Years | 4 (66.7%) | 0 (0.0%) |
| 45 to 54 Years | 18 (100.0%) | 0 (0.0%) |
| 55 to 59 Years | 7 (46.7%) | 0 (0.0%) |
| 60 to 64 Years | 4 (66.7%) | 2 (50.0%) |
| 65 to 74 Years | 2 (12.5%) | 0 (0.0%) |
| 75 Years and over | 0 (0.0%) | 0 (0.0%) |
| Total | 35 (34.7%) | 2 (5.7%) |
Employment Status by Educational Attainment in Pence
According to labor force statistics for Pence, 73.3% of individuals (33) out of the total population between 25 and 64 years of age (45) are in the labor force, with 6.1% or 2 of them being unemployed. The group with the highest labor force participation rate are those with the educational attainment of college / associate degree, with 100.0% or 14 individuals in the labor force. Within the labor force, individuals with high school diploma education have the highest percentage of unemployment, with 13.3% or 2 of them being unemployed.
| Educational Attainment | In Labor Force | Unemployed |
| Less than High School | 0 (0.0%) | 0 (0.0%) |
| High School Diploma | 15 (65.2%) | 3 (13.3%) |
| College / Associate Degree | 14 (100.0%) | 0 (0.0%) |
| Bachelor's Degree or higher | 4 (50.0%) | 0 (0.0%) |
| Total | 33 (73.3%) | 3 (6.1%) |
Employment Occupations by Sex in Pence
Management, Business, Science and Arts Occupations
The most common Management, Business, Science and Arts occupations in Pence are Management (8 | 24.2%), Community & Social Service (2 | 6.1%), and Education Instruction & Library (2 | 6.1%).
Management, Business, Science and Arts Occupations by Sex
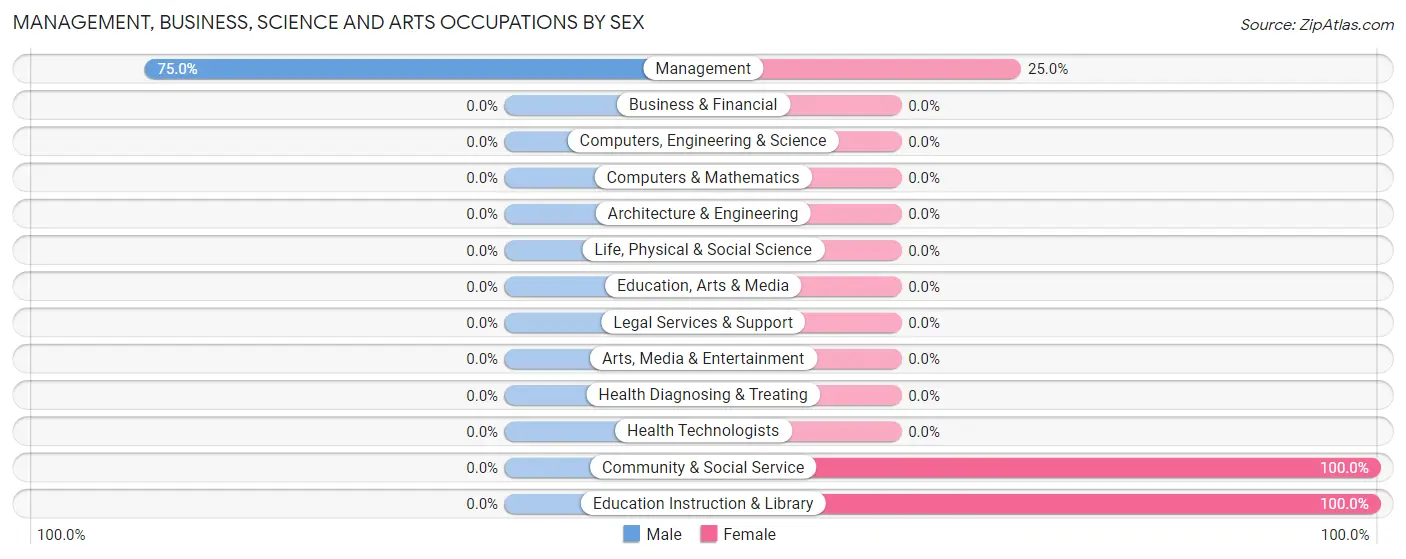
| Occupation | Male | Female |
| Management | 6 (75.0%) | 2 (25.0%) |
| Business & Financial | 0 (0.0%) | 0 (0.0%) |
| Computers, Engineering & Science | 0 (0.0%) | 0 (0.0%) |
| Computers & Mathematics | 0 (0.0%) | 0 (0.0%) |
| Architecture & Engineering | 0 (0.0%) | 0 (0.0%) |
| Life, Physical & Social Science | 0 (0.0%) | 0 (0.0%) |
| Community & Social Service | 0 (0.0%) | 2 (100.0%) |
| Education, Arts & Media | 0 (0.0%) | 0 (0.0%) |
| Legal Services & Support | 0 (0.0%) | 0 (0.0%) |
| Education Instruction & Library | 0 (0.0%) | 2 (100.0%) |
| Arts, Media & Entertainment | 0 (0.0%) | 0 (0.0%) |
| Health Diagnosing & Treating | 0 (0.0%) | 0 (0.0%) |
| Health Technologists | 0 (0.0%) | 0 (0.0%) |
| Total (Category) | 6 (60.0%) | 4 (40.0%) |
| Total (Overall) | 15 (45.5%) | 18 (54.5%) |
Services Occupations
Services Occupations by Sex
| Occupation | Male | Female |
| Healthcare Support | 0 (0.0%) | 0 (0.0%) |
| Security & Protection | 0 (0.0%) | 0 (0.0%) |
| Firefighting & Prevention | 0 (0.0%) | 0 (0.0%) |
| Law Enforcement | 0 (0.0%) | 0 (0.0%) |
| Food Preparation & Serving | 0 (0.0%) | 0 (0.0%) |
| Cleaning & Maintenance | 0 (0.0%) | 0 (0.0%) |
| Personal Care & Service | 0 (0.0%) | 0 (0.0%) |
| Total (Category) | 0 (0.0%) | 0 (0.0%) |
| Total (Overall) | 15 (45.5%) | 18 (54.5%) |
Sales and Office Occupations
The most common Sales and Office occupations in Pence are Sales & Related (8 | 24.2%), and Office & Administration (6 | 18.2%).
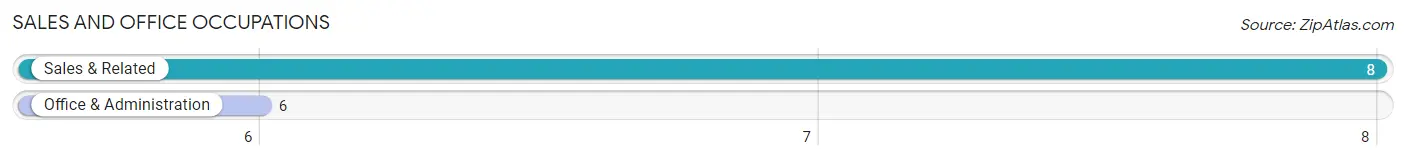
Sales and Office Occupations by Sex
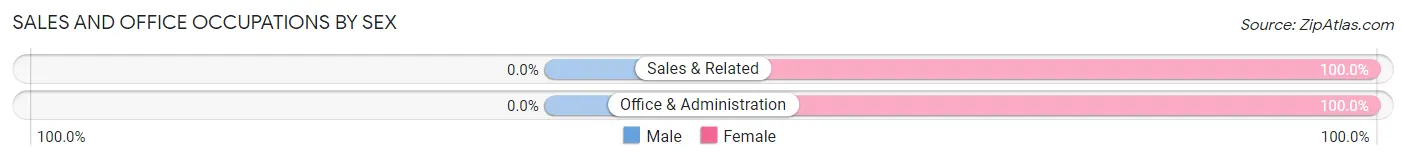
| Occupation | Male | Female |
| Sales & Related | 0 (0.0%) | 8 (100.0%) |
| Office & Administration | 0 (0.0%) | 6 (100.0%) |
| Total (Category) | 0 (0.0%) | 14 (100.0%) |
| Total (Overall) | 15 (45.5%) | 18 (54.5%) |
Natural Resources, Construction and Maintenance Occupations
The most common Natural Resources, Construction and Maintenance occupations in Pence are Construction & Extraction (2 | 6.1%), and Installation, Maintenance & Repair (2 | 6.1%).
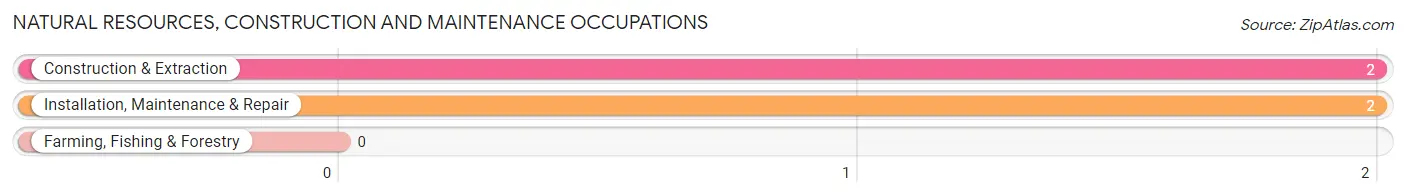
Natural Resources, Construction and Maintenance Occupations by Sex
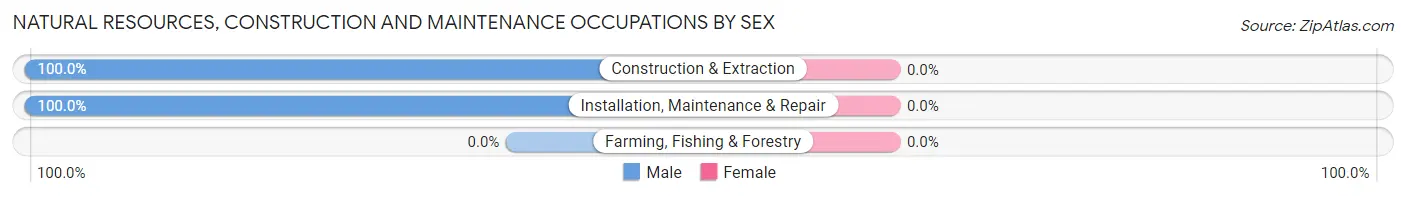
| Occupation | Male | Female |
| Farming, Fishing & Forestry | 0 (0.0%) | 0 (0.0%) |
| Construction & Extraction | 2 (100.0%) | 0 (0.0%) |
| Installation, Maintenance & Repair | 2 (100.0%) | 0 (0.0%) |
| Total (Category) | 4 (100.0%) | 0 (0.0%) |
| Total (Overall) | 15 (45.5%) | 18 (54.5%) |
Production, Transportation and Moving Occupations
The most common Production, Transportation and Moving occupations in Pence are , and Production (5 | 15.1%).
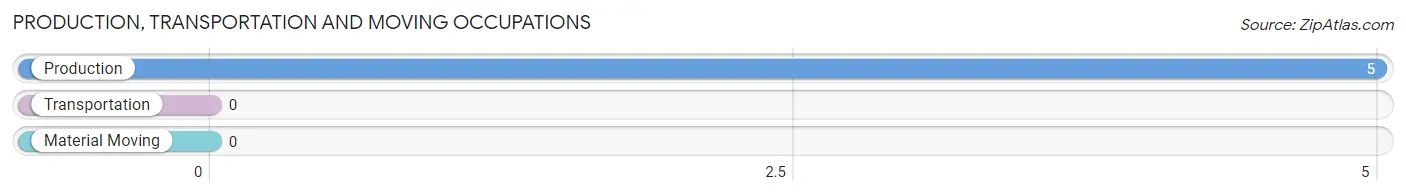
Production, Transportation and Moving Occupations by Sex
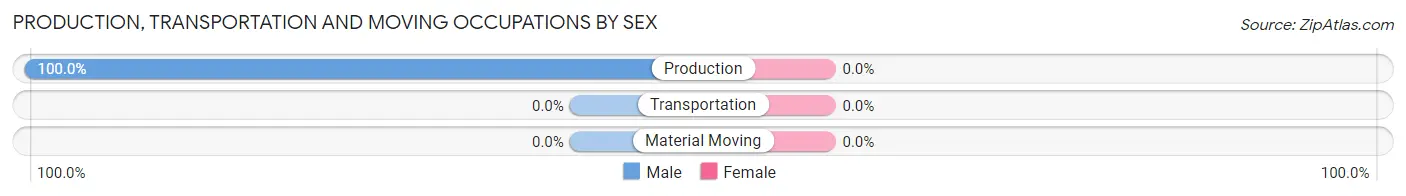
| Occupation | Male | Female |
| Production | 5 (100.0%) | 0 (0.0%) |
| Transportation | 0 (0.0%) | 0 (0.0%) |
| Material Moving | 0 (0.0%) | 0 (0.0%) |
| Total (Category) | 5 (100.0%) | 0 (0.0%) |
| Total (Overall) | 15 (45.5%) | 18 (54.5%) |
Employment Industries by Sex in Pence
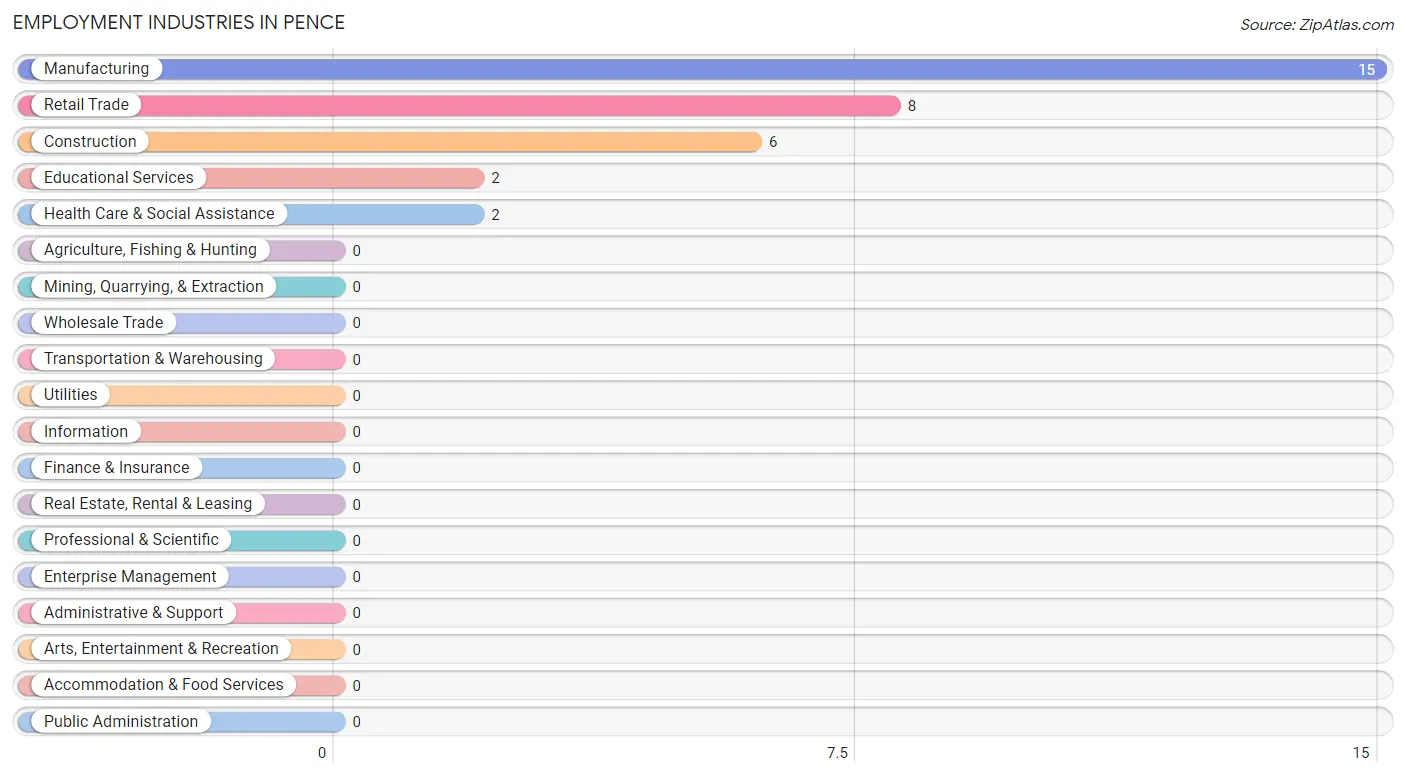
Employment Industries in Pence
The major employment industries in Pence include Manufacturing (15 | 45.5%), Retail Trade (8 | 24.2%), Construction (6 | 18.2%), Educational Services (2 | 6.1%), and Health Care & Social Assistance (2 | 6.1%).
Employment Industries by Sex in Pence
The Pence industries that see more men than women are Construction (100.0%), and Manufacturing (60.0%), whereas the industries that tend to have a higher number of women are Retail Trade (100.0%), Educational Services (100.0%), and Health Care & Social Assistance (100.0%).
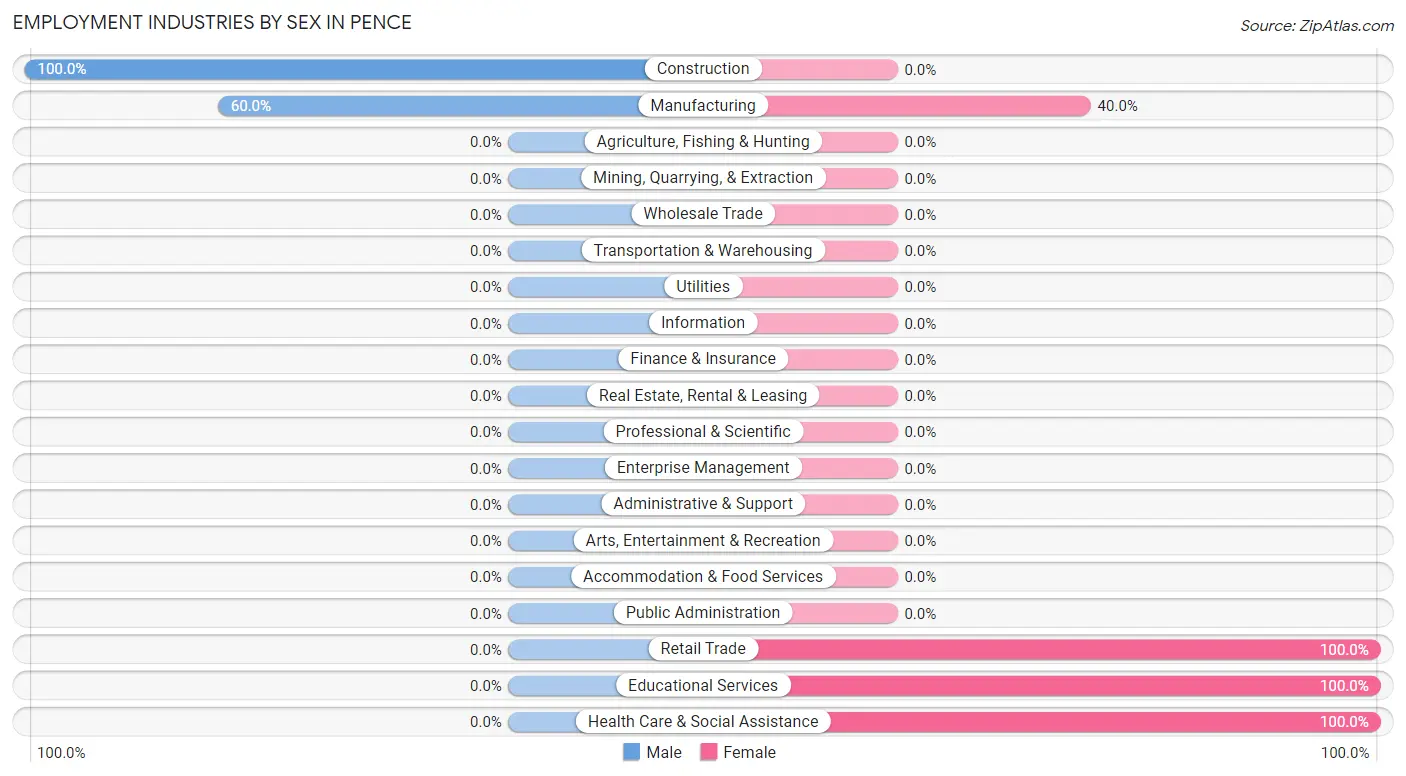
| Industry | Male | Female |
| Agriculture, Fishing & Hunting | 0 (0.0%) | 0 (0.0%) |
| Mining, Quarrying, & Extraction | 0 (0.0%) | 0 (0.0%) |
| Construction | 6 (100.0%) | 0 (0.0%) |
| Manufacturing | 9 (60.0%) | 6 (40.0%) |
| Wholesale Trade | 0 (0.0%) | 0 (0.0%) |
| Retail Trade | 0 (0.0%) | 8 (100.0%) |
| Transportation & Warehousing | 0 (0.0%) | 0 (0.0%) |
| Utilities | 0 (0.0%) | 0 (0.0%) |
| Information | 0 (0.0%) | 0 (0.0%) |
| Finance & Insurance | 0 (0.0%) | 0 (0.0%) |
| Real Estate, Rental & Leasing | 0 (0.0%) | 0 (0.0%) |
| Professional & Scientific | 0 (0.0%) | 0 (0.0%) |
| Enterprise Management | 0 (0.0%) | 0 (0.0%) |
| Administrative & Support | 0 (0.0%) | 0 (0.0%) |
| Educational Services | 0 (0.0%) | 2 (100.0%) |
| Health Care & Social Assistance | 0 (0.0%) | 2 (100.0%) |
| Arts, Entertainment & Recreation | 0 (0.0%) | 0 (0.0%) |
| Accommodation & Food Services | 0 (0.0%) | 0 (0.0%) |
| Public Administration | 0 (0.0%) | 0 (0.0%) |
| Total | 15 (45.5%) | 18 (54.5%) |
Education in Pence
School Enrollment in Pence
The most common levels of schooling among the 29 students in Pence are high school (18 | 62.1%), middle school (5 | 17.2%), and nursery / preschool (4 | 13.8%).
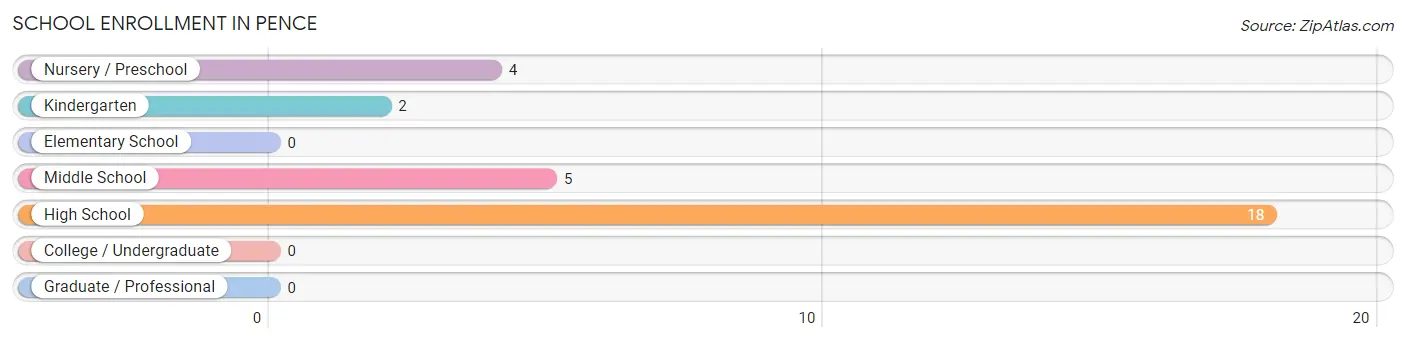
| School Level | # Students | % Students |
| Nursery / Preschool | 4 | 13.8% |
| Kindergarten | 2 | 6.9% |
| Elementary School | 0 | 0.0% |
| Middle School | 5 | 17.2% |
| High School | 18 | 62.1% |
| College / Undergraduate | 0 | 0.0% |
| Graduate / Professional | 0 | 0.0% |
| Total | 29 | 100.0% |
School Enrollment by Age by Funding Source in Pence
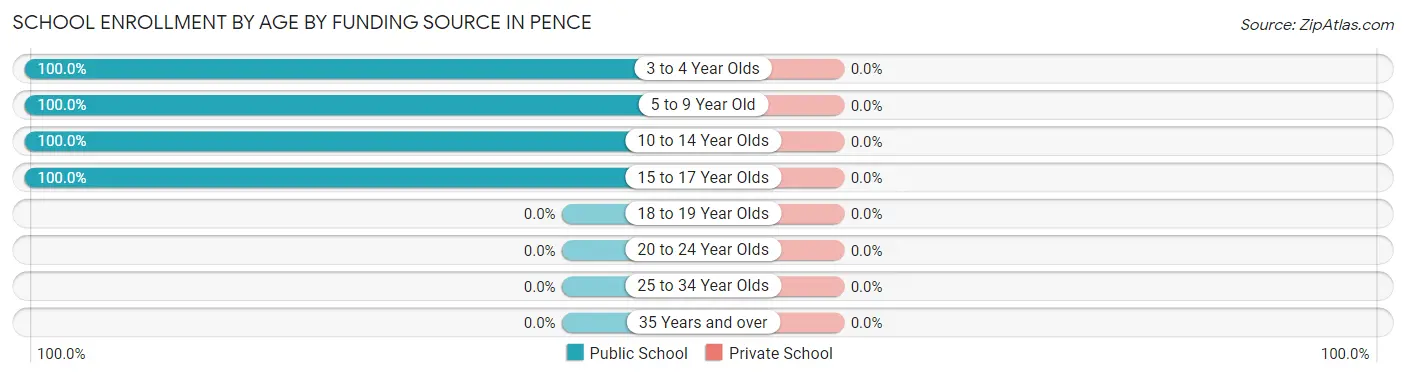
| Age Bracket | Public School | Private School |
| 3 to 4 Year Olds | 4 (100.0%) | 0 (0.0%) |
| 5 to 9 Year Old | 2 (100.0%) | 0 (0.0%) |
| 10 to 14 Year Olds | 5 (100.0%) | 0 (0.0%) |
| 15 to 17 Year Olds | 18 (100.0%) | 0 (0.0%) |
| 18 to 19 Year Olds | 0 (0.0%) | 0 (0.0%) |
| 20 to 24 Year Olds | 0 (0.0%) | 0 (0.0%) |
| 25 to 34 Year Olds | 0 (0.0%) | 0 (0.0%) |
| 35 Years and over | 0 (0.0%) | 0 (0.0%) |
| Total | 29 (100.0%) | 0 (0.0%) |
Educational Attainment by Field of Study in Pence
Education (5 | 27.8%), arts & humanities (5 | 27.8%), bio, nature & agricultural (4 | 22.2%), and psychology (4 | 22.2%) are the most common fields of study among 18 individuals in Pence who have obtained a bachelor's degree or higher.
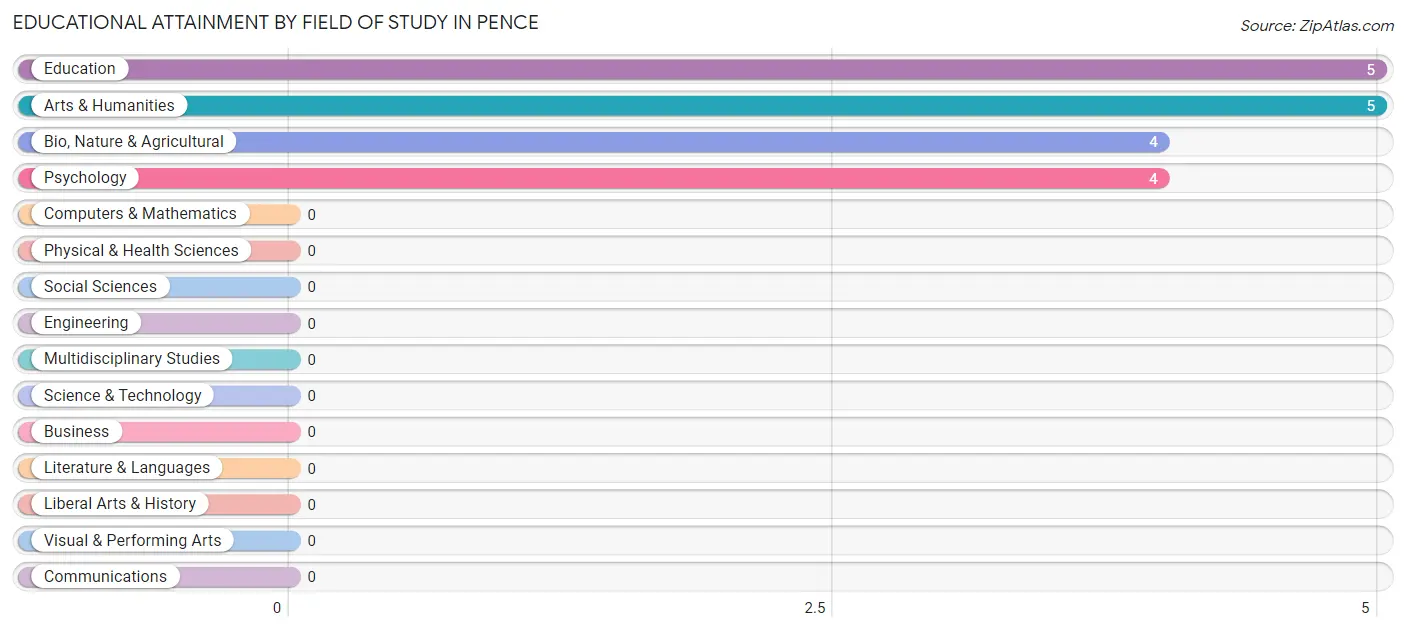
| Field of Study | # Graduates | % Graduates |
| Computers & Mathematics | 0 | 0.0% |
| Bio, Nature & Agricultural | 4 | 22.2% |
| Physical & Health Sciences | 0 | 0.0% |
| Psychology | 4 | 22.2% |
| Social Sciences | 0 | 0.0% |
| Engineering | 0 | 0.0% |
| Multidisciplinary Studies | 0 | 0.0% |
| Science & Technology | 0 | 0.0% |
| Business | 0 | 0.0% |
| Education | 5 | 27.8% |
| Literature & Languages | 0 | 0.0% |
| Liberal Arts & History | 0 | 0.0% |
| Visual & Performing Arts | 0 | 0.0% |
| Communications | 0 | 0.0% |
| Arts & Humanities | 5 | 27.8% |
| Total | 18 | 100.0% |
Transportation & Commute in Pence
Vehicle Availability by Sex in Pence
The most prevalent vehicle ownership categories in Pence are males with 2 vehicles (9, accounting for 60.0%) and females with 2 vehicles (14, making up 50.0%).
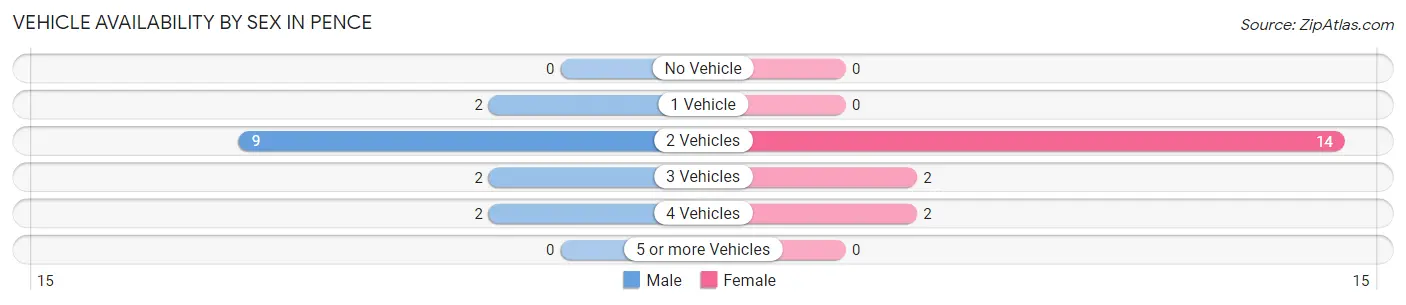
| Vehicles Available | Male | Female |
| No Vehicle | 0 (0.0%) | 0 (0.0%) |
| 1 Vehicle | 2 (13.3%) | 0 (0.0%) |
| 2 Vehicles | 9 (60.0%) | 14 (77.8%) |
| 3 Vehicles | 2 (13.3%) | 2 (11.1%) |
| 4 Vehicles | 2 (13.3%) | 2 (11.1%) |
| 5 or more Vehicles | 0 (0.0%) | 0 (0.0%) |
| Total | 15 (100.0%) | 18 (100.0%) |
Commute Time in Pence
The most frequently occuring commute durations in Pence are 10 to 14 minutes (17 commuters, 51.5%), 5 to 9 minutes (6 commuters, 18.2%), and 20 to 24 minutes (6 commuters, 18.2%).
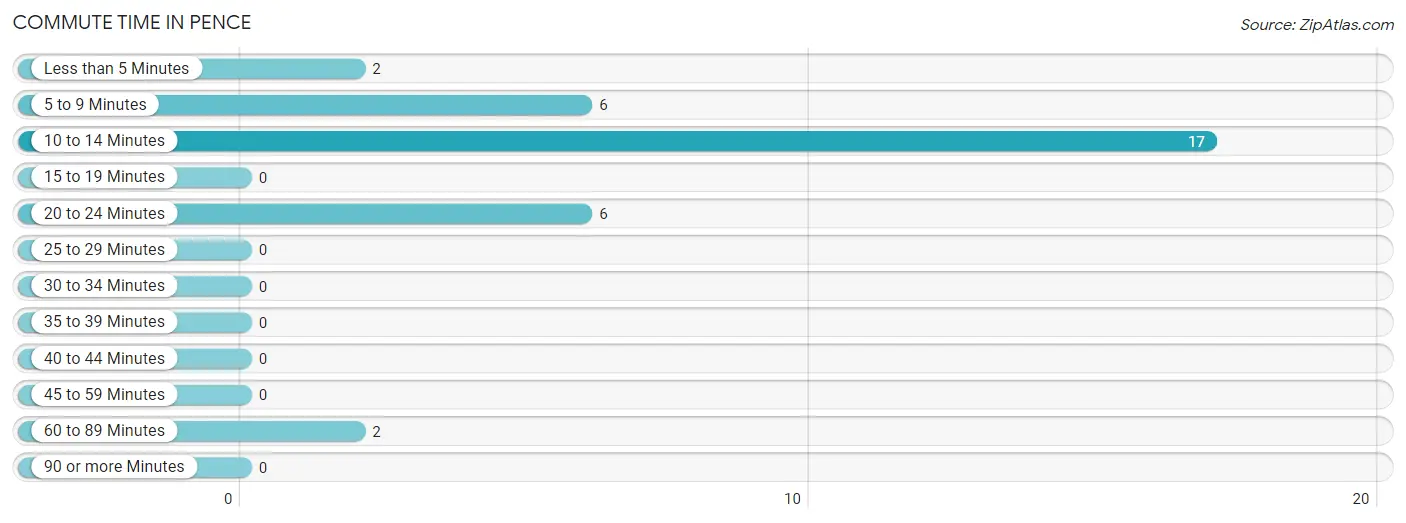
| Commute Time | # Commuters | % Commuters |
| Less than 5 Minutes | 2 | 6.1% |
| 5 to 9 Minutes | 6 | 18.2% |
| 10 to 14 Minutes | 17 | 51.5% |
| 15 to 19 Minutes | 0 | 0.0% |
| 20 to 24 Minutes | 6 | 18.2% |
| 25 to 29 Minutes | 0 | 0.0% |
| 30 to 34 Minutes | 0 | 0.0% |
| 35 to 39 Minutes | 0 | 0.0% |
| 40 to 44 Minutes | 0 | 0.0% |
| 45 to 59 Minutes | 0 | 0.0% |
| 60 to 89 Minutes | 2 | 6.1% |
| 90 or more Minutes | 0 | 0.0% |
Commute Time by Sex in Pence
The most common commute times in Pence are 5 to 9 minutes (6 commuters, 40.0%) for males and 10 to 14 minutes (12 commuters, 66.7%) for females.
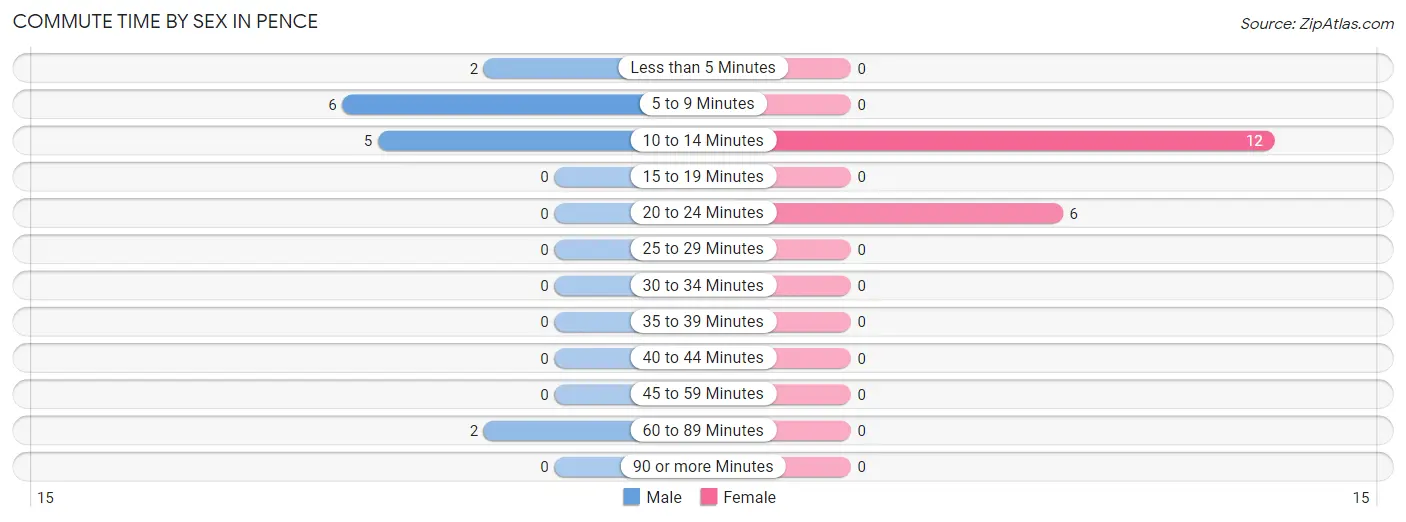
| Commute Time | Male | Female |
| Less than 5 Minutes | 2 (13.3%) | 0 (0.0%) |
| 5 to 9 Minutes | 6 (40.0%) | 0 (0.0%) |
| 10 to 14 Minutes | 5 (33.3%) | 12 (66.7%) |
| 15 to 19 Minutes | 0 (0.0%) | 0 (0.0%) |
| 20 to 24 Minutes | 0 (0.0%) | 6 (33.3%) |
| 25 to 29 Minutes | 0 (0.0%) | 0 (0.0%) |
| 30 to 34 Minutes | 0 (0.0%) | 0 (0.0%) |
| 35 to 39 Minutes | 0 (0.0%) | 0 (0.0%) |
| 40 to 44 Minutes | 0 (0.0%) | 0 (0.0%) |
| 45 to 59 Minutes | 0 (0.0%) | 0 (0.0%) |
| 60 to 89 Minutes | 2 (13.3%) | 0 (0.0%) |
| 90 or more Minutes | 0 (0.0%) | 0 (0.0%) |
Time of Departure to Work by Sex in Pence
The most frequent times of departure to work in Pence are 11:00 AM to 11:59 AM (4, 26.7%) for males and 7:30 AM to 7:59 AM (6, 33.3%) for females.
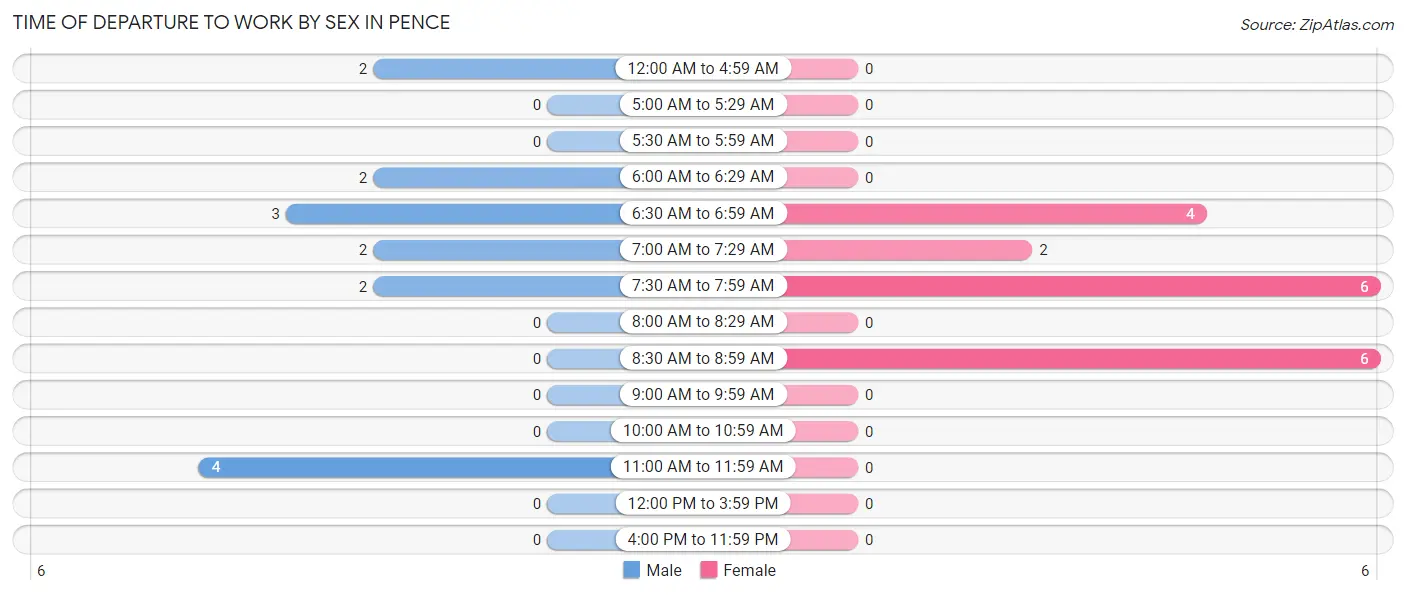
| Time of Departure | Male | Female |
| 12:00 AM to 4:59 AM | 2 (13.3%) | 0 (0.0%) |
| 5:00 AM to 5:29 AM | 0 (0.0%) | 0 (0.0%) |
| 5:30 AM to 5:59 AM | 0 (0.0%) | 0 (0.0%) |
| 6:00 AM to 6:29 AM | 2 (13.3%) | 0 (0.0%) |
| 6:30 AM to 6:59 AM | 3 (20.0%) | 4 (22.2%) |
| 7:00 AM to 7:29 AM | 2 (13.3%) | 2 (11.1%) |
| 7:30 AM to 7:59 AM | 2 (13.3%) | 6 (33.3%) |
| 8:00 AM to 8:29 AM | 0 (0.0%) | 0 (0.0%) |
| 8:30 AM to 8:59 AM | 0 (0.0%) | 6 (33.3%) |
| 9:00 AM to 9:59 AM | 0 (0.0%) | 0 (0.0%) |
| 10:00 AM to 10:59 AM | 0 (0.0%) | 0 (0.0%) |
| 11:00 AM to 11:59 AM | 4 (26.7%) | 0 (0.0%) |
| 12:00 PM to 3:59 PM | 0 (0.0%) | 0 (0.0%) |
| 4:00 PM to 11:59 PM | 0 (0.0%) | 0 (0.0%) |
| Total | 15 (100.0%) | 18 (100.0%) |
Housing Occupancy in Pence
Occupancy by Ownership in Pence
Of the total 60 dwellings in Pence, owner-occupied units account for 59 (98.3%), while renter-occupied units make up 1 (1.7%).
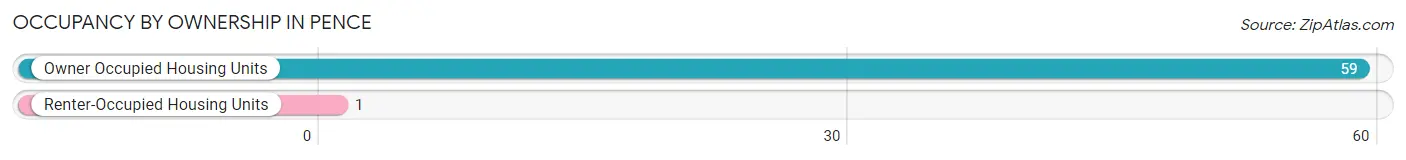
| Occupancy | # Housing Units | % Housing Units |
| Owner Occupied Housing Units | 59 | 98.3% |
| Renter-Occupied Housing Units | 1 | 1.7% |
| Total Occupied Housing Units | 60 | 100.0% |
Occupancy by Household Size in Pence
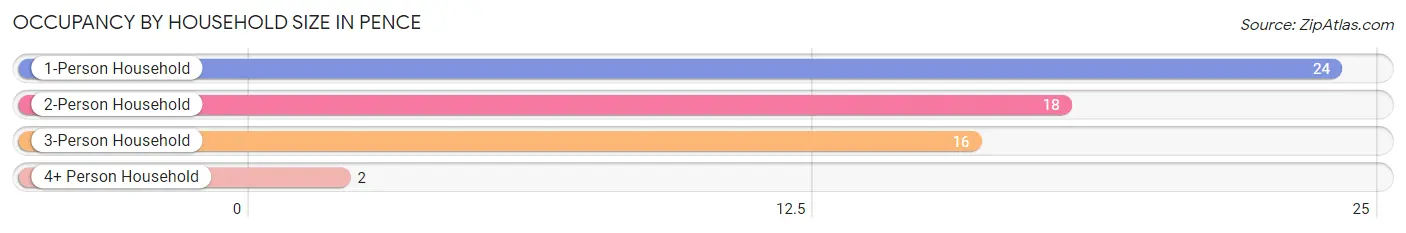
| Household Size | # Housing Units | % Housing Units |
| 1-Person Household | 24 | 40.0% |
| 2-Person Household | 18 | 30.0% |
| 3-Person Household | 16 | 26.7% |
| 4+ Person Household | 2 | 3.3% |
| Total Housing Units | 60 | 100.0% |
Occupancy by Ownership by Household Size in Pence
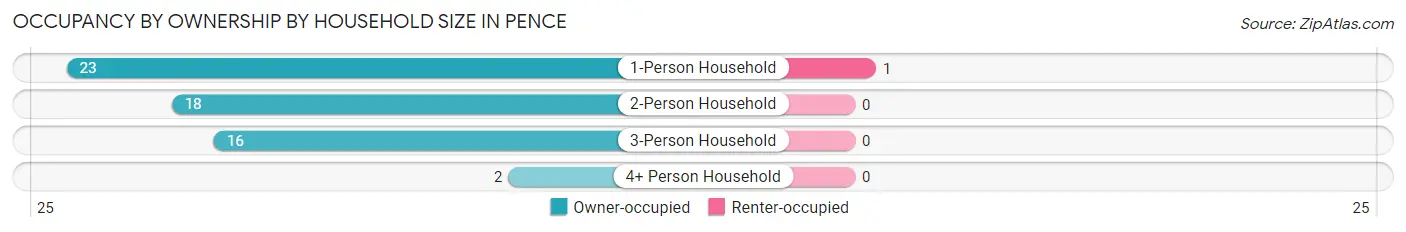
| Household Size | Owner-occupied | Renter-occupied |
| 1-Person Household | 23 (95.8%) | 1 (4.2%) |
| 2-Person Household | 18 (100.0%) | 0 (0.0%) |
| 3-Person Household | 16 (100.0%) | 0 (0.0%) |
| 4+ Person Household | 2 (100.0%) | 0 (0.0%) |
| Total Housing Units | 59 (98.3%) | 1 (1.7%) |
Occupancy by Educational Attainment in Pence
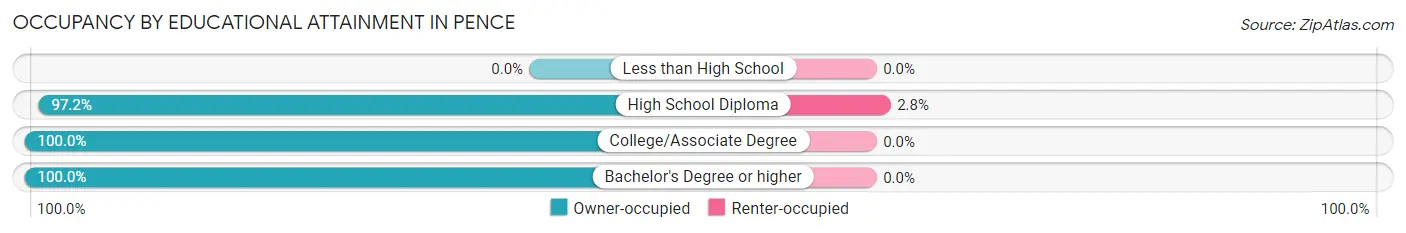
| Household Size | Owner-occupied | Renter-occupied |
| Less than High School | 0 (0.0%) | 0 (0.0%) |
| High School Diploma | 35 (97.2%) | 1 (2.8%) |
| College/Associate Degree | 16 (100.0%) | 0 (0.0%) |
| Bachelor's Degree or higher | 8 (100.0%) | 0 (0.0%) |
Occupancy by Age of Householder in Pence
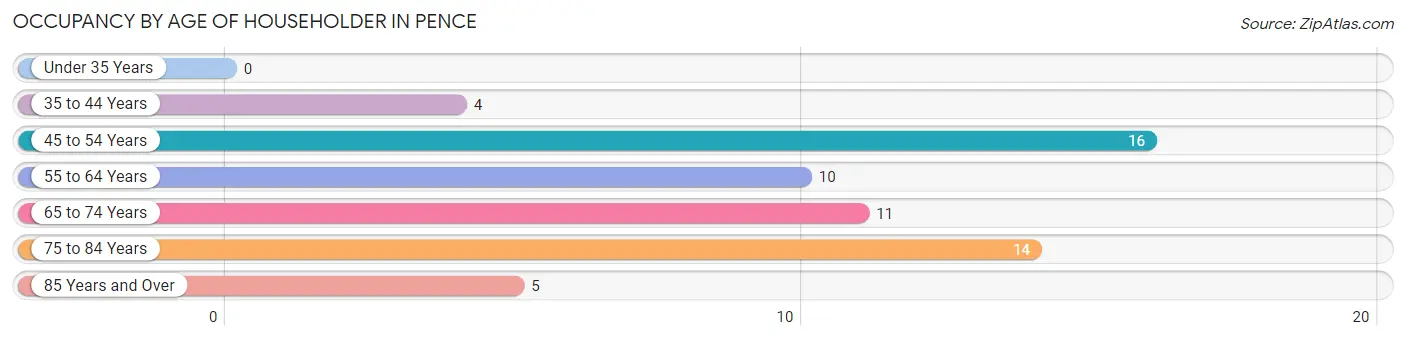
| Age Bracket | # Households | % Households |
| Under 35 Years | 0 | 0.0% |
| 35 to 44 Years | 4 | 6.7% |
| 45 to 54 Years | 16 | 26.7% |
| 55 to 64 Years | 10 | 16.7% |
| 65 to 74 Years | 11 | 18.3% |
| 75 to 84 Years | 14 | 23.3% |
| 85 Years and Over | 5 | 8.3% |
| Total | 60 | 100.0% |
Housing Finances in Pence
Median Income by Occupancy in Pence
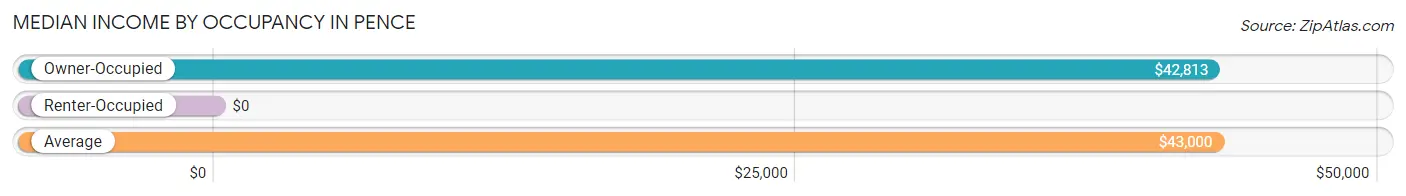
| Occupancy Type | # Households | Median Income |
| Owner-Occupied | 59 (98.3%) | $42,813 |
| Renter-Occupied | 1 (1.7%) | $0 |
| Average | 60 (100.0%) | $43,000 |
Occupancy by Householder Income Bracket in Pence
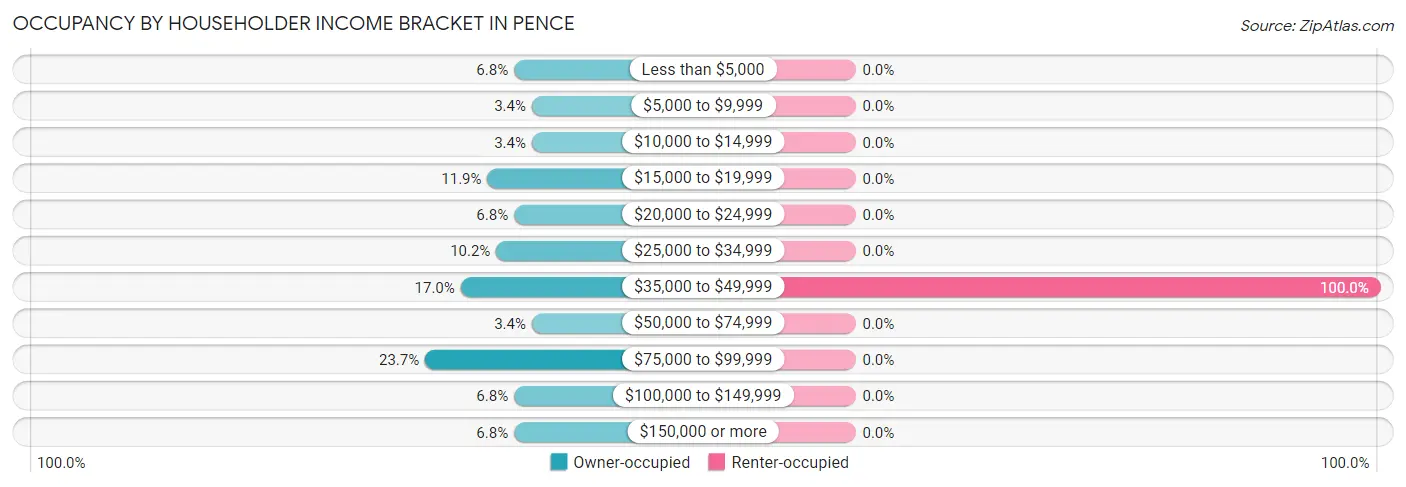
| Income Bracket | Owner-occupied | Renter-occupied |
| Less than $5,000 | 4 (6.8%) | 0 (0.0%) |
| $5,000 to $9,999 | 2 (3.4%) | 0 (0.0%) |
| $10,000 to $14,999 | 2 (3.4%) | 0 (0.0%) |
| $15,000 to $19,999 | 7 (11.9%) | 0 (0.0%) |
| $20,000 to $24,999 | 4 (6.8%) | 0 (0.0%) |
| $25,000 to $34,999 | 6 (10.2%) | 0 (0.0%) |
| $35,000 to $49,999 | 10 (17.0%) | 1 (100.0%) |
| $50,000 to $74,999 | 2 (3.4%) | 0 (0.0%) |
| $75,000 to $99,999 | 14 (23.7%) | 0 (0.0%) |
| $100,000 to $149,999 | 4 (6.8%) | 0 (0.0%) |
| $150,000 or more | 4 (6.8%) | 0 (0.0%) |
| Total | 59 (100.0%) | 1 (100.0%) |
Monthly Housing Cost Tiers in Pence
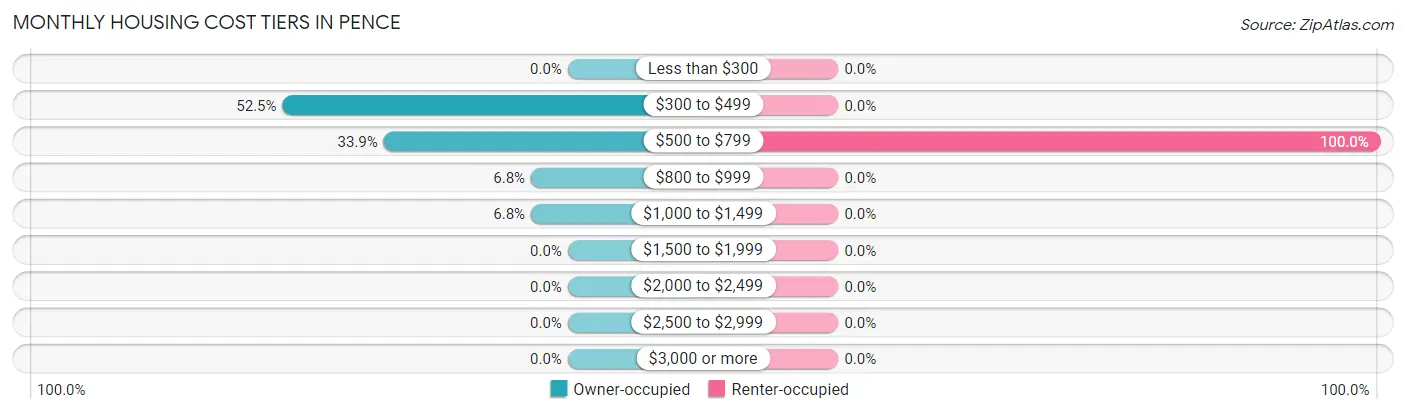
| Monthly Cost | Owner-occupied | Renter-occupied |
| Less than $300 | 0 (0.0%) | 0 (0.0%) |
| $300 to $499 | 31 (52.5%) | 0 (0.0%) |
| $500 to $799 | 20 (33.9%) | 1 (100.0%) |
| $800 to $999 | 4 (6.8%) | 0 (0.0%) |
| $1,000 to $1,499 | 4 (6.8%) | 0 (0.0%) |
| $1,500 to $1,999 | 0 (0.0%) | 0 (0.0%) |
| $2,000 to $2,499 | 0 (0.0%) | 0 (0.0%) |
| $2,500 to $2,999 | 0 (0.0%) | 0 (0.0%) |
| $3,000 or more | 0 (0.0%) | 0 (0.0%) |
| Total | 59 (100.0%) | 1 (100.0%) |
Physical Housing Characteristics in Pence
Housing Structures in Pence
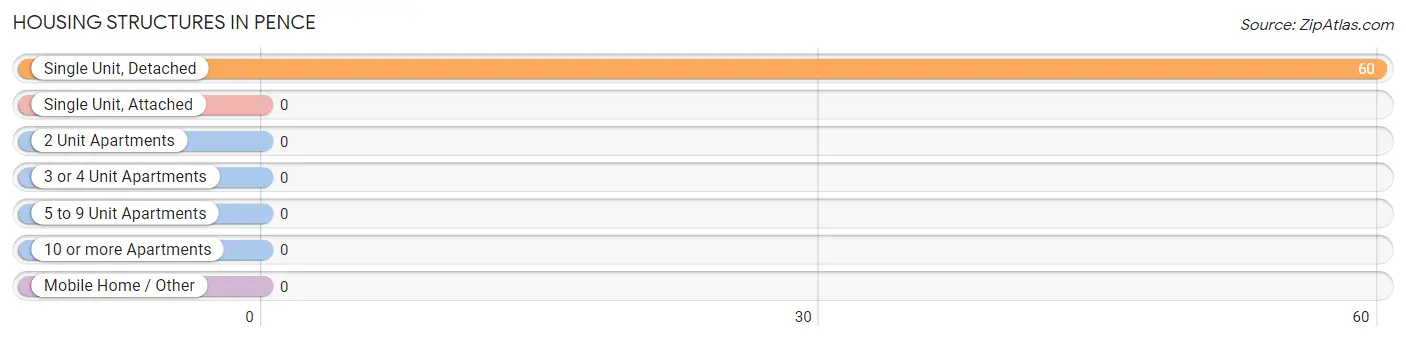
| Structure Type | # Housing Units | % Housing Units |
| Single Unit, Detached | 60 | 100.0% |
| Single Unit, Attached | 0 | 0.0% |
| 2 Unit Apartments | 0 | 0.0% |
| 3 or 4 Unit Apartments | 0 | 0.0% |
| 5 to 9 Unit Apartments | 0 | 0.0% |
| 10 or more Apartments | 0 | 0.0% |
| Mobile Home / Other | 0 | 0.0% |
| Total | 60 | 100.0% |
Housing Structures by Occupancy in Pence
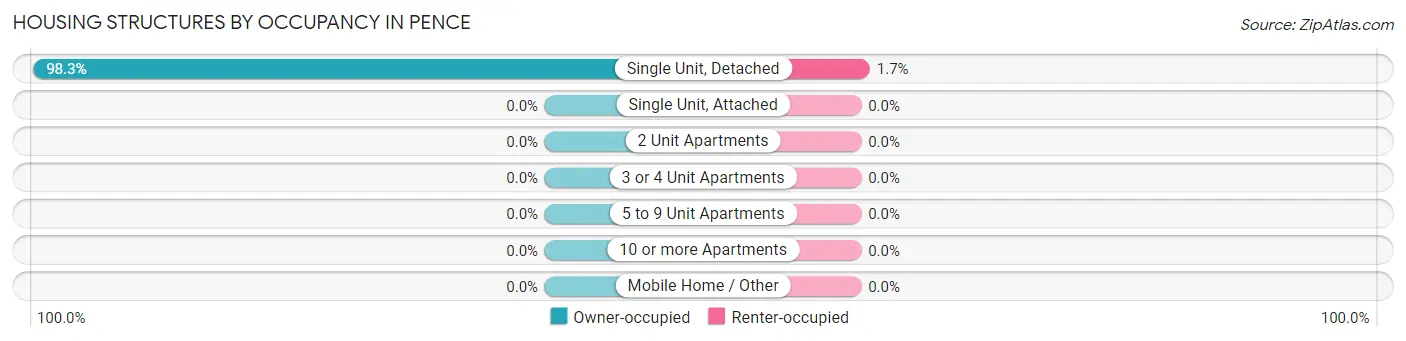
| Structure Type | Owner-occupied | Renter-occupied |
| Single Unit, Detached | 59 (98.3%) | 1 (1.7%) |
| Single Unit, Attached | 0 (0.0%) | 0 (0.0%) |
| 2 Unit Apartments | 0 (0.0%) | 0 (0.0%) |
| 3 or 4 Unit Apartments | 0 (0.0%) | 0 (0.0%) |
| 5 to 9 Unit Apartments | 0 (0.0%) | 0 (0.0%) |
| 10 or more Apartments | 0 (0.0%) | 0 (0.0%) |
| Mobile Home / Other | 0 (0.0%) | 0 (0.0%) |
| Total | 59 (98.3%) | 1 (1.7%) |
Housing Structures by Number of Rooms in Pence
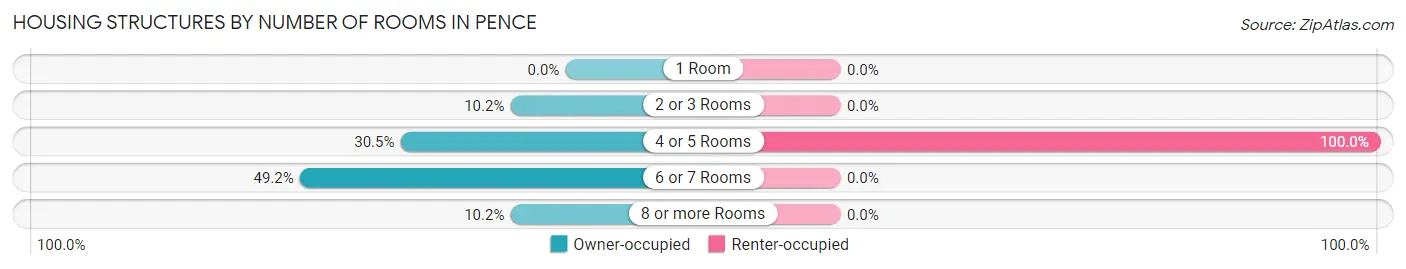
| Number of Rooms | Owner-occupied | Renter-occupied |
| 1 Room | 0 (0.0%) | 0 (0.0%) |
| 2 or 3 Rooms | 6 (10.2%) | 0 (0.0%) |
| 4 or 5 Rooms | 18 (30.5%) | 1 (100.0%) |
| 6 or 7 Rooms | 29 (49.1%) | 0 (0.0%) |
| 8 or more Rooms | 6 (10.2%) | 0 (0.0%) |
| Total | 59 (100.0%) | 1 (100.0%) |
Housing Structure by Heating Type in Pence
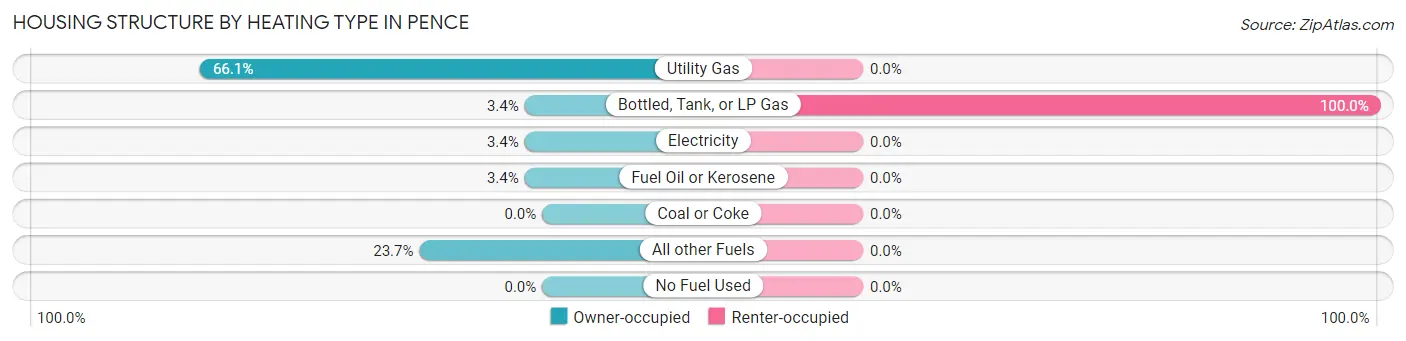
| Heating Type | Owner-occupied | Renter-occupied |
| Utility Gas | 39 (66.1%) | 0 (0.0%) |
| Bottled, Tank, or LP Gas | 2 (3.4%) | 1 (100.0%) |
| Electricity | 2 (3.4%) | 0 (0.0%) |
| Fuel Oil or Kerosene | 2 (3.4%) | 0 (0.0%) |
| Coal or Coke | 0 (0.0%) | 0 (0.0%) |
| All other Fuels | 14 (23.7%) | 0 (0.0%) |
| No Fuel Used | 0 (0.0%) | 0 (0.0%) |
| Total | 59 (100.0%) | 1 (100.0%) |
Household Vehicle Usage in Pence
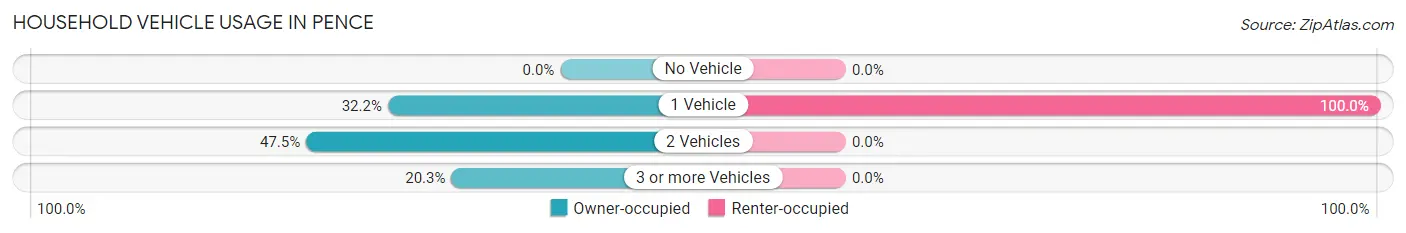
| Vehicles per Household | Owner-occupied | Renter-occupied |
| No Vehicle | 0 (0.0%) | 0 (0.0%) |
| 1 Vehicle | 19 (32.2%) | 1 (100.0%) |
| 2 Vehicles | 28 (47.5%) | 0 (0.0%) |
| 3 or more Vehicles | 12 (20.3%) | 0 (0.0%) |
| Total | 59 (100.0%) | 1 (100.0%) |
Real Estate & Mortgages in Pence
Real Estate and Mortgage Overview in Pence
| Characteristic | Without Mortgage | With Mortgage |
| Housing Units | 43 | 16 |
| Median Property Value | $98,300 | $0 |
| Median Household Income | - | - |
| Monthly Housing Costs | $441 | $0 |
| Real Estate Taxes | $1,135 | $0 |
Property Value by Mortgage Status in Pence
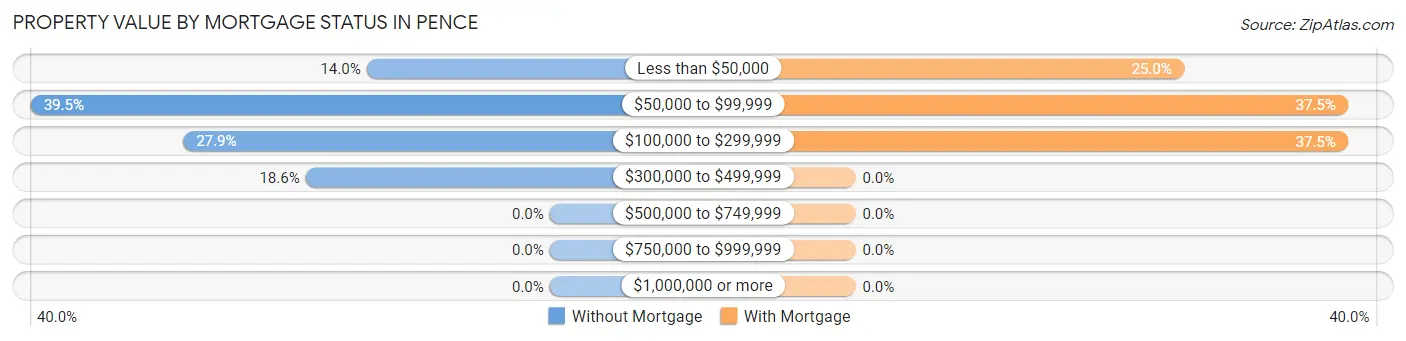
| Property Value | Without Mortgage | With Mortgage |
| Less than $50,000 | 6 (14.0%) | 4 (25.0%) |
| $50,000 to $99,999 | 17 (39.5%) | 6 (37.5%) |
| $100,000 to $299,999 | 12 (27.9%) | 6 (37.5%) |
| $300,000 to $499,999 | 8 (18.6%) | 0 (0.0%) |
| $500,000 to $749,999 | 0 (0.0%) | 0 (0.0%) |
| $750,000 to $999,999 | 0 (0.0%) | 0 (0.0%) |
| $1,000,000 or more | 0 (0.0%) | 0 (0.0%) |
| Total | 43 (100.0%) | 16 (100.0%) |
Household Income by Mortgage Status in Pence
| Household Income | Without Mortgage | With Mortgage |
| Less than $10,000 | 4 (9.3%) | 0 (0.0%) |
| $10,000 to $24,999 | 11 (25.6%) | 2 (12.5%) |
| $25,000 to $34,999 | 0 (0.0%) | 2 (12.5%) |
| $35,000 to $49,999 | 8 (18.6%) | 6 (37.5%) |
| $50,000 to $74,999 | 2 (4.6%) | 2 (12.5%) |
| $75,000 to $99,999 | 10 (23.3%) | 0 (0.0%) |
| $100,000 to $149,999 | 4 (9.3%) | 4 (25.0%) |
| $150,000 or more | 4 (9.3%) | 0 (0.0%) |
| Total | 43 (100.0%) | 16 (100.0%) |
Property Value to Household Income Ratio in Pence
| Value-to-Income Ratio | Without Mortgage | With Mortgage |
| Less than 2.0x | 20 (46.5%) | 31,667 (197,918.8%) |
| 2.0x to 2.9x | 2 (4.6%) | 8 (50.0%) |
| 3.0x to 3.9x | 0 (0.0%) | 2 (12.5%) |
| 4.0x or more | 21 (48.8%) | 0 (0.0%) |
| Total | 43 (100.0%) | 16 (100.0%) |
Real Estate Taxes by Mortgage Status in Pence
| Property Taxes | Without Mortgage | With Mortgage |
| Less than $800 | 10 (23.3%) | 0 (0.0%) |
| $800 to $1,499 | 21 (48.8%) | 12 (75.0%) |
| $800 to $1,499 | 12 (27.9%) | 4 (25.0%) |
| Total | 43 (100.0%) | 16 (100.0%) |
Health & Disability in Pence
Health Insurance Coverage by Age in Pence
| Age Bracket | With Coverage | Without Coverage |
| Under 6 Years | 6 (100.0%) | 0 (0.0%) |
| 6 to 18 Years | 23 (100.0%) | 0 (0.0%) |
| 19 to 25 Years | 0 (0.0%) | 0 (0.0%) |
| 26 to 34 Years | 0 (0.0%) | 0 (0.0%) |
| 35 to 44 Years | 6 (100.0%) | 0 (0.0%) |
| 45 to 54 Years | 18 (100.0%) | 0 (0.0%) |
| 55 to 64 Years | 20 (95.2%) | 1 (4.8%) |
| 65 to 74 Years | 16 (100.0%) | 0 (0.0%) |
| 75 Years and older | 31 (100.0%) | 0 (0.0%) |
| Total | 120 (99.2%) | 1 (0.8%) |
Health Insurance Coverage by Citizenship Status in Pence
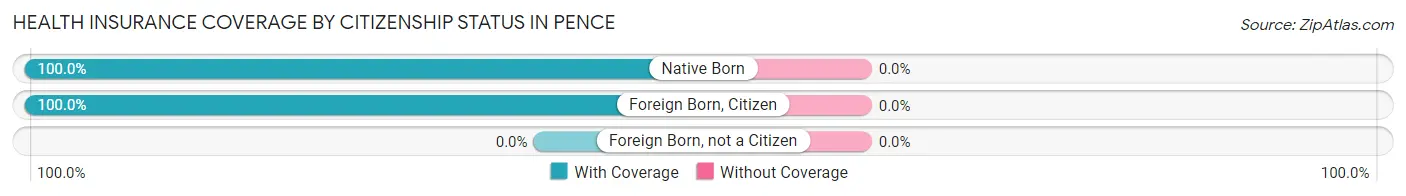
| Citizenship Status | With Coverage | Without Coverage |
| Native Born | 6 (100.0%) | 0 (0.0%) |
| Foreign Born, Citizen | 23 (100.0%) | 0 (0.0%) |
| Foreign Born, not a Citizen | 0 (0.0%) | 0 (0.0%) |
Health Insurance Coverage by Household Income in Pence
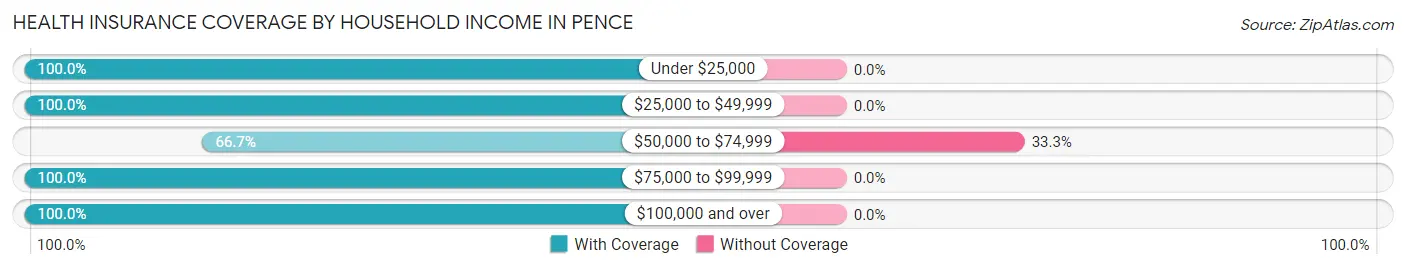
| Household Income | With Coverage | Without Coverage |
| Under $25,000 | 24 (100.0%) | 0 (0.0%) |
| $25,000 to $49,999 | 29 (100.0%) | 0 (0.0%) |
| $50,000 to $74,999 | 2 (66.7%) | 1 (33.3%) |
| $75,000 to $99,999 | 41 (100.0%) | 0 (0.0%) |
| $100,000 and over | 24 (100.0%) | 0 (0.0%) |
Public vs Private Health Insurance Coverage by Age in Pence
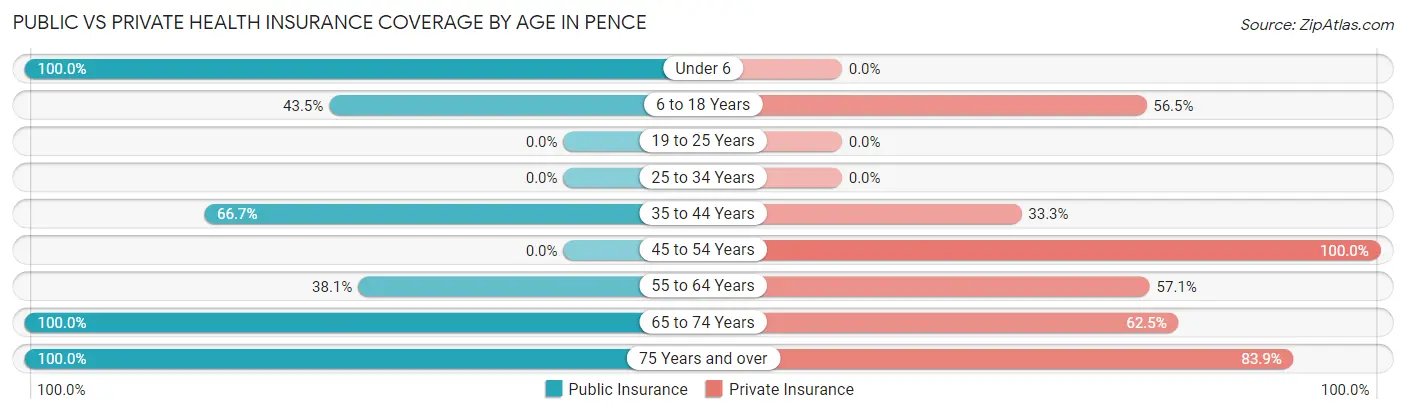
| Age Bracket | Public Insurance | Private Insurance |
| Under 6 | 6 (100.0%) | 0 (0.0%) |
| 6 to 18 Years | 10 (43.5%) | 13 (56.5%) |
| 19 to 25 Years | 0 (0.0%) | 0 (0.0%) |
| 25 to 34 Years | 0 (0.0%) | 0 (0.0%) |
| 35 to 44 Years | 4 (66.7%) | 2 (33.3%) |
| 45 to 54 Years | 0 (0.0%) | 18 (100.0%) |
| 55 to 64 Years | 8 (38.1%) | 12 (57.1%) |
| 65 to 74 Years | 16 (100.0%) | 10 (62.5%) |
| 75 Years and over | 31 (100.0%) | 26 (83.9%) |
| Total | 75 (62.0%) | 81 (66.9%) |
Disability Status by Sex by Age in Pence
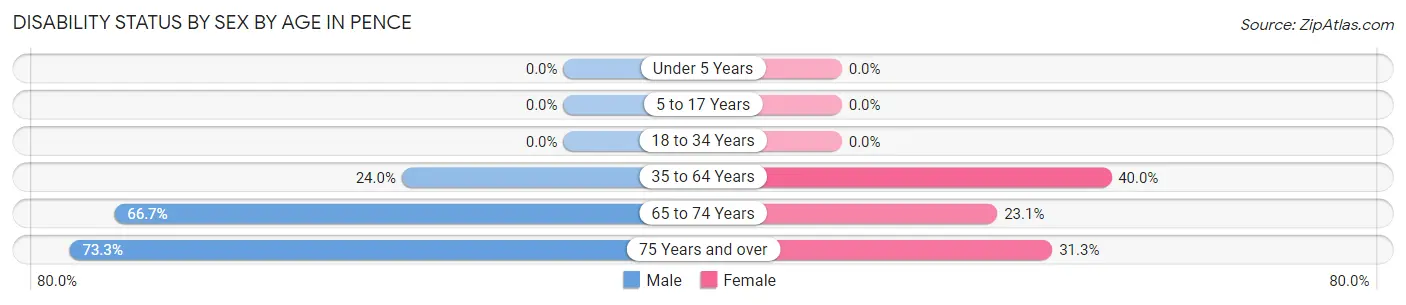
| Age Bracket | Male | Female |
| Under 5 Years | 0 (0.0%) | 0 (0.0%) |
| 5 to 17 Years | 0 (0.0%) | 0 (0.0%) |
| 18 to 34 Years | 0 (0.0%) | 0 (0.0%) |
| 35 to 64 Years | 6 (24.0%) | 8 (40.0%) |
| 65 to 74 Years | 2 (66.7%) | 3 (23.1%) |
| 75 Years and over | 11 (73.3%) | 5 (31.2%) |
Disability Class by Sex by Age in Pence
Disability Class: Hearing Difficulty
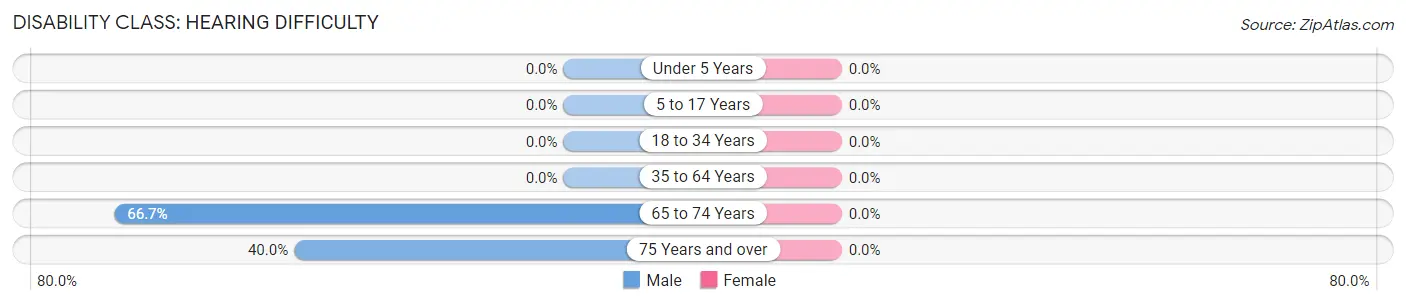
| Age Bracket | Male | Female |
| Under 5 Years | 0 (0.0%) | 0 (0.0%) |
| 5 to 17 Years | 0 (0.0%) | 0 (0.0%) |
| 18 to 34 Years | 0 (0.0%) | 0 (0.0%) |
| 35 to 64 Years | 0 (0.0%) | 0 (0.0%) |
| 65 to 74 Years | 2 (66.7%) | 0 (0.0%) |
| 75 Years and over | 6 (40.0%) | 0 (0.0%) |
Disability Class: Vision Difficulty
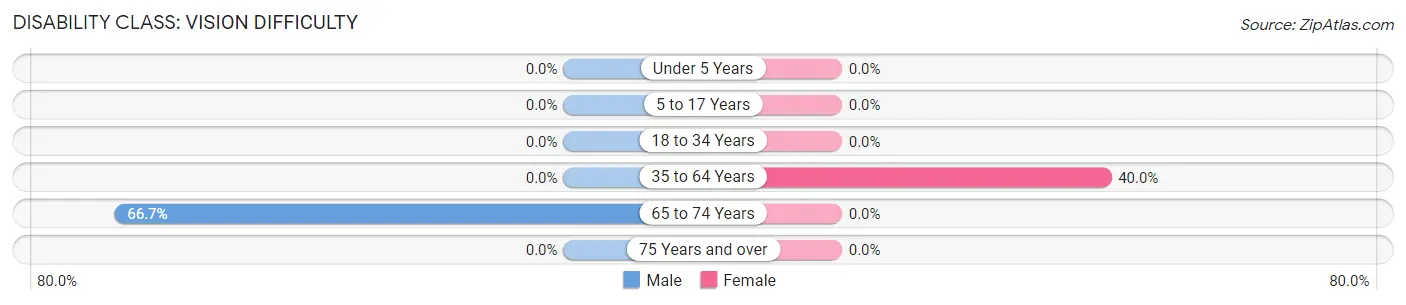
| Age Bracket | Male | Female |
| Under 5 Years | 0 (0.0%) | 0 (0.0%) |
| 5 to 17 Years | 0 (0.0%) | 0 (0.0%) |
| 18 to 34 Years | 0 (0.0%) | 0 (0.0%) |
| 35 to 64 Years | 0 (0.0%) | 8 (40.0%) |
| 65 to 74 Years | 2 (66.7%) | 0 (0.0%) |
| 75 Years and over | 0 (0.0%) | 0 (0.0%) |
Disability Class: Cognitive Difficulty
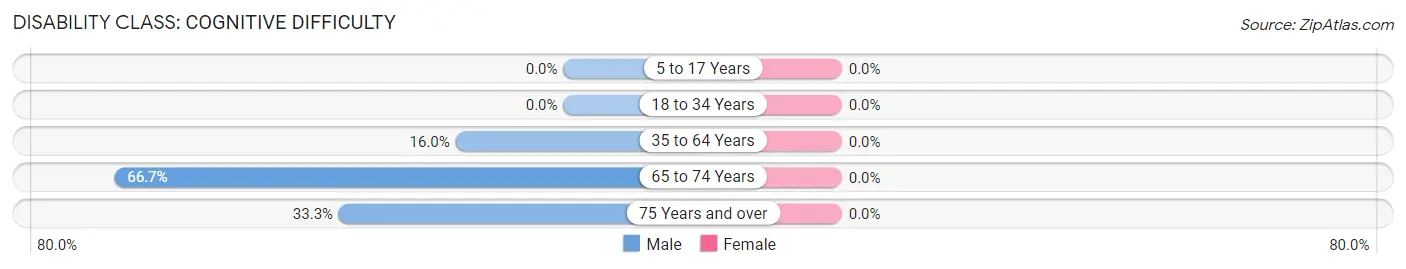
| Age Bracket | Male | Female |
| 5 to 17 Years | 0 (0.0%) | 0 (0.0%) |
| 18 to 34 Years | 0 (0.0%) | 0 (0.0%) |
| 35 to 64 Years | 4 (16.0%) | 0 (0.0%) |
| 65 to 74 Years | 2 (66.7%) | 0 (0.0%) |
| 75 Years and over | 5 (33.3%) | 0 (0.0%) |
Disability Class: Ambulatory Difficulty
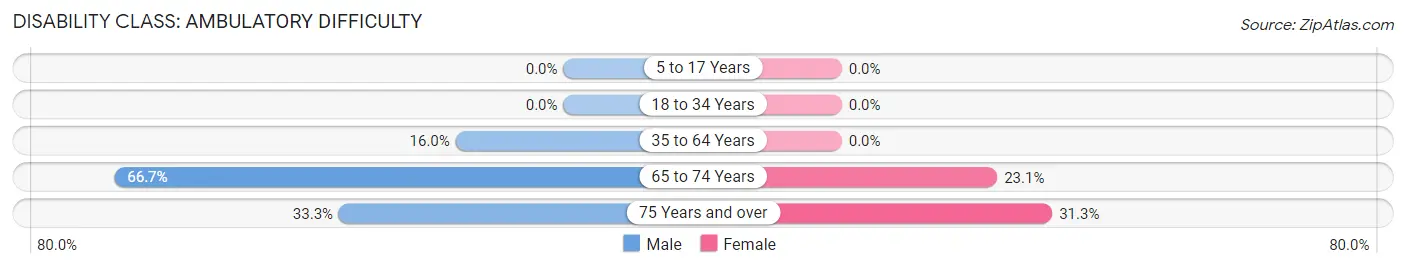
| Age Bracket | Male | Female |
| 5 to 17 Years | 0 (0.0%) | 0 (0.0%) |
| 18 to 34 Years | 0 (0.0%) | 0 (0.0%) |
| 35 to 64 Years | 4 (16.0%) | 0 (0.0%) |
| 65 to 74 Years | 2 (66.7%) | 3 (23.1%) |
| 75 Years and over | 5 (33.3%) | 5 (31.2%) |
Disability Class: Self-Care Difficulty
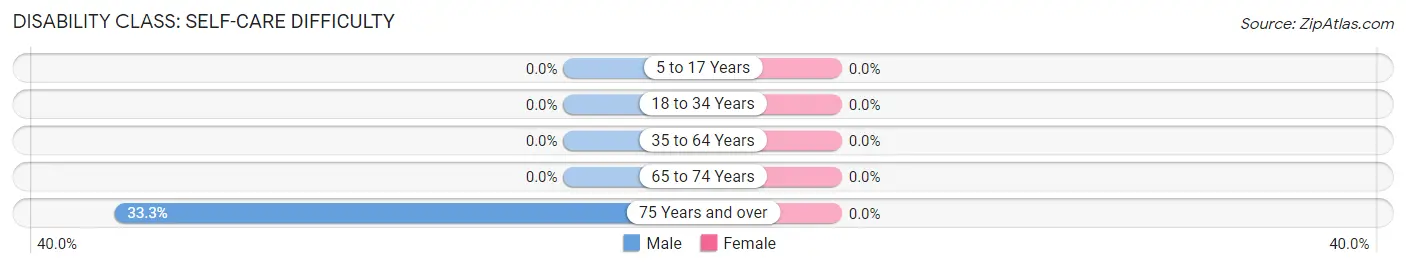
| Age Bracket | Male | Female |
| 5 to 17 Years | 0 (0.0%) | 0 (0.0%) |
| 18 to 34 Years | 0 (0.0%) | 0 (0.0%) |
| 35 to 64 Years | 0 (0.0%) | 0 (0.0%) |
| 65 to 74 Years | 0 (0.0%) | 0 (0.0%) |
| 75 Years and over | 5 (33.3%) | 0 (0.0%) |
Technology Access in Pence
Computing Device Access in Pence
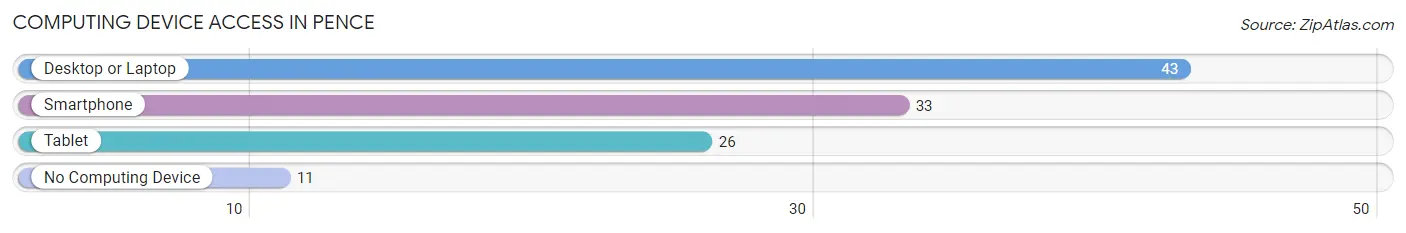
| Device Type | # Households | % Households |
| Desktop or Laptop | 43 | 71.7% |
| Smartphone | 33 | 55.0% |
| Tablet | 26 | 43.3% |
| No Computing Device | 11 | 18.3% |
| Total | 60 | 100.0% |
Internet Access in Pence
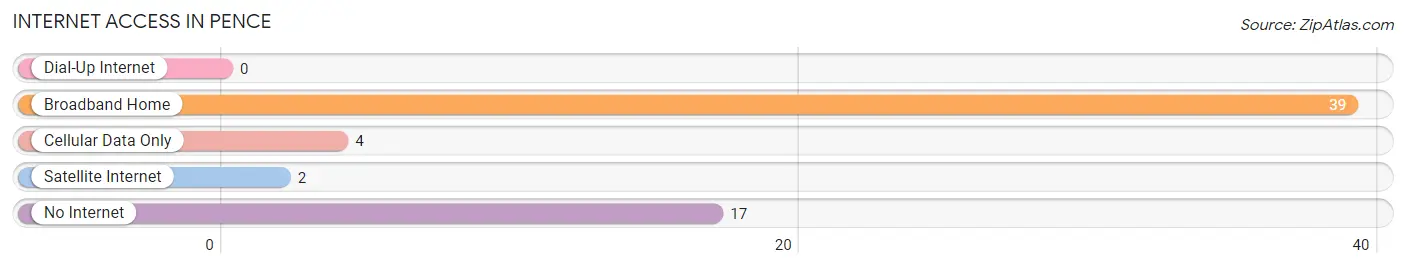
| Internet Type | # Households | % Households |
| Dial-Up Internet | 0 | 0.0% |
| Broadband Home | 39 | 65.0% |
| Cellular Data Only | 4 | 6.7% |
| Satellite Internet | 2 | 3.3% |
| No Internet | 17 | 28.3% |
| Total | 60 | 100.0% |
Pence Summary
Wisconsin is a state located in the Midwestern United States. It is bordered by Minnesota to the west, Iowa to the southwest, Illinois to the south, Lake Michigan to the east, and Michigan to the northeast. Wisconsin is the 23rd largest state by total area and the 20th most populous. The state capital is Madison, and its largest city is Milwaukee.
History
Wisconsin was first inhabited by Native American tribes, including the Menominee, Fox, Ojibwe, Potawatomi, and Ho-Chunk. The first Europeans to explore the area were French fur traders, who arrived in the late 1600s. In 1763, the area became part of the British Empire after the French and Indian War. After the American Revolution, the area was ceded to the United States in the Treaty of Paris.
In 1836, Wisconsin became a territory, and in 1848, it became the 30th state. During the Civil War, Wisconsin was a major supplier of troops and equipment to the Union Army. After the war, the state experienced a period of rapid growth and industrialization. In the late 19th and early 20th centuries, Wisconsin was a major producer of dairy products, lumber, and paper products.
Geography
Wisconsin is located in the north-central United States, and is bordered by Minnesota to the west, Iowa to the southwest, Illinois to the south, Lake Michigan to the east, and Michigan to the northeast. The state has a total area of 65,498 square miles, making it the 23rd largest state in the country.
Wisconsin is divided into five distinct geographic regions: the Central Plain, the Eastern Ridges and Lowlands, the Northern Highlands, the Western Uplands, and the Lake Superior Lowland. The Central Plain is a flat, fertile region in the south and east of the state. The Eastern Ridges and Lowlands are a series of rolling hills and valleys in the east. The Northern Highlands are a rugged region of hills and lakes in the north. The Western Uplands are a hilly region in the west. The Lake Superior Lowland is a flat region in the northwest.
Economy
Wisconsin has a diversified economy, with a mix of manufacturing, agriculture, and services. The state is a major producer of dairy products, and is also a major producer of paper products, machinery, and food products. Tourism is also an important part of the economy, with visitors drawn to the state’s many lakes and outdoor recreational opportunities.
The state’s largest employers are the University of Wisconsin System, the state government, and the health care industry. Other major employers include the manufacturing sector, retail trade, and professional and business services.
Demographics
As of 2019, Wisconsin had an estimated population of 5.8 million. The state is predominantly white, with 84.2% of the population identifying as white. The largest minority groups are African Americans (6.7%), Hispanics (5.7%), and Asians (2.7%).
The median household income in Wisconsin is $59,305, and the median home value is $179,400. The state’s poverty rate is 11.2%, and the unemployment rate is 3.2%.
Conclusion
Wisconsin is a state located in the Midwestern United States. It has a diverse economy, with a mix of manufacturing, agriculture, and services. The state is predominantly white, with the largest minority groups being African Americans, Hispanics, and Asians. The median household income in Wisconsin is $59,305, and the median home value is $179,400. The state’s poverty rate is 11.2%, and the unemployment rate is 3.2%.
Common Questions
What is Per Capita Income in Pence?
Per Capita income in Pence is $28,876.
What is the Median Family Income in Pence?
Median Family Income in Pence is $84,167.
What is the Median Household income in Pence?
Median Household Income in Pence is $43,000.
What is Inequality or Gini Index in Pence?
Inequality or Gini Index in Pence is 0.42.
What is the Total Population of Pence?
Total Population of Pence is 121.
What is the Total Male Population of Pence?
Total Male Population of Pence is 58.
What is the Total Female Population of Pence?
Total Female Population of Pence is 63.
What is the Ratio of Males per 100 Females in Pence?
There are 92.06 Males per 100 Females in Pence.
What is the Ratio of Females per 100 Males in Pence?
There are 108.62 Females per 100 Males in Pence.
What is the Median Population Age in Pence?
Median Population Age in Pence is 58.3 Years.
What is the Average Family Size in Pence
Average Family Size in Pence is 3.0 People.
What is the Average Household Size in Pence
Average Household Size in Pence is 2.0 People.
How Large is the Labor Force in Pence?
There are 35 People in the Labor Forcein in Pence.
What is the Percentage of People in the Labor Force in Pence?
34.7% of People are in the Labor Force in Pence.
What is the Unemployment Rate in Pence?
Unemployment Rate in Pence is 5.7%.