Kendall, WI Map & Demographics
Kendall Map
Kendall Overview
$30,596
PER CAPITA INCOME
$64,107
AVG FAMILY INCOME
$60,069
AVG HOUSEHOLD INCOME
18.3%
WAGE / INCOME GAP [ % ]
81.7¢/ $1
WAGE / INCOME GAP [ $ ]
0.34
INEQUALITY / GINI INDEX
388
TOTAL POPULATION
201
MALE POPULATION
187
FEMALE POPULATION
107.49
MALES / 100 FEMALES
93.03
FEMALES / 100 MALES
40.2
MEDIAN AGE
2.8
AVG FAMILY SIZE
2.3
AVG HOUSEHOLD SIZE
191
LABOR FORCE [ PEOPLE ]
61.0%
PERCENT IN LABOR FORCE
3.1%
UNEMPLOYMENT RATE
Kendall Zip Codes
Kendall Area Codes
Income in Kendall
Income Overview in Kendall
Per Capita Income in Kendall is $30,596, while median incomes of families and households are $64,107 and $60,069 respectively.
| Characteristic | Number | Measure |
| Per Capita Income | 388 | $30,596 |
| Median Family Income | 99 | $64,107 |
| Mean Family Income | 99 | $69,689 |
| Median Household Income | 171 | $60,069 |
| Mean Household Income | 171 | $65,743 |
| Income Deficit | 99 | $0 |
| Wage / Income Gap (%) | 388 | 18.29% |
| Wage / Income Gap ($) | 388 | 81.71¢ per $1 |
| Gini / Inequality Index | 388 | 0.34 |
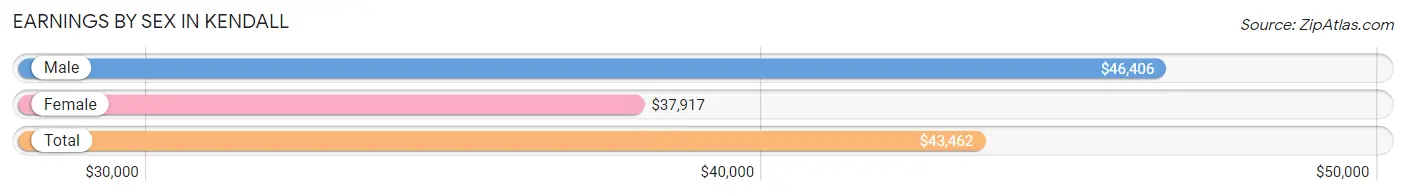
Earnings by Sex in Kendall
Average Earnings in Kendall are $43,462, $46,406 for men and $37,917 for women, a difference of 18.3%.
| Sex | Number | Average Earnings |
| Male | 139 (63.2%) | $46,406 |
| Female | 81 (36.8%) | $37,917 |
| Total | 220 (100.0%) | $43,462 |
Earnings by Sex by Income Bracket in Kendall
The most common earnings brackets in Kendall are $55,000 to $64,999 for men (32 | 23.0%) and $55,000 to $64,999 for women (12 | 14.8%).
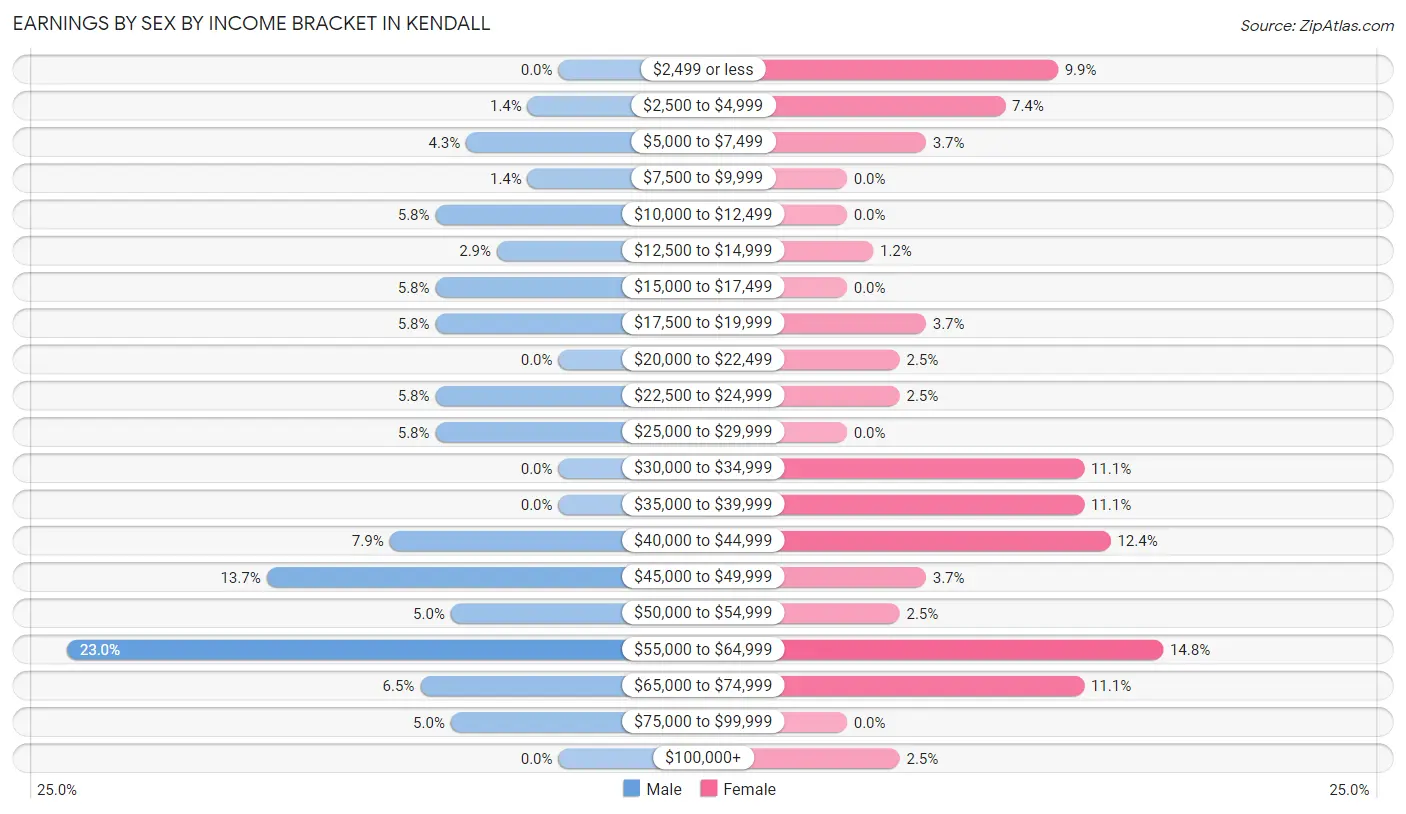
| Income | Male | Female |
| $2,499 or less | 0 (0.0%) | 8 (9.9%) |
| $2,500 to $4,999 | 2 (1.4%) | 6 (7.4%) |
| $5,000 to $7,499 | 6 (4.3%) | 3 (3.7%) |
| $7,500 to $9,999 | 2 (1.4%) | 0 (0.0%) |
| $10,000 to $12,499 | 8 (5.8%) | 0 (0.0%) |
| $12,500 to $14,999 | 4 (2.9%) | 1 (1.2%) |
| $15,000 to $17,499 | 8 (5.8%) | 0 (0.0%) |
| $17,500 to $19,999 | 8 (5.8%) | 3 (3.7%) |
| $20,000 to $22,499 | 0 (0.0%) | 2 (2.5%) |
| $22,500 to $24,999 | 8 (5.8%) | 2 (2.5%) |
| $25,000 to $29,999 | 8 (5.8%) | 0 (0.0%) |
| $30,000 to $34,999 | 0 (0.0%) | 9 (11.1%) |
| $35,000 to $39,999 | 0 (0.0%) | 9 (11.1%) |
| $40,000 to $44,999 | 11 (7.9%) | 10 (12.3%) |
| $45,000 to $49,999 | 19 (13.7%) | 3 (3.7%) |
| $50,000 to $54,999 | 7 (5.0%) | 2 (2.5%) |
| $55,000 to $64,999 | 32 (23.0%) | 12 (14.8%) |
| $65,000 to $74,999 | 9 (6.5%) | 9 (11.1%) |
| $75,000 to $99,999 | 7 (5.0%) | 0 (0.0%) |
| $100,000+ | 0 (0.0%) | 2 (2.5%) |
| Total | 139 (100.0%) | 81 (100.0%) |
Earnings by Sex by Educational Attainment in Kendall
Average earnings in Kendall are $47,727 for men and $41,250 for women, a difference of 13.6%. Men with an educational attainment of college or associate's degree enjoy the highest average annual earnings of $49,167, while those with less than high school education earn the least with $26,250. Women with an educational attainment of bachelor's degree earn the most with the average annual earnings of $57,917, while those with college or associate's degree education have the smallest earnings of $36,875.
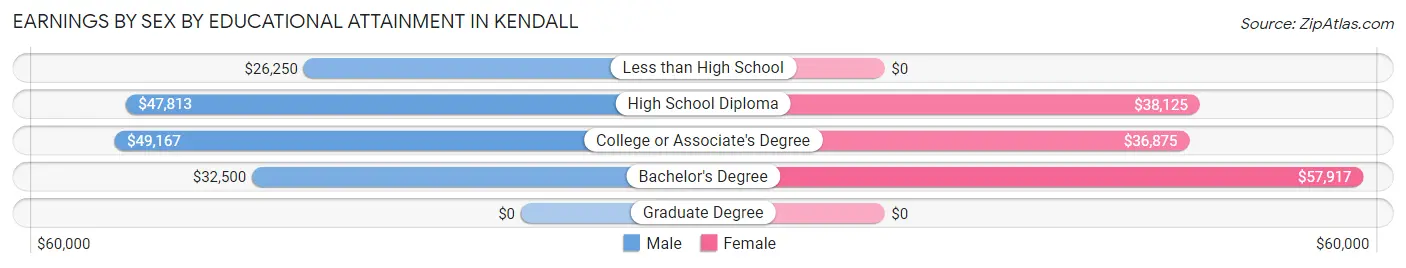
| Educational Attainment | Male Income | Female Income |
| Less than High School | $26,250 | $0 |
| High School Diploma | $47,813 | $38,125 |
| College or Associate's Degree | $49,167 | $36,875 |
| Bachelor's Degree | $32,500 | $57,917 |
| Graduate Degree | - | - |
| Total | $47,727 | $41,250 |
Family Income in Kendall
Family Income Brackets in Kendall
According to the Kendall family income data, there are 33 families falling into the $50,000 to $74,999 income range, which is the most common income bracket and makes up 33.3% of all families.
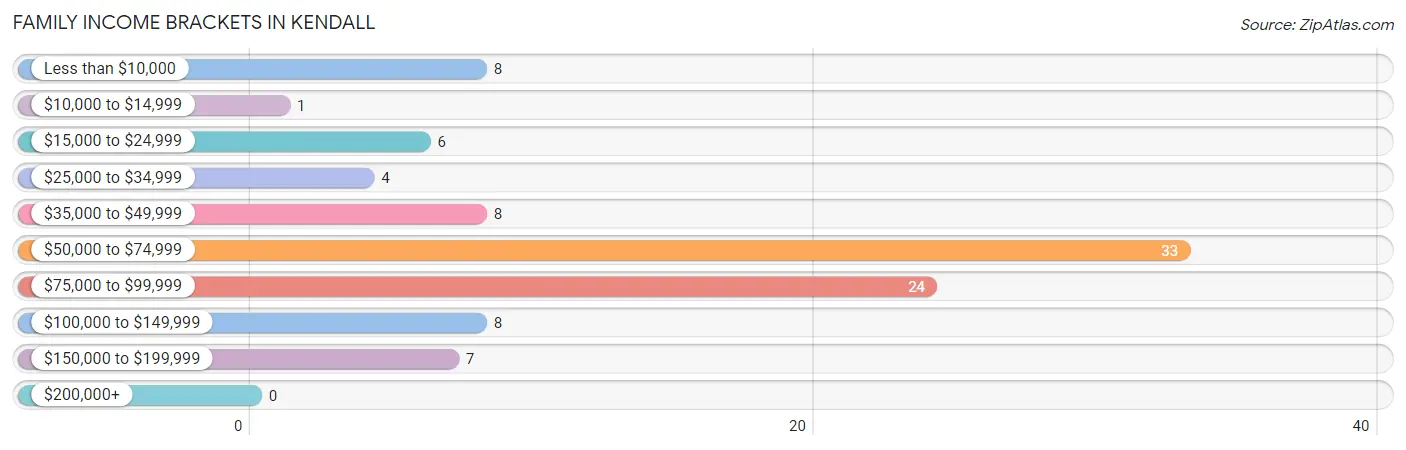
| Income Bracket | # Families | % Families |
| Less than $10,000 | 8 | 8.1% |
| $10,000 to $14,999 | 1 | 1.0% |
| $15,000 to $24,999 | 6 | 6.1% |
| $25,000 to $34,999 | 4 | 4.0% |
| $35,000 to $49,999 | 8 | 8.1% |
| $50,000 to $74,999 | 33 | 33.3% |
| $75,000 to $99,999 | 24 | 24.2% |
| $100,000 to $149,999 | 8 | 8.1% |
| $150,000 to $199,999 | 7 | 7.1% |
| $200,000+ | 0 | 0.0% |
Family Income by Famaliy Size in Kendall
4-person families (13 | 13.1%) account for the highest median family income in Kendall with $65,417 per family, while 2-person families (67 | 67.7%) have the highest median income of $30,104 per family member.
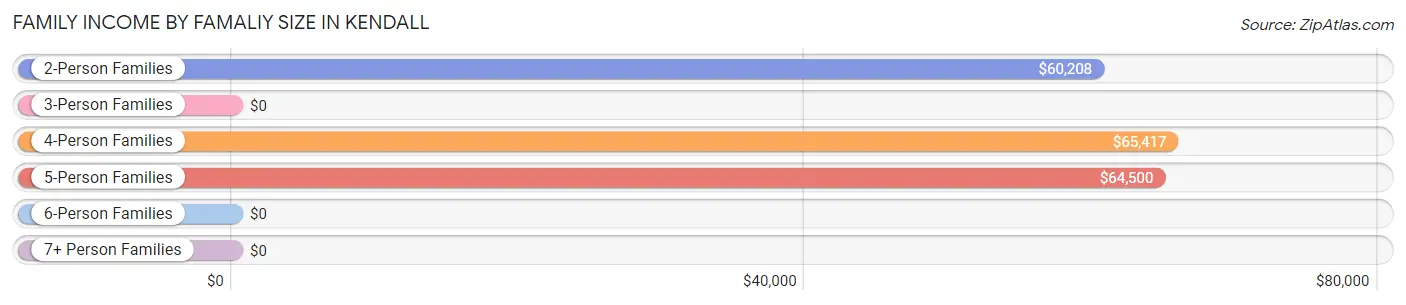
| Income Bracket | # Families | Median Income |
| 2-Person Families | 67 (67.7%) | $60,208 |
| 3-Person Families | 8 (8.1%) | $0 |
| 4-Person Families | 13 (13.1%) | $65,417 |
| 5-Person Families | 8 (8.1%) | $64,500 |
| 6-Person Families | 3 (3.0%) | $0 |
| 7+ Person Families | 0 (0.0%) | $0 |
| Total | 99 (100.0%) | $64,107 |
Family Income by Number of Earners in Kendall
The median family income in Kendall is $64,107, with families comprising 3+ earners (9) having the highest median family income of $136,875, while families with no earners (10) have the lowest median family income of $33,750, accounting for 9.1% and 10.1% of families, respectively.
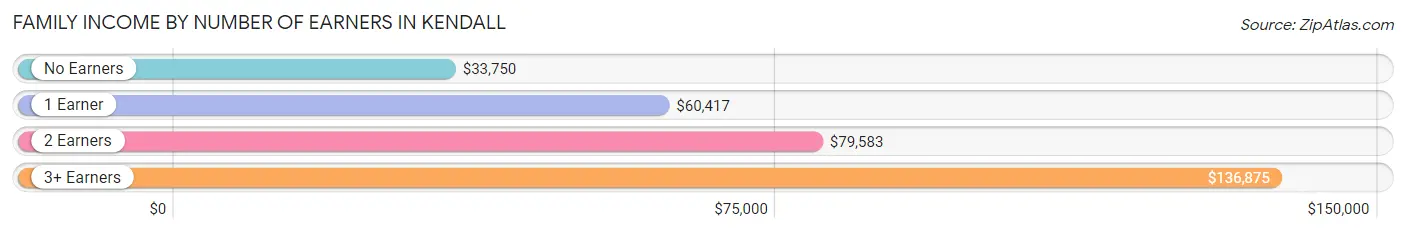
| Number of Earners | # Families | Median Income |
| No Earners | 10 (10.1%) | $33,750 |
| 1 Earner | 45 (45.5%) | $60,417 |
| 2 Earners | 35 (35.3%) | $79,583 |
| 3+ Earners | 9 (9.1%) | $136,875 |
| Total | 99 (100.0%) | $64,107 |
Household Income in Kendall
Household Income Brackets in Kendall
With 46 households falling in the category, the $50,000 to $74,999 income range is the most frequent in Kendall, accounting for 26.9% of all households.
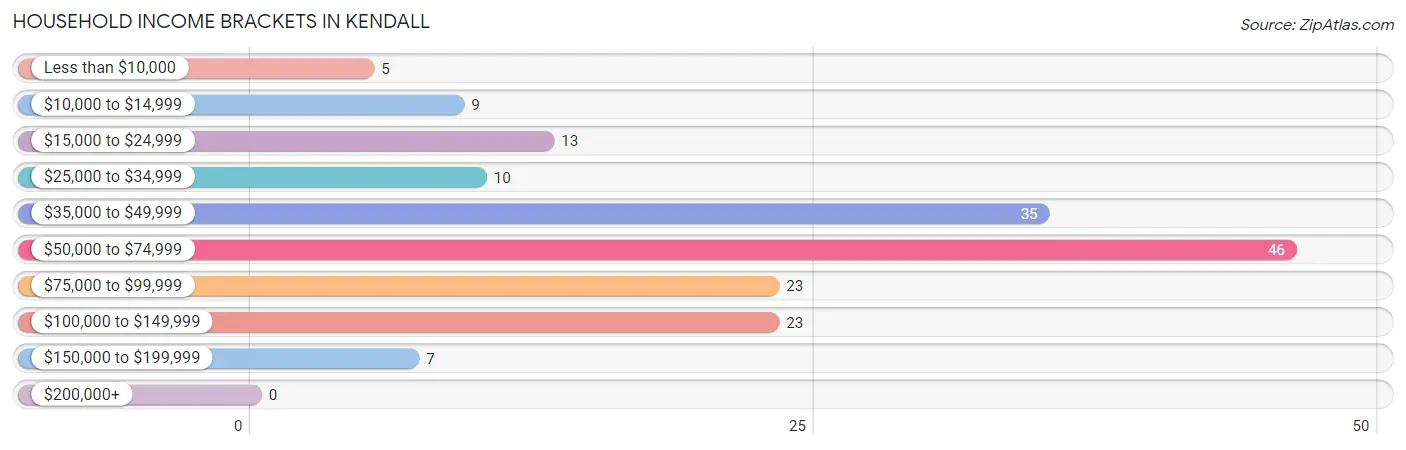
| Income Bracket | # Households | % Households |
| Less than $10,000 | 5 | 2.9% |
| $10,000 to $14,999 | 9 | 5.3% |
| $15,000 to $24,999 | 13 | 7.6% |
| $25,000 to $34,999 | 10 | 5.8% |
| $35,000 to $49,999 | 35 | 20.5% |
| $50,000 to $74,999 | 46 | 26.9% |
| $75,000 to $99,999 | 23 | 13.5% |
| $100,000 to $149,999 | 23 | 13.5% |
| $150,000 to $199,999 | 7 | 4.1% |
| $200,000+ | 0 | 0.0% |
Household Income by Householder Age in Kendall
The median household income in Kendall is $60,069, with the highest median household income of $87,500 found in the 45 to 64 years age bracket for the primary householder. A total of 52 households (30.4%) fall into this category. Meanwhile, the 65+ years age bracket for the primary householder has the lowest median household income of $46,118, with 55 households (32.2%) in this group.
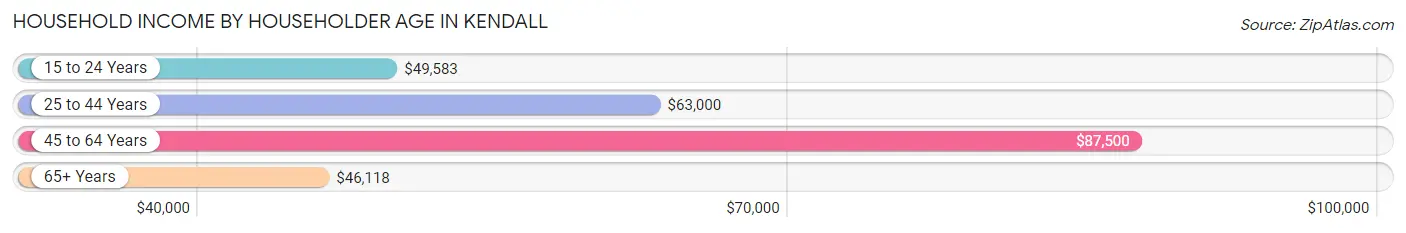
| Income Bracket | # Households | Median Income |
| 15 to 24 Years | 14 (8.2%) | $49,583 |
| 25 to 44 Years | 50 (29.2%) | $63,000 |
| 45 to 64 Years | 52 (30.4%) | $87,500 |
| 65+ Years | 55 (32.2%) | $46,118 |
| Total | 171 (100.0%) | $60,069 |
Poverty in Kendall
Income Below Poverty by Sex and Age in Kendall
With 15.1% poverty level for males and 11.8% for females among the residents of Kendall, under 5 year old males and 18 to 24 year old females are the most vulnerable to poverty, with 9 males (75.0%) and 7 females (58.3%) in their respective age groups living below the poverty level.
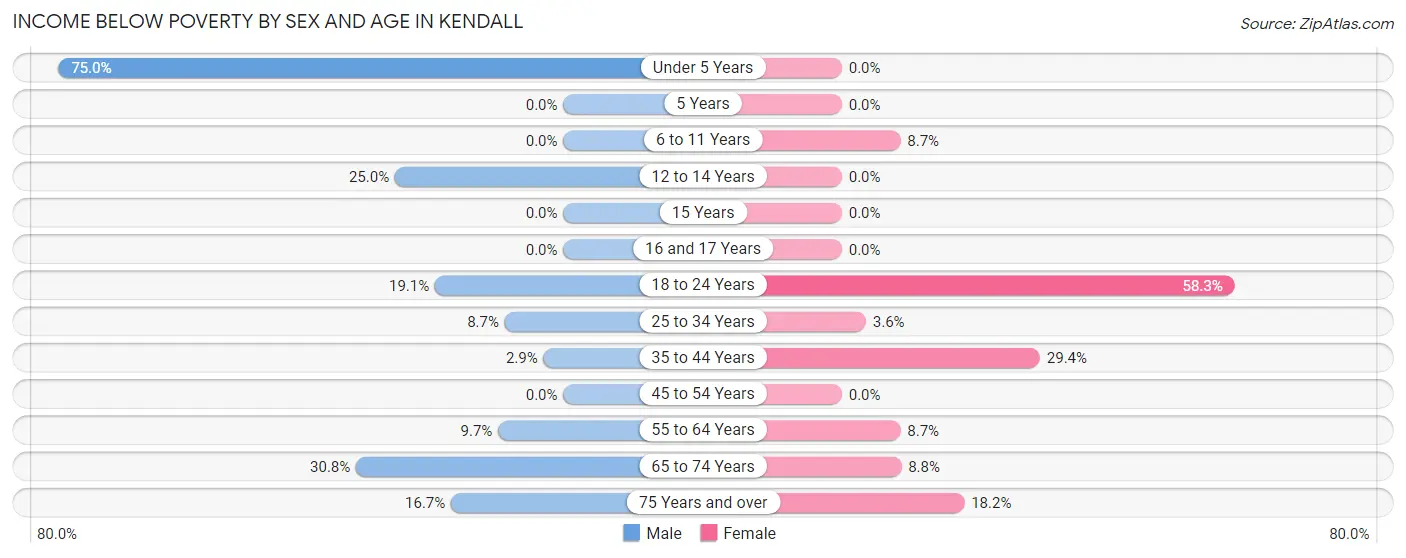
| Age Bracket | Male | Female |
| Under 5 Years | 9 (75.0%) | 0 (0.0%) |
| 5 Years | 0 (0.0%) | 0 (0.0%) |
| 6 to 11 Years | 0 (0.0%) | 2 (8.7%) |
| 12 to 14 Years | 2 (25.0%) | 0 (0.0%) |
| 15 Years | 0 (0.0%) | 0 (0.0%) |
| 16 and 17 Years | 0 (0.0%) | 0 (0.0%) |
| 18 to 24 Years | 4 (19.1%) | 7 (58.3%) |
| 25 to 34 Years | 2 (8.7%) | 1 (3.6%) |
| 35 to 44 Years | 1 (2.9%) | 5 (29.4%) |
| 45 to 54 Years | 0 (0.0%) | 0 (0.0%) |
| 55 to 64 Years | 3 (9.7%) | 2 (8.7%) |
| 65 to 74 Years | 8 (30.8%) | 3 (8.8%) |
| 75 Years and over | 1 (16.7%) | 2 (18.2%) |
| Total | 30 (15.1%) | 22 (11.8%) |
Income Above Poverty by Sex and Age in Kendall
According to the poverty statistics in Kendall, males aged 5 years and females aged under 5 years are the age groups that are most secure financially, with 100.0% of males and 100.0% of females in these age groups living above the poverty line.
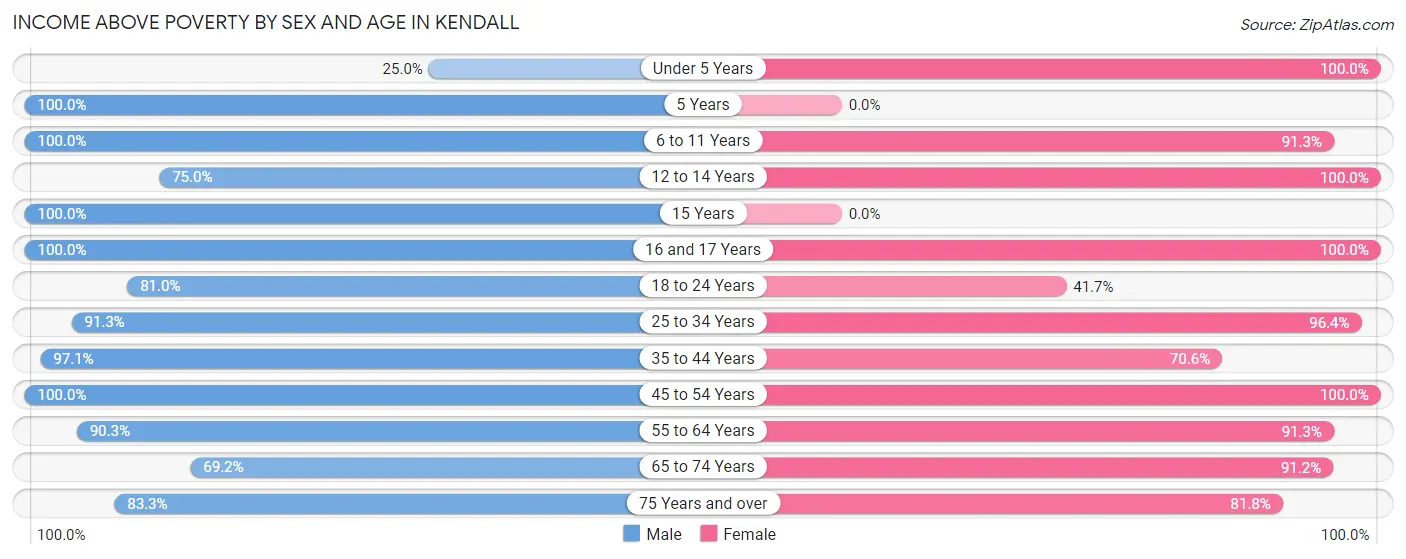
| Age Bracket | Male | Female |
| Under 5 Years | 3 (25.0%) | 11 (100.0%) |
| 5 Years | 4 (100.0%) | 0 (0.0%) |
| 6 to 11 Years | 5 (100.0%) | 21 (91.3%) |
| 12 to 14 Years | 6 (75.0%) | 6 (100.0%) |
| 15 Years | 4 (100.0%) | 0 (0.0%) |
| 16 and 17 Years | 6 (100.0%) | 4 (100.0%) |
| 18 to 24 Years | 17 (80.9%) | 5 (41.7%) |
| 25 to 34 Years | 21 (91.3%) | 27 (96.4%) |
| 35 to 44 Years | 33 (97.1%) | 12 (70.6%) |
| 45 to 54 Years | 19 (100.0%) | 18 (100.0%) |
| 55 to 64 Years | 28 (90.3%) | 21 (91.3%) |
| 65 to 74 Years | 18 (69.2%) | 31 (91.2%) |
| 75 Years and over | 5 (83.3%) | 9 (81.8%) |
| Total | 169 (84.9%) | 165 (88.2%) |
Income Below Poverty Among Married-Couple Families in Kendall
The poverty statistics for married-couple families in Kendall show that 9.8% or 5 of the total 51 families live below the poverty line. Families with 1 or 2 children have the highest poverty rate of 16.7%, comprising of 1 families. On the other hand, families with 3 or 4 children have the lowest poverty rate of 0.0%, which includes 0 families.
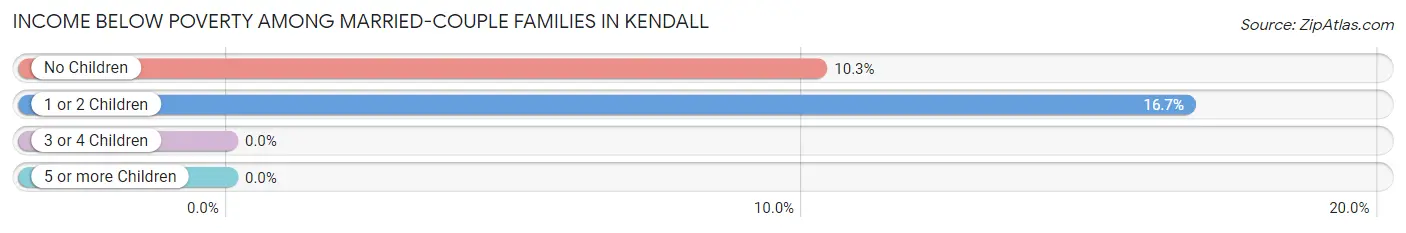
| Children | Above Poverty | Below Poverty |
| No Children | 35 (89.7%) | 4 (10.3%) |
| 1 or 2 Children | 5 (83.3%) | 1 (16.7%) |
| 3 or 4 Children | 6 (100.0%) | 0 (0.0%) |
| 5 or more Children | 0 (0.0%) | 0 (0.0%) |
| Total | 46 (90.2%) | 5 (9.8%) |
Income Below Poverty Among Single-Parent Households in Kendall
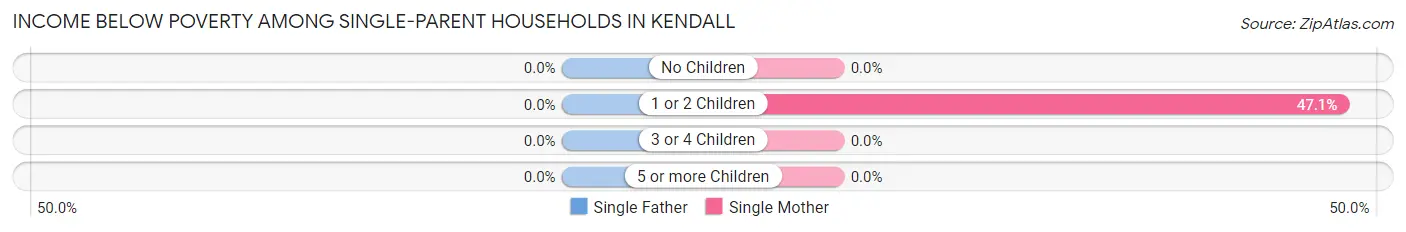
| Children | Single Father | Single Mother |
| No Children | 0 (0.0%) | 0 (0.0%) |
| 1 or 2 Children | 0 (0.0%) | 8 (47.1%) |
| 3 or 4 Children | 0 (0.0%) | 0 (0.0%) |
| 5 or more Children | 0 (0.0%) | 0 (0.0%) |
| Total | 0 (0.0%) | 8 (30.8%) |
Income Below Poverty Among Married-Couple vs Single-Parent Households in Kendall
The poverty data for Kendall shows that 5 of the married-couple family households (9.8%) and 8 of the single-parent households (16.7%) are living below the poverty level. Within the married-couple family households, those with 1 or 2 children have the highest poverty rate, with 1 households (16.7%) falling below the poverty line. Among the single-parent households, those with 1 or 2 children have the highest poverty rate, with 8 household (40.0%) living below poverty.
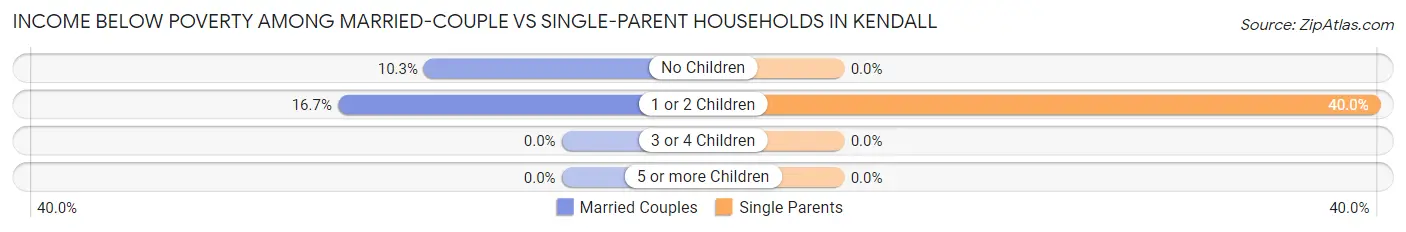
| Children | Married-Couple Families | Single-Parent Households |
| No Children | 4 (10.3%) | 0 (0.0%) |
| 1 or 2 Children | 1 (16.7%) | 8 (40.0%) |
| 3 or 4 Children | 0 (0.0%) | 0 (0.0%) |
| 5 or more Children | 0 (0.0%) | 0 (0.0%) |
| Total | 5 (9.8%) | 8 (16.7%) |
Race in Kendall
The most populous races in Kendall are White / Caucasian (367 | 94.6%), Two or more Races (13 | 3.4%), and Some other Race (5 | 1.3%).
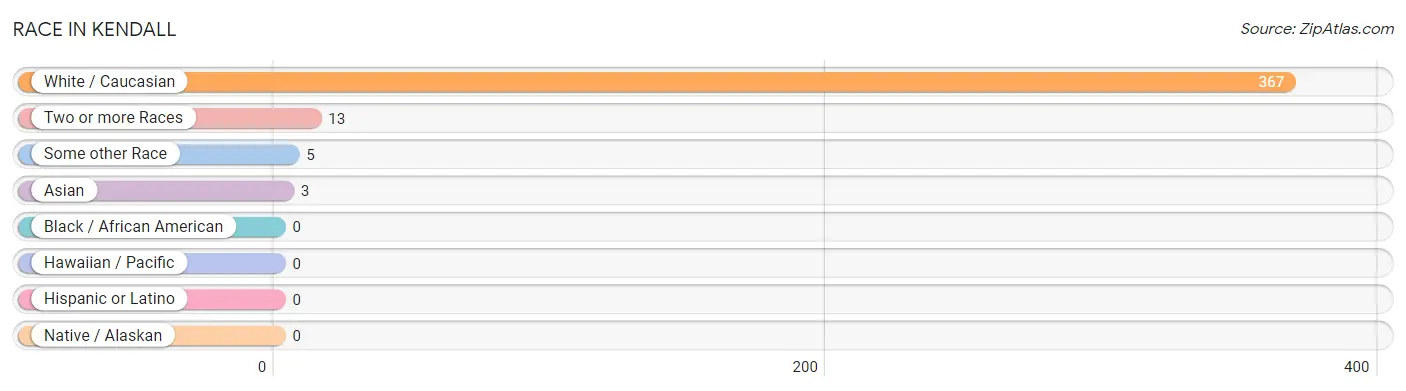
| Race | # Population | % Population |
| Asian | 3 | 0.8% |
| Black / African American | 0 | 0.0% |
| Hawaiian / Pacific | 0 | 0.0% |
| Hispanic or Latino | 0 | 0.0% |
| Native / Alaskan | 0 | 0.0% |
| White / Caucasian | 367 | 94.6% |
| Two or more Races | 13 | 3.4% |
| Some other Race | 5 | 1.3% |
| Total | 388 | 100.0% |
Ancestry in Kendall
The most populous ancestries reported in Kendall are German (173 | 44.6%), Norwegian (90 | 23.2%), Irish (86 | 22.2%), English (34 | 8.8%), and American (21 | 5.4%), together accounting for 104.1% of all Kendall residents.
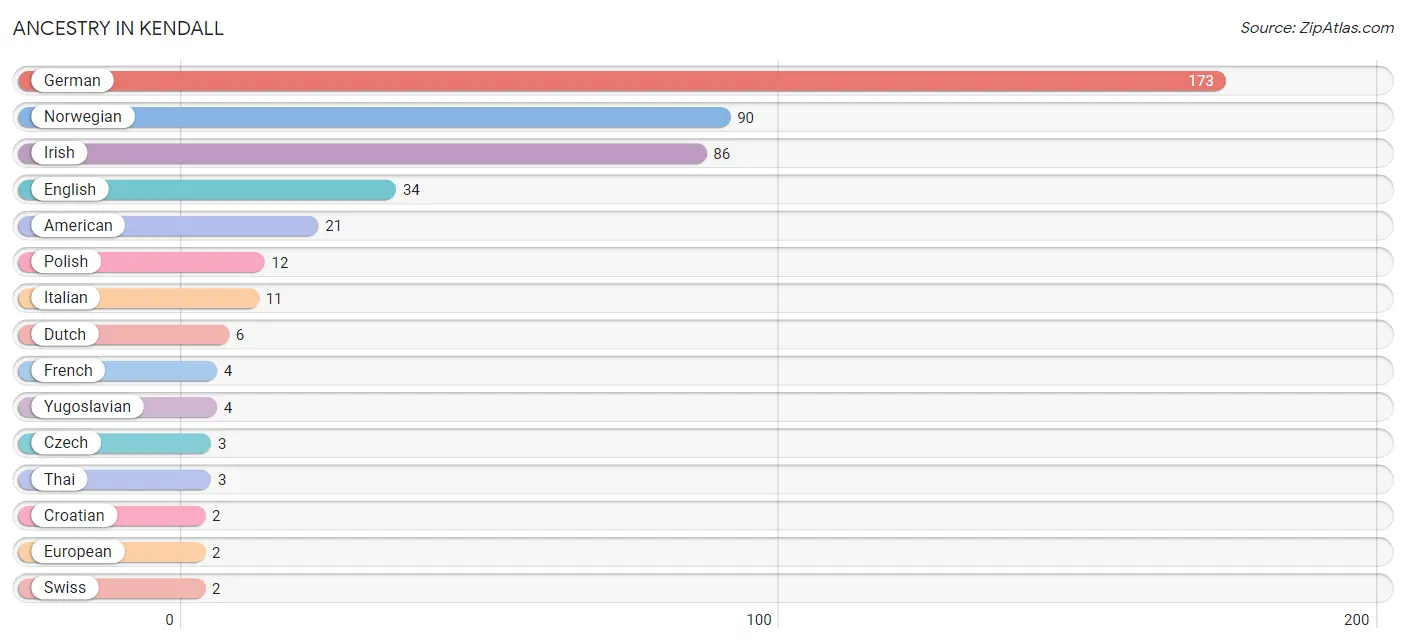
| Ancestry | # Population | % Population |
| American | 21 | 5.4% |
| Croatian | 2 | 0.5% |
| Czech | 3 | 0.8% |
| Danish | 1 | 0.3% |
| Dutch | 6 | 1.5% |
| English | 34 | 8.8% |
| European | 2 | 0.5% |
| French | 4 | 1.0% |
| German | 173 | 44.6% |
| Irish | 86 | 22.2% |
| Italian | 11 | 2.8% |
| Norwegian | 90 | 23.2% |
| Polish | 12 | 3.1% |
| Swiss | 2 | 0.5% |
| Thai | 3 | 0.8% |
| Welsh | 1 | 0.3% |
| Yugoslavian | 4 | 1.0% | View All 17 Rows |
Immigrants in Kendall
The most numerous immigrant groups reported in Kendall came from Asia (3 | 0.8%), India (3 | 0.8%), and South Central Asia (3 | 0.8%), together accounting for 2.3% of all Kendall residents.
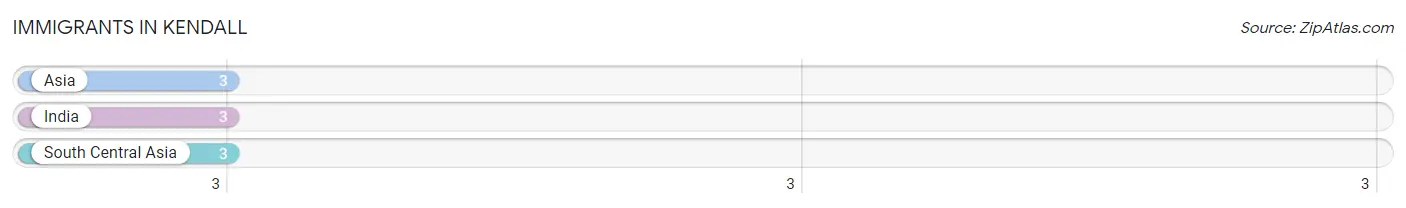
| Immigration Origin | # Population | % Population |
| Asia | 3 | 0.8% |
| India | 3 | 0.8% |
| South Central Asia | 3 | 0.8% | View All 3 Rows |
Sex and Age in Kendall
Sex and Age in Kendall
The most populous age groups in Kendall are 55 to 59 Years (25 | 12.4%) for men and 70 to 74 Years (29 | 15.5%) for women.
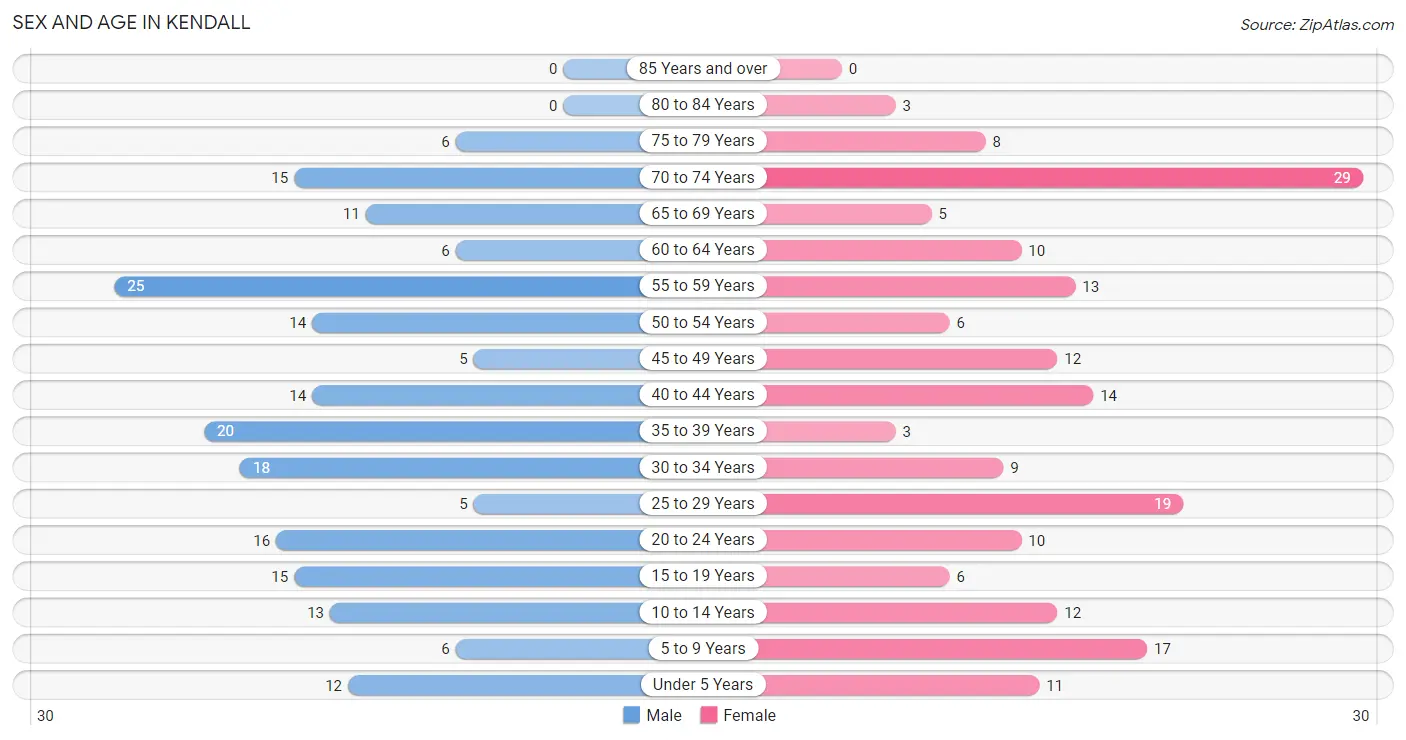
| Age Bracket | Male | Female |
| Under 5 Years | 12 (6.0%) | 11 (5.9%) |
| 5 to 9 Years | 6 (3.0%) | 17 (9.1%) |
| 10 to 14 Years | 13 (6.5%) | 12 (6.4%) |
| 15 to 19 Years | 15 (7.5%) | 6 (3.2%) |
| 20 to 24 Years | 16 (8.0%) | 10 (5.3%) |
| 25 to 29 Years | 5 (2.5%) | 19 (10.2%) |
| 30 to 34 Years | 18 (9.0%) | 9 (4.8%) |
| 35 to 39 Years | 20 (10.0%) | 3 (1.6%) |
| 40 to 44 Years | 14 (7.0%) | 14 (7.5%) |
| 45 to 49 Years | 5 (2.5%) | 12 (6.4%) |
| 50 to 54 Years | 14 (7.0%) | 6 (3.2%) |
| 55 to 59 Years | 25 (12.4%) | 13 (7.0%) |
| 60 to 64 Years | 6 (3.0%) | 10 (5.3%) |
| 65 to 69 Years | 11 (5.5%) | 5 (2.7%) |
| 70 to 74 Years | 15 (7.5%) | 29 (15.5%) |
| 75 to 79 Years | 6 (3.0%) | 8 (4.3%) |
| 80 to 84 Years | 0 (0.0%) | 3 (1.6%) |
| 85 Years and over | 0 (0.0%) | 0 (0.0%) |
| Total | 201 (100.0%) | 187 (100.0%) |
Families and Households in Kendall
Median Family Size in Kendall
The median family size in Kendall is 2.82 persons per family, with married-couple families (51 | 51.5%) accounting for the largest median family size of 3.08 persons per family. On the other hand, single female/mother families (26 | 26.3%) represent the smallest median family size with 2.35 persons per family.
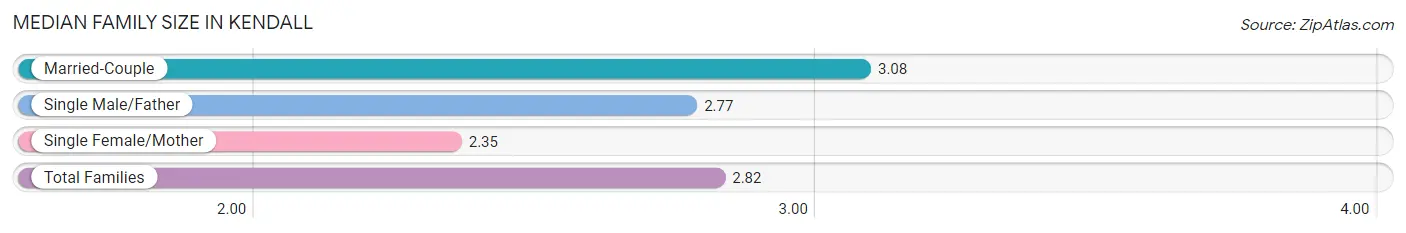
| Family Type | # Families | Family Size |
| Married-Couple | 51 (51.5%) | 3.08 |
| Single Male/Father | 22 (22.2%) | 2.77 |
| Single Female/Mother | 26 (26.3%) | 2.35 |
| Total Families | 99 (100.0%) | 2.82 |
Median Household Size in Kendall
The median household size in Kendall is 2.27 persons per household, with single male/father households (22 | 12.9%) accounting for the largest median household size of 3.09 persons per household. non-family households (72 | 42.1%) represent the smallest median household size with 1.21 persons per household.
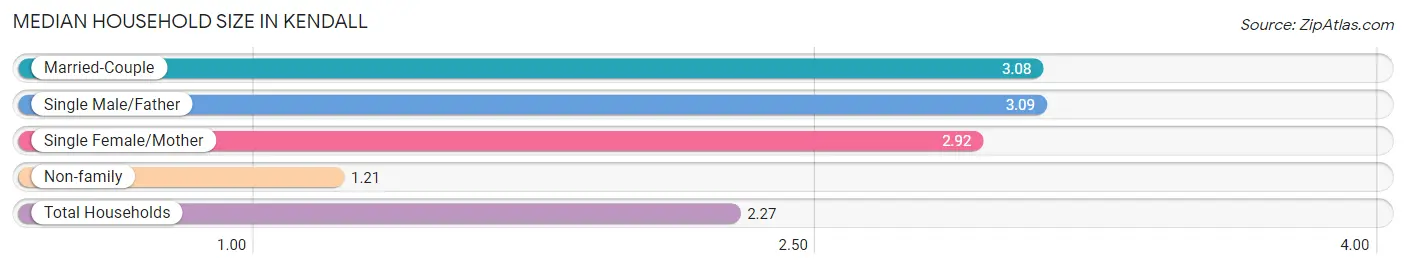
| Household Type | # Households | Household Size |
| Married-Couple | 51 (29.8%) | 3.08 |
| Single Male/Father | 22 (12.9%) | 3.09 |
| Single Female/Mother | 26 (15.2%) | 2.92 |
| Non-family | 72 (42.1%) | 1.21 |
| Total Households | 171 (100.0%) | 2.27 |
Household Size by Marriage Status in Kendall
Out of a total of 171 households in Kendall, 99 (57.9%) are family households, while 72 (42.1%) are nonfamily households. The most numerous type of family households are 2-person households, comprising 46, and the most common type of nonfamily households are 1-person households, comprising 62.
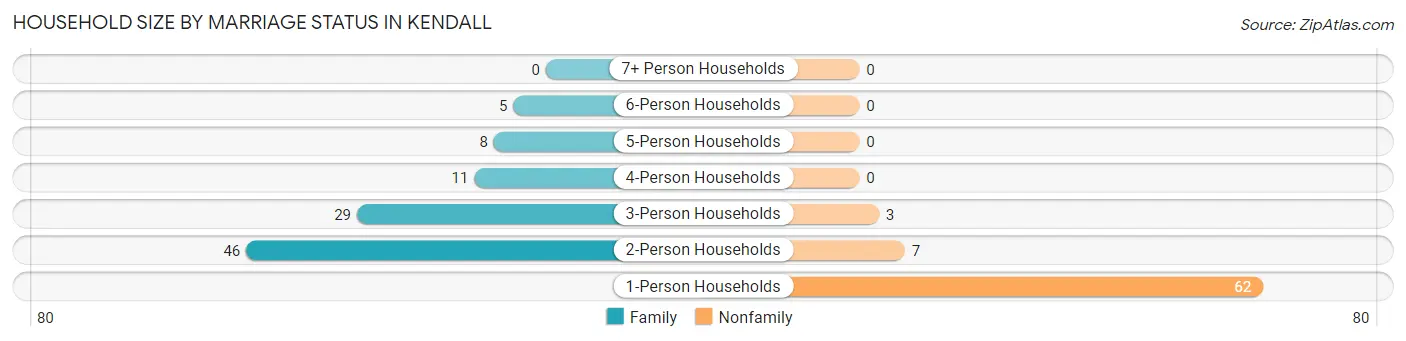
| Household Size | Family Households | Nonfamily Households |
| 1-Person Households | - | 62 (36.3%) |
| 2-Person Households | 46 (26.9%) | 7 (4.1%) |
| 3-Person Households | 29 (17.0%) | 3 (1.8%) |
| 4-Person Households | 11 (6.4%) | 0 (0.0%) |
| 5-Person Households | 8 (4.7%) | 0 (0.0%) |
| 6-Person Households | 5 (2.9%) | 0 (0.0%) |
| 7+ Person Households | 0 (0.0%) | 0 (0.0%) |
| Total | 99 (57.9%) | 72 (42.1%) |
Female Fertility in Kendall
Fertility by Age in Kendall
Average fertility rate in Kendall is 96.0 births per 1,000 women. Women in the age bracket of 20 to 34 years have the highest fertility rate with 184.0 births per 1,000 women. Women in the age bracket of 20 to 34 years acount for 100.0% of all women with births.
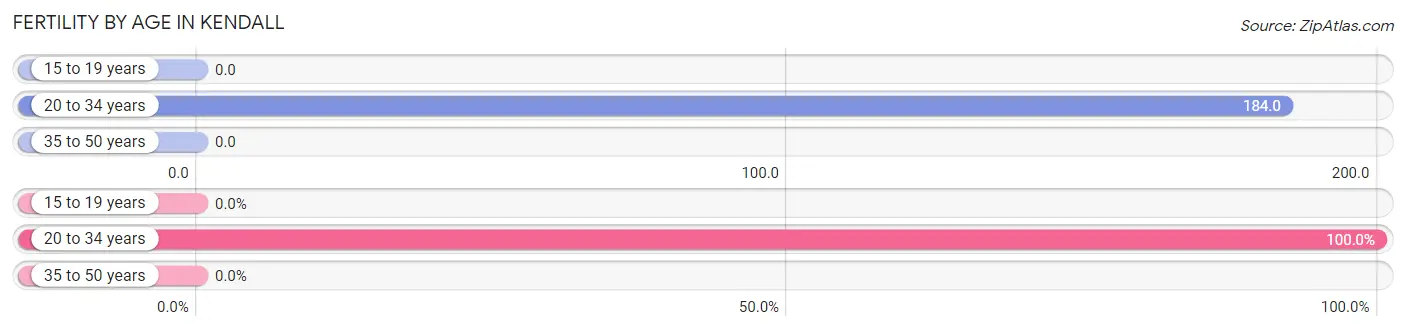
| Age Bracket | Women with Births | Births / 1,000 Women |
| 15 to 19 years | 0 (0.0%) | 0.0 |
| 20 to 34 years | 7 (100.0%) | 184.0 |
| 35 to 50 years | 0 (0.0%) | 0.0 |
| Total | 7 (100.0%) | 96.0 |
Fertility by Age by Marriage Status in Kendall
14.3% of women with births (7) in Kendall are married. The highest percentage of unmarried women with births falls into 20 to 34 years age bracket with 85.7% of them unmarried at the time of birth, while the lowest percentage of unmarried women with births belong to 20 to 34 years age bracket with 85.7% of them unmarried.
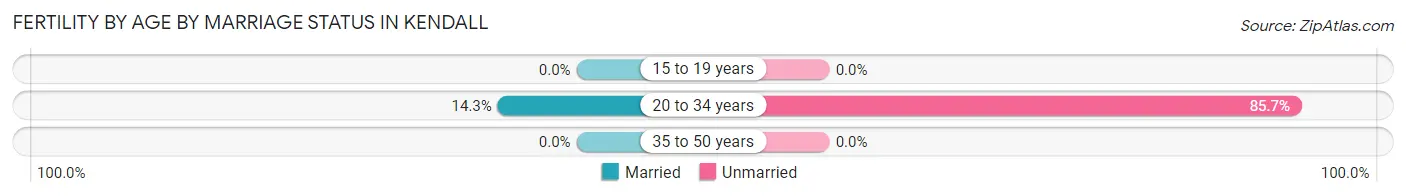
| Age Bracket | Married | Unmarried |
| 15 to 19 years | 0 (0.0%) | 0 (0.0%) |
| 20 to 34 years | 1 (14.3%) | 6 (85.7%) |
| 35 to 50 years | 0 (0.0%) | 0 (0.0%) |
| Total | 1 (14.3%) | 6 (85.7%) |
Fertility by Education in Kendall
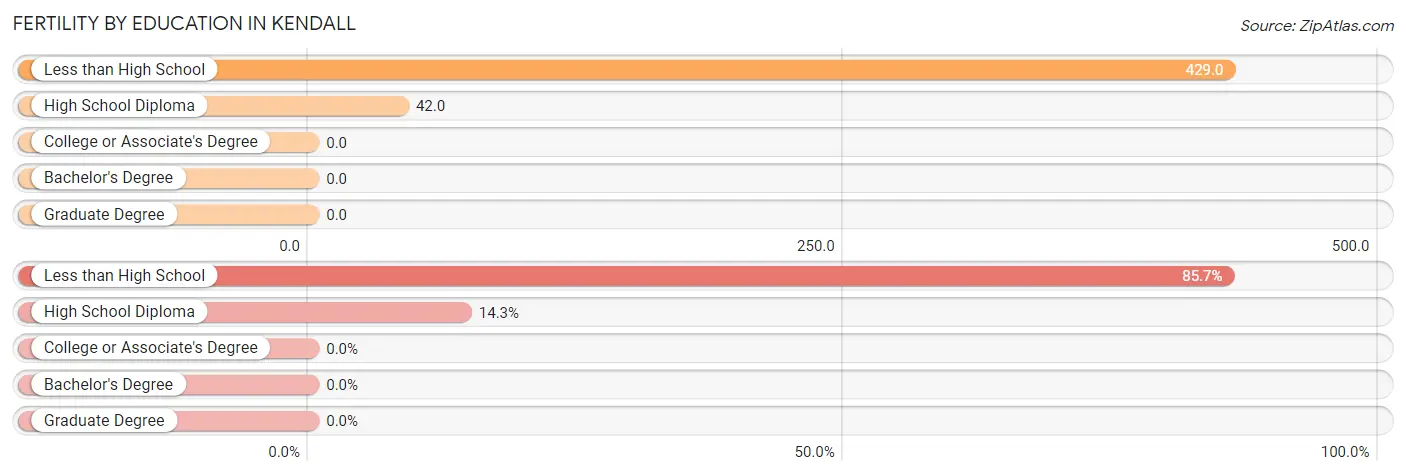
| Educational Attainment | Women with Births | Births / 1,000 Women |
| Less than High School | 6 (85.7%) | 429.0 |
| High School Diploma | 1 (14.3%) | 42.0 |
| College or Associate's Degree | 0 (0.0%) | 0.0 |
| Bachelor's Degree | 0 (0.0%) | 0.0 |
| Graduate Degree | 0 (0.0%) | 0.0 |
| Total | 7 (100.0%) | 96.0 |
Fertility by Education by Marriage Status in Kendall
85.7% of women with births in Kendall are unmarried. Women with the educational attainment of high school diploma are most likely to be married with 100.0% of them married at childbirth, while women with the educational attainment of less than high school are least likely to be married with 100.0% of them unmarried at childbirth.
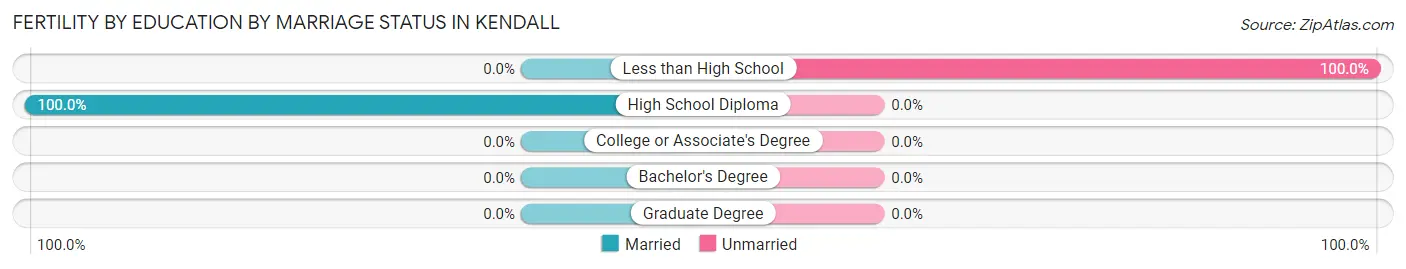
| Educational Attainment | Married | Unmarried |
| Less than High School | 0 (0.0%) | 6 (100.0%) |
| High School Diploma | 1 (100.0%) | 0 (0.0%) |
| College or Associate's Degree | 0 (0.0%) | 0 (0.0%) |
| Bachelor's Degree | 0 (0.0%) | 0 (0.0%) |
| Graduate Degree | 0 (0.0%) | 0 (0.0%) |
| Total | 1 (14.3%) | 6 (85.7%) |
Employment Characteristics in Kendall
Employment by Class of Employer in Kendall
Among the 181 employed individuals in Kendall, private company employees (135 | 74.6%), not-for-profit organizations (14 | 7.7%), and self-employed (incorporated) (9 | 5.0%) make up the most common classes of employment.
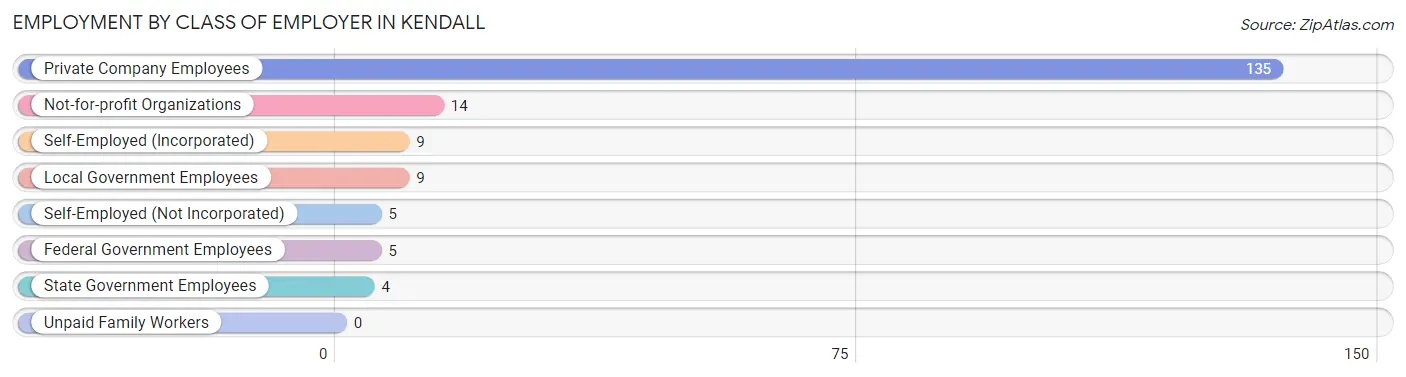
| Employer Class | # Employees | % Employees |
| Private Company Employees | 135 | 74.6% |
| Self-Employed (Incorporated) | 9 | 5.0% |
| Self-Employed (Not Incorporated) | 5 | 2.8% |
| Not-for-profit Organizations | 14 | 7.7% |
| Local Government Employees | 9 | 5.0% |
| State Government Employees | 4 | 2.2% |
| Federal Government Employees | 5 | 2.8% |
| Unpaid Family Workers | 0 | 0.0% |
| Total | 181 | 100.0% |
Employment Status by Age in Kendall
According to the labor force statistics for Kendall, out of the total population over 16 years of age (313), 61.0% or 191 individuals are in the labor force, with 3.1% or 6 of them unemployed. The age group with the highest labor force participation rate is 45 to 54 years, with 97.3% or 36 individuals in the labor force. Within the labor force, the 16 to 19 years age range has the highest percentage of unemployed individuals, with 33.3% or 2 of them being unemployed.
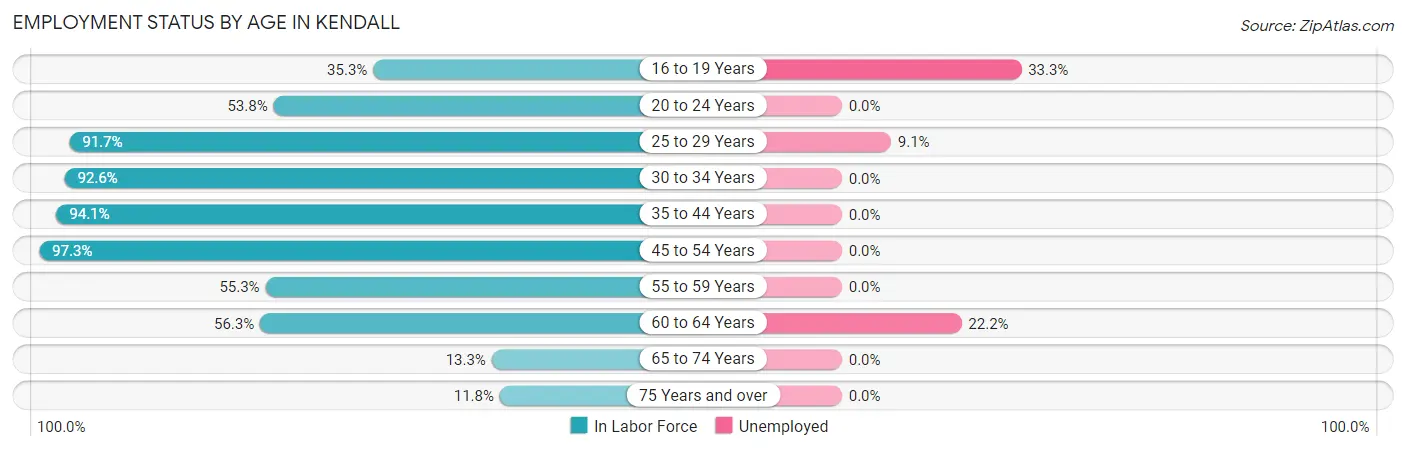
| Age Bracket | In Labor Force | Unemployed |
| 16 to 19 Years | 6 (35.3%) | 2 (33.3%) |
| 20 to 24 Years | 14 (53.8%) | 0 (0.0%) |
| 25 to 29 Years | 22 (91.7%) | 2 (9.1%) |
| 30 to 34 Years | 25 (92.6%) | 0 (0.0%) |
| 35 to 44 Years | 48 (94.1%) | 0 (0.0%) |
| 45 to 54 Years | 36 (97.3%) | 0 (0.0%) |
| 55 to 59 Years | 21 (55.3%) | 0 (0.0%) |
| 60 to 64 Years | 9 (56.3%) | 2 (22.2%) |
| 65 to 74 Years | 8 (13.3%) | 0 (0.0%) |
| 75 Years and over | 2 (11.8%) | 0 (0.0%) |
| Total | 191 (61.0%) | 6 (3.1%) |
Employment Status by Educational Attainment in Kendall
According to labor force statistics for Kendall, 83.4% of individuals (161) out of the total population between 25 and 64 years of age (193) are in the labor force, with 2.5% or 4 of them being unemployed. The group with the highest labor force participation rate are those with the educational attainment of bachelor's degree or higher, with 90.0% or 18 individuals in the labor force. Within the labor force, individuals with bachelor's degree or higher education have the highest percentage of unemployment, with 5.6% or 1 of them being unemployed.
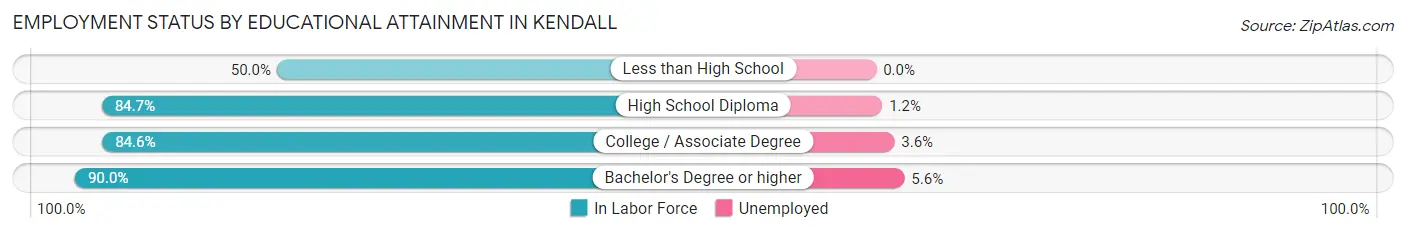
| Educational Attainment | In Labor Force | Unemployed |
| Less than High School | 5 (50.0%) | 0 (0.0%) |
| High School Diploma | 83 (84.7%) | 1 (1.2%) |
| College / Associate Degree | 55 (84.6%) | 2 (3.6%) |
| Bachelor's Degree or higher | 18 (90.0%) | 1 (5.6%) |
| Total | 161 (83.4%) | 5 (2.5%) |
Employment Occupations by Sex in Kendall
Management, Business, Science and Arts Occupations
The most common Management, Business, Science and Arts occupations in Kendall are Management (17 | 9.2%), Community & Social Service (11 | 5.9%), Education, Arts & Media (6 | 3.2%), Computers, Engineering & Science (5 | 2.7%), and Education Instruction & Library (5 | 2.7%).
Management, Business, Science and Arts Occupations by Sex
Within the Management, Business, Science and Arts occupations in Kendall, the most male-oriented occupations are Architecture & Engineering (100.0%), Education, Arts & Media (100.0%), and Management (70.6%), while the most female-oriented occupations are Life, Physical & Social Science (100.0%), Education Instruction & Library (100.0%), and Health Diagnosing & Treating (100.0%).
| Occupation | Male | Female |
| Management | 12 (70.6%) | 5 (29.4%) |
| Business & Financial | 0 (0.0%) | 0 (0.0%) |
| Computers, Engineering & Science | 3 (60.0%) | 2 (40.0%) |
| Computers & Mathematics | 0 (0.0%) | 0 (0.0%) |
| Architecture & Engineering | 3 (100.0%) | 0 (0.0%) |
| Life, Physical & Social Science | 0 (0.0%) | 2 (100.0%) |
| Community & Social Service | 6 (54.5%) | 5 (45.5%) |
| Education, Arts & Media | 6 (100.0%) | 0 (0.0%) |
| Legal Services & Support | 0 (0.0%) | 0 (0.0%) |
| Education Instruction & Library | 0 (0.0%) | 5 (100.0%) |
| Arts, Media & Entertainment | 0 (0.0%) | 0 (0.0%) |
| Health Diagnosing & Treating | 0 (0.0%) | 2 (100.0%) |
| Health Technologists | 0 (0.0%) | 2 (100.0%) |
| Total (Category) | 21 (60.0%) | 14 (40.0%) |
| Total (Overall) | 114 (61.6%) | 71 (38.4%) |
Services Occupations
The most common Services occupations in Kendall are Food Preparation & Serving (5 | 2.7%), Cleaning & Maintenance (5 | 2.7%), Healthcare Support (4 | 2.2%), Security & Protection (4 | 2.2%), and Law Enforcement (4 | 2.2%).
Services Occupations by Sex
Within the Services occupations in Kendall, the most male-oriented occupations are Security & Protection (100.0%), Law Enforcement (100.0%), and Cleaning & Maintenance (80.0%), while the most female-oriented occupations are Healthcare Support (100.0%), Food Preparation & Serving (100.0%), and Personal Care & Service (100.0%).
| Occupation | Male | Female |
| Healthcare Support | 0 (0.0%) | 4 (100.0%) |
| Security & Protection | 4 (100.0%) | 0 (0.0%) |
| Firefighting & Prevention | 0 (0.0%) | 0 (0.0%) |
| Law Enforcement | 4 (100.0%) | 0 (0.0%) |
| Food Preparation & Serving | 0 (0.0%) | 5 (100.0%) |
| Cleaning & Maintenance | 4 (80.0%) | 1 (20.0%) |
| Personal Care & Service | 0 (0.0%) | 3 (100.0%) |
| Total (Category) | 8 (38.1%) | 13 (61.9%) |
| Total (Overall) | 114 (61.6%) | 71 (38.4%) |
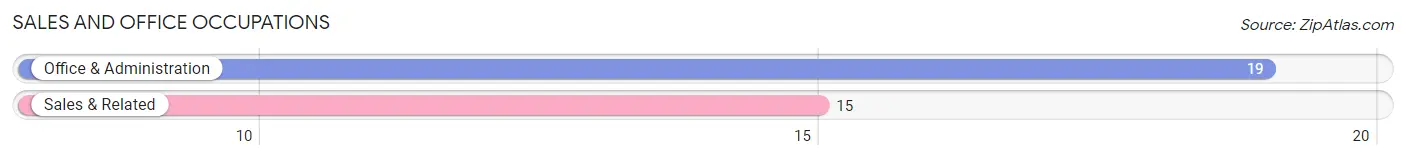
Sales and Office Occupations
The most common Sales and Office occupations in Kendall are Office & Administration (19 | 10.3%), and Sales & Related (15 | 8.1%).
Sales and Office Occupations by Sex
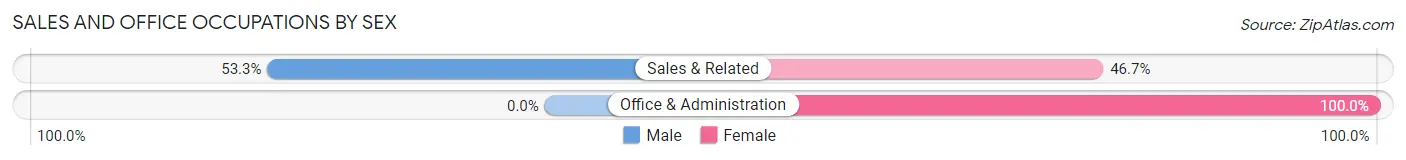
| Occupation | Male | Female |
| Sales & Related | 8 (53.3%) | 7 (46.7%) |
| Office & Administration | 0 (0.0%) | 19 (100.0%) |
| Total (Category) | 8 (23.5%) | 26 (76.5%) |
| Total (Overall) | 114 (61.6%) | 71 (38.4%) |
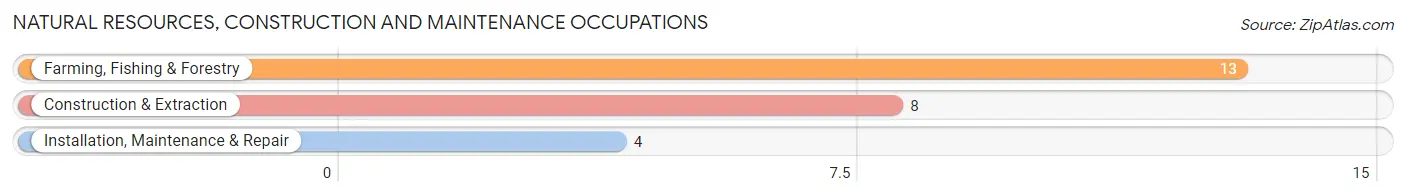
Natural Resources, Construction and Maintenance Occupations
The most common Natural Resources, Construction and Maintenance occupations in Kendall are Farming, Fishing & Forestry (13 | 7.0%), Construction & Extraction (8 | 4.3%), and Installation, Maintenance & Repair (4 | 2.2%).
Natural Resources, Construction and Maintenance Occupations by Sex
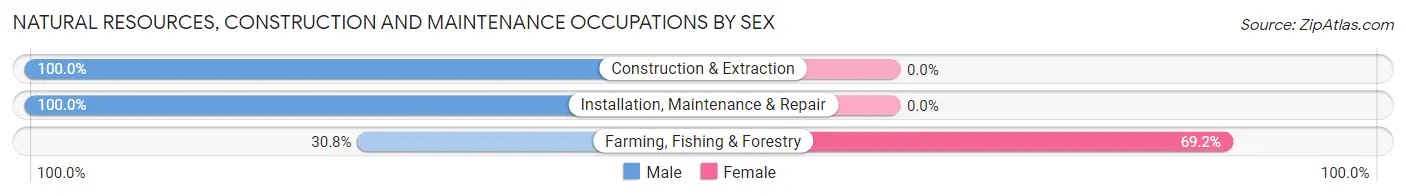
| Occupation | Male | Female |
| Farming, Fishing & Forestry | 4 (30.8%) | 9 (69.2%) |
| Construction & Extraction | 8 (100.0%) | 0 (0.0%) |
| Installation, Maintenance & Repair | 4 (100.0%) | 0 (0.0%) |
| Total (Category) | 16 (64.0%) | 9 (36.0%) |
| Total (Overall) | 114 (61.6%) | 71 (38.4%) |
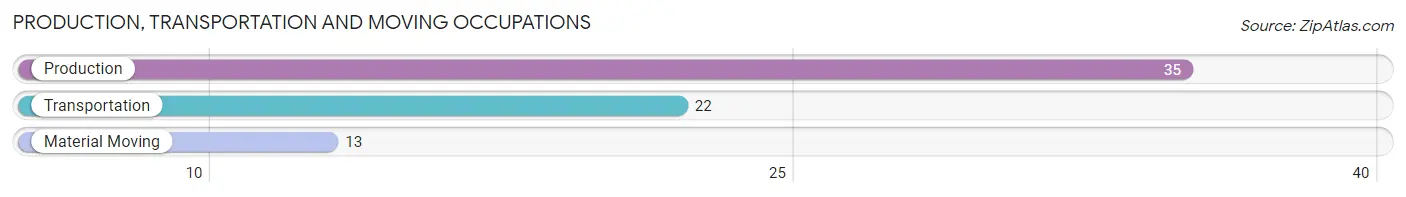
Production, Transportation and Moving Occupations
The most common Production, Transportation and Moving occupations in Kendall are Production (35 | 18.9%), Transportation (22 | 11.9%), and Material Moving (13 | 7.0%).
Production, Transportation and Moving Occupations by Sex
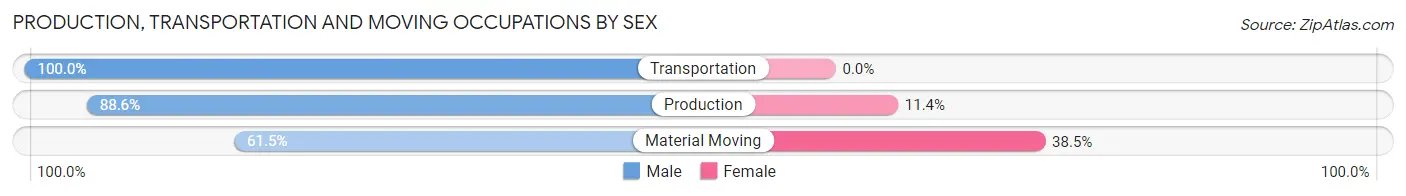
| Occupation | Male | Female |
| Production | 31 (88.6%) | 4 (11.4%) |
| Transportation | 22 (100.0%) | 0 (0.0%) |
| Material Moving | 8 (61.5%) | 5 (38.5%) |
| Total (Category) | 61 (87.1%) | 9 (12.9%) |
| Total (Overall) | 114 (61.6%) | 71 (38.4%) |
Employment Industries by Sex in Kendall
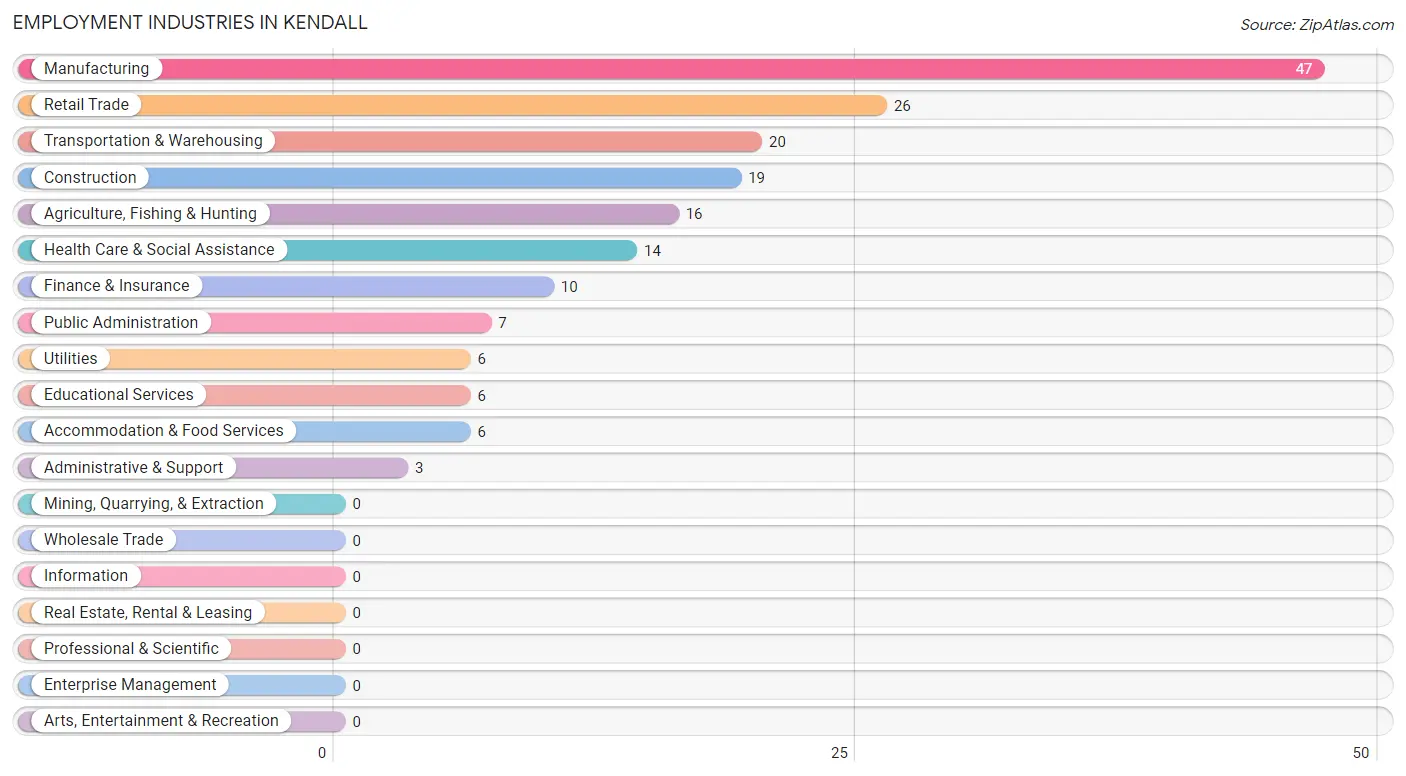
Employment Industries in Kendall
The major employment industries in Kendall include Manufacturing (47 | 25.4%), Retail Trade (26 | 14.1%), Transportation & Warehousing (20 | 10.8%), Construction (19 | 10.3%), and Agriculture, Fishing & Hunting (16 | 8.6%).
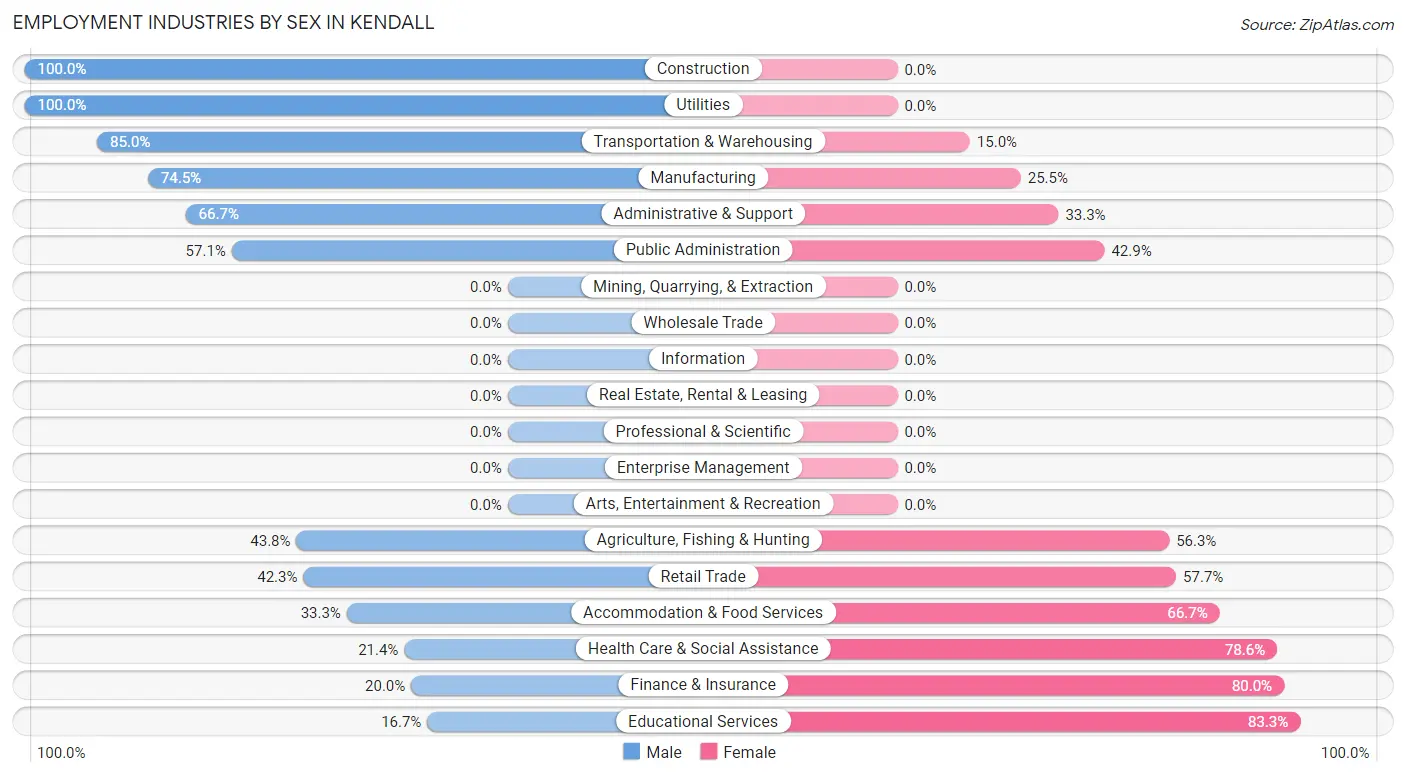
Employment Industries by Sex in Kendall
The Kendall industries that see more men than women are Construction (100.0%), Utilities (100.0%), and Transportation & Warehousing (85.0%), whereas the industries that tend to have a higher number of women are Educational Services (83.3%), Finance & Insurance (80.0%), and Health Care & Social Assistance (78.6%).
| Industry | Male | Female |
| Agriculture, Fishing & Hunting | 7 (43.8%) | 9 (56.2%) |
| Mining, Quarrying, & Extraction | 0 (0.0%) | 0 (0.0%) |
| Construction | 19 (100.0%) | 0 (0.0%) |
| Manufacturing | 35 (74.5%) | 12 (25.5%) |
| Wholesale Trade | 0 (0.0%) | 0 (0.0%) |
| Retail Trade | 11 (42.3%) | 15 (57.7%) |
| Transportation & Warehousing | 17 (85.0%) | 3 (15.0%) |
| Utilities | 6 (100.0%) | 0 (0.0%) |
| Information | 0 (0.0%) | 0 (0.0%) |
| Finance & Insurance | 2 (20.0%) | 8 (80.0%) |
| Real Estate, Rental & Leasing | 0 (0.0%) | 0 (0.0%) |
| Professional & Scientific | 0 (0.0%) | 0 (0.0%) |
| Enterprise Management | 0 (0.0%) | 0 (0.0%) |
| Administrative & Support | 2 (66.7%) | 1 (33.3%) |
| Educational Services | 1 (16.7%) | 5 (83.3%) |
| Health Care & Social Assistance | 3 (21.4%) | 11 (78.6%) |
| Arts, Entertainment & Recreation | 0 (0.0%) | 0 (0.0%) |
| Accommodation & Food Services | 2 (33.3%) | 4 (66.7%) |
| Public Administration | 4 (57.1%) | 3 (42.9%) |
| Total | 114 (61.6%) | 71 (38.4%) |
Education in Kendall
School Enrollment in Kendall
The most common levels of schooling among the 82 students in Kendall are elementary school (24 | 29.3%), middle school (20 | 24.4%), and high school (15 | 18.3%).
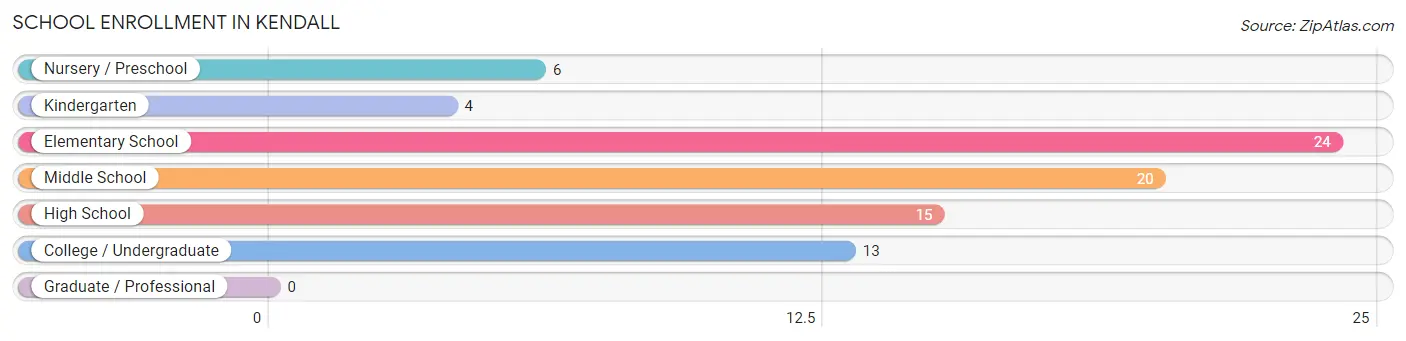
| School Level | # Students | % Students |
| Nursery / Preschool | 6 | 7.3% |
| Kindergarten | 4 | 4.9% |
| Elementary School | 24 | 29.3% |
| Middle School | 20 | 24.4% |
| High School | 15 | 18.3% |
| College / Undergraduate | 13 | 15.9% |
| Graduate / Professional | 0 | 0.0% |
| Total | 82 | 100.0% |
School Enrollment by Age by Funding Source in Kendall
Out of a total of 82 students who are enrolled in schools in Kendall, 5 (6.1%) attend a private institution, while the remaining 77 (93.9%) are enrolled in public schools. The age group of 3 to 4 year olds has the highest likelihood of being enrolled in private schools, with 3 (50.0% in the age bracket) enrolled. Conversely, the age group of 5 to 9 year old has the lowest likelihood of being enrolled in a private school, with 23 (100.0% in the age bracket) attending a public institution.
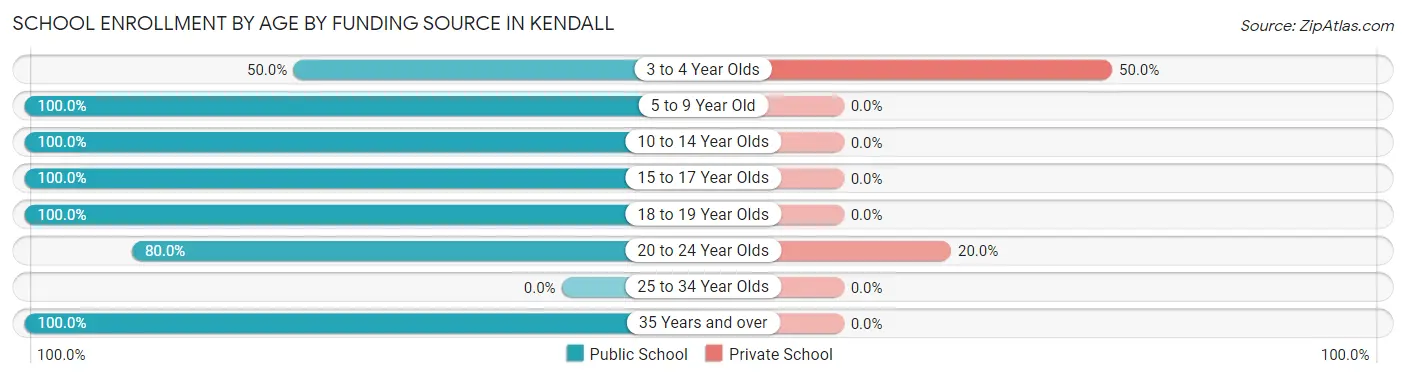
| Age Bracket | Public School | Private School |
| 3 to 4 Year Olds | 3 (50.0%) | 3 (50.0%) |
| 5 to 9 Year Old | 23 (100.0%) | 0 (0.0%) |
| 10 to 14 Year Olds | 25 (100.0%) | 0 (0.0%) |
| 15 to 17 Year Olds | 14 (100.0%) | 0 (0.0%) |
| 18 to 19 Year Olds | 1 (100.0%) | 0 (0.0%) |
| 20 to 24 Year Olds | 8 (80.0%) | 2 (20.0%) |
| 25 to 34 Year Olds | 0 (0.0%) | 0 (0.0%) |
| 35 Years and over | 3 (100.0%) | 0 (0.0%) |
| Total | 77 (93.9%) | 5 (6.1%) |
Educational Attainment by Field of Study in Kendall
Education (29 | 63.0%), science & technology (6 | 13.0%), arts & humanities (5 | 10.9%), bio, nature & agricultural (2 | 4.3%), and visual & performing arts (2 | 4.3%) are the most common fields of study among 46 individuals in Kendall who have obtained a bachelor's degree or higher.
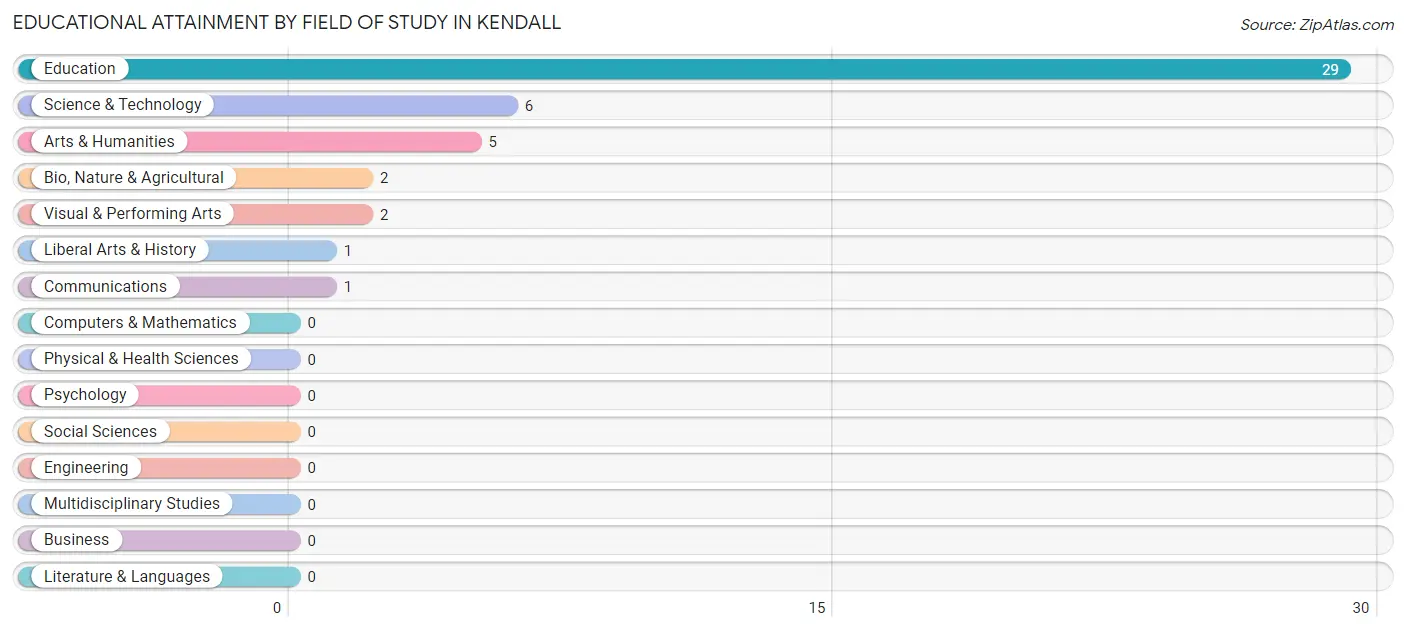
| Field of Study | # Graduates | % Graduates |
| Computers & Mathematics | 0 | 0.0% |
| Bio, Nature & Agricultural | 2 | 4.3% |
| Physical & Health Sciences | 0 | 0.0% |
| Psychology | 0 | 0.0% |
| Social Sciences | 0 | 0.0% |
| Engineering | 0 | 0.0% |
| Multidisciplinary Studies | 0 | 0.0% |
| Science & Technology | 6 | 13.0% |
| Business | 0 | 0.0% |
| Education | 29 | 63.0% |
| Literature & Languages | 0 | 0.0% |
| Liberal Arts & History | 1 | 2.2% |
| Visual & Performing Arts | 2 | 4.3% |
| Communications | 1 | 2.2% |
| Arts & Humanities | 5 | 10.9% |
| Total | 46 | 100.0% |
Transportation & Commute in Kendall
Vehicle Availability by Sex in Kendall
The most prevalent vehicle ownership categories in Kendall are males with 3 vehicles (28, accounting for 25.5%) and females with 3 vehicles (20, making up 39.4%).
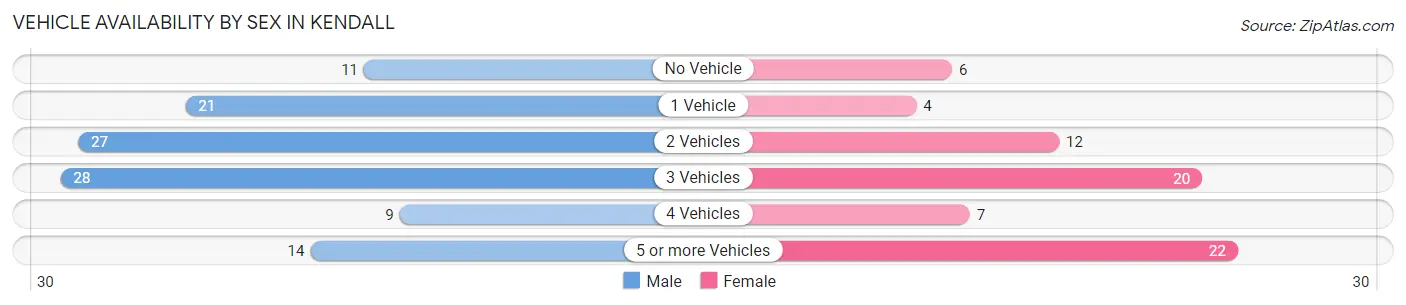
| Vehicles Available | Male | Female |
| No Vehicle | 11 (10.0%) | 6 (8.5%) |
| 1 Vehicle | 21 (19.1%) | 4 (5.6%) |
| 2 Vehicles | 27 (24.5%) | 12 (16.9%) |
| 3 Vehicles | 28 (25.5%) | 20 (28.2%) |
| 4 Vehicles | 9 (8.2%) | 7 (9.9%) |
| 5 or more Vehicles | 14 (12.7%) | 22 (31.0%) |
| Total | 110 (100.0%) | 71 (100.0%) |
Commute Time in Kendall
The most frequently occuring commute durations in Kendall are 20 to 24 minutes (36 commuters, 20.8%), less than 5 minutes (27 commuters, 15.6%), and 45 to 59 minutes (24 commuters, 13.9%).
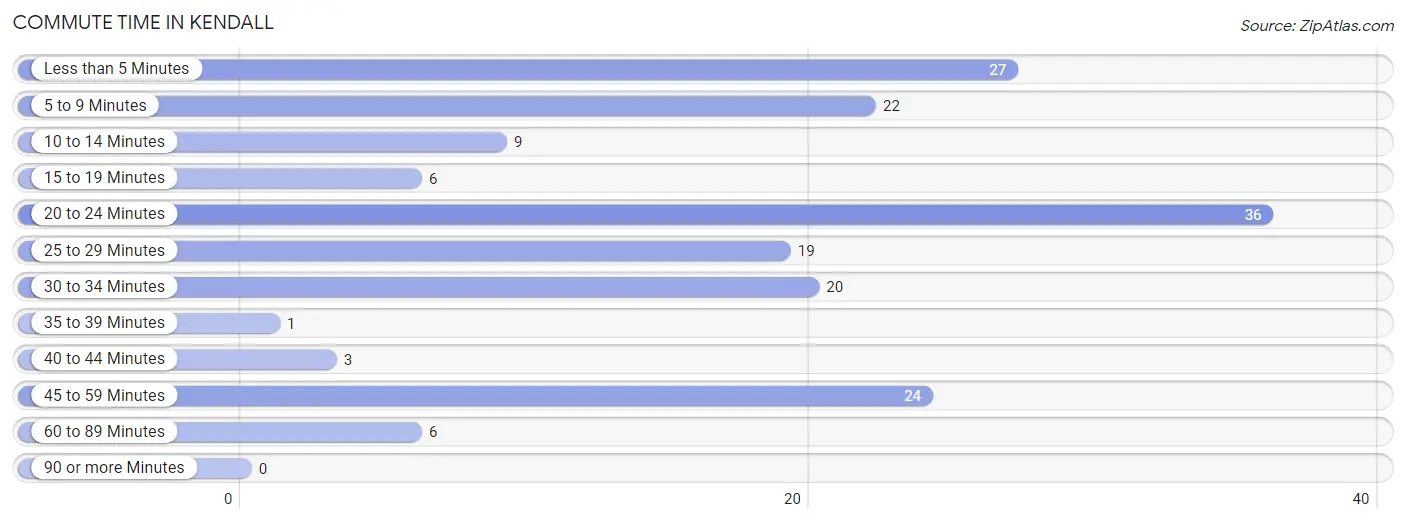
| Commute Time | # Commuters | % Commuters |
| Less than 5 Minutes | 27 | 15.6% |
| 5 to 9 Minutes | 22 | 12.7% |
| 10 to 14 Minutes | 9 | 5.2% |
| 15 to 19 Minutes | 6 | 3.5% |
| 20 to 24 Minutes | 36 | 20.8% |
| 25 to 29 Minutes | 19 | 11.0% |
| 30 to 34 Minutes | 20 | 11.6% |
| 35 to 39 Minutes | 1 | 0.6% |
| 40 to 44 Minutes | 3 | 1.7% |
| 45 to 59 Minutes | 24 | 13.9% |
| 60 to 89 Minutes | 6 | 3.5% |
| 90 or more Minutes | 0 | 0.0% |
Commute Time by Sex in Kendall
The most common commute times in Kendall are 45 to 59 minutes (23 commuters, 21.3%) for males and 20 to 24 minutes (22 commuters, 33.9%) for females.
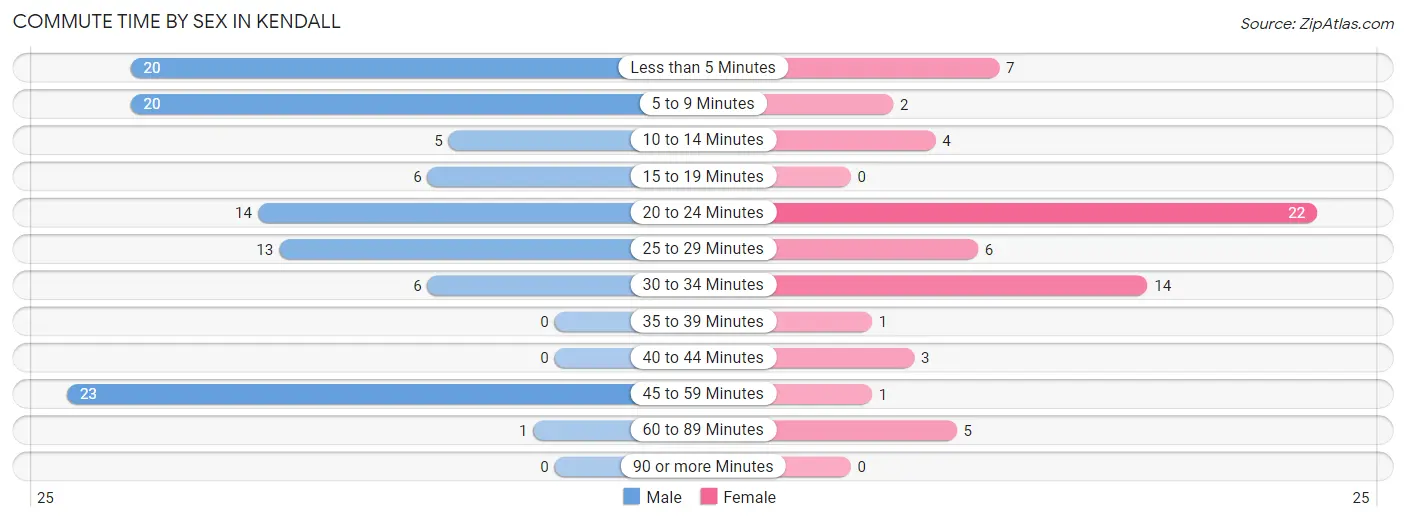
| Commute Time | Male | Female |
| Less than 5 Minutes | 20 (18.5%) | 7 (10.8%) |
| 5 to 9 Minutes | 20 (18.5%) | 2 (3.1%) |
| 10 to 14 Minutes | 5 (4.6%) | 4 (6.1%) |
| 15 to 19 Minutes | 6 (5.6%) | 0 (0.0%) |
| 20 to 24 Minutes | 14 (13.0%) | 22 (33.9%) |
| 25 to 29 Minutes | 13 (12.0%) | 6 (9.2%) |
| 30 to 34 Minutes | 6 (5.6%) | 14 (21.5%) |
| 35 to 39 Minutes | 0 (0.0%) | 1 (1.5%) |
| 40 to 44 Minutes | 0 (0.0%) | 3 (4.6%) |
| 45 to 59 Minutes | 23 (21.3%) | 1 (1.5%) |
| 60 to 89 Minutes | 1 (0.9%) | 5 (7.7%) |
| 90 or more Minutes | 0 (0.0%) | 0 (0.0%) |
Time of Departure to Work by Sex in Kendall
The most frequent times of departure to work in Kendall are 12:00 AM to 4:59 AM (22, 20.4%) for males and 12:00 PM to 3:59 PM (15, 23.1%) for females.
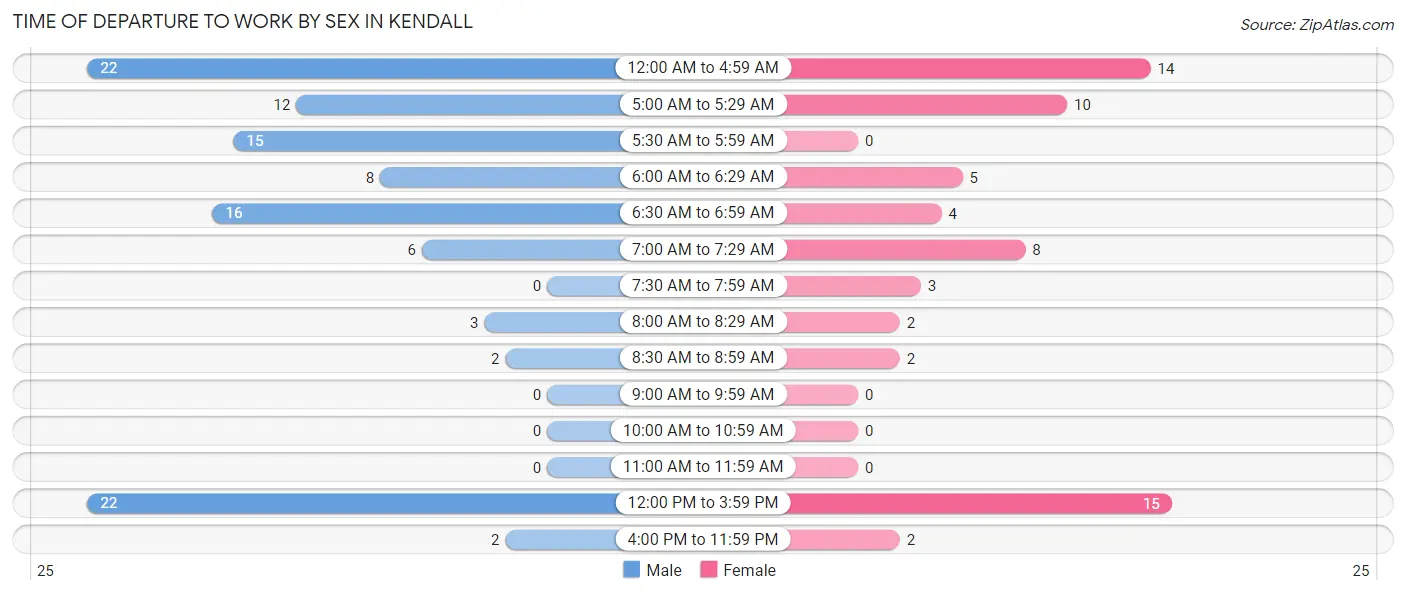
| Time of Departure | Male | Female |
| 12:00 AM to 4:59 AM | 22 (20.4%) | 14 (21.5%) |
| 5:00 AM to 5:29 AM | 12 (11.1%) | 10 (15.4%) |
| 5:30 AM to 5:59 AM | 15 (13.9%) | 0 (0.0%) |
| 6:00 AM to 6:29 AM | 8 (7.4%) | 5 (7.7%) |
| 6:30 AM to 6:59 AM | 16 (14.8%) | 4 (6.1%) |
| 7:00 AM to 7:29 AM | 6 (5.6%) | 8 (12.3%) |
| 7:30 AM to 7:59 AM | 0 (0.0%) | 3 (4.6%) |
| 8:00 AM to 8:29 AM | 3 (2.8%) | 2 (3.1%) |
| 8:30 AM to 8:59 AM | 2 (1.8%) | 2 (3.1%) |
| 9:00 AM to 9:59 AM | 0 (0.0%) | 0 (0.0%) |
| 10:00 AM to 10:59 AM | 0 (0.0%) | 0 (0.0%) |
| 11:00 AM to 11:59 AM | 0 (0.0%) | 0 (0.0%) |
| 12:00 PM to 3:59 PM | 22 (20.4%) | 15 (23.1%) |
| 4:00 PM to 11:59 PM | 2 (1.8%) | 2 (3.1%) |
| Total | 108 (100.0%) | 65 (100.0%) |
Housing Occupancy in Kendall
Occupancy by Ownership in Kendall
Of the total 171 dwellings in Kendall, owner-occupied units account for 124 (72.5%), while renter-occupied units make up 47 (27.5%).
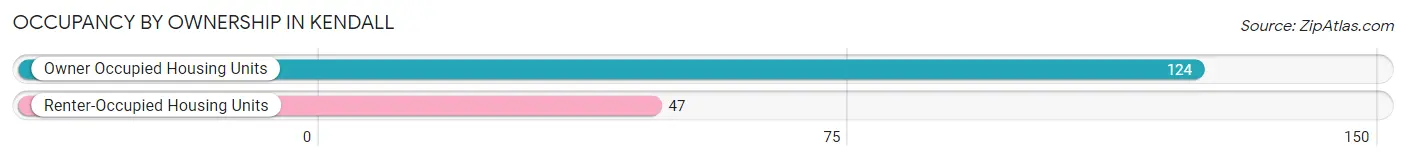
| Occupancy | # Housing Units | % Housing Units |
| Owner Occupied Housing Units | 124 | 72.5% |
| Renter-Occupied Housing Units | 47 | 27.5% |
| Total Occupied Housing Units | 171 | 100.0% |
Occupancy by Household Size in Kendall
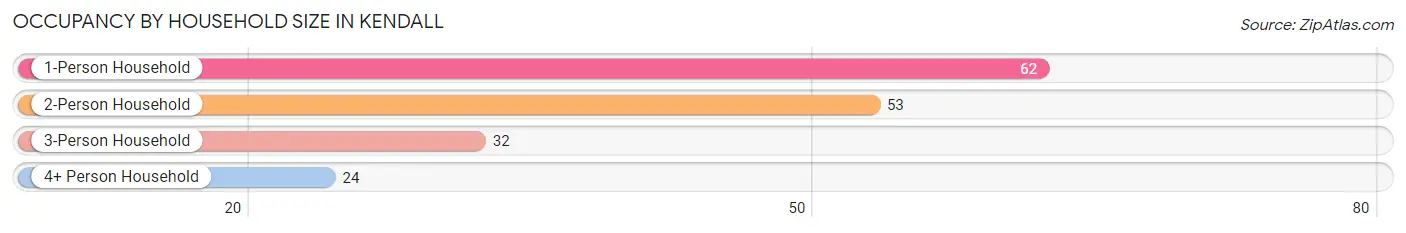
| Household Size | # Housing Units | % Housing Units |
| 1-Person Household | 62 | 36.3% |
| 2-Person Household | 53 | 31.0% |
| 3-Person Household | 32 | 18.7% |
| 4+ Person Household | 24 | 14.0% |
| Total Housing Units | 171 | 100.0% |
Occupancy by Ownership by Household Size in Kendall
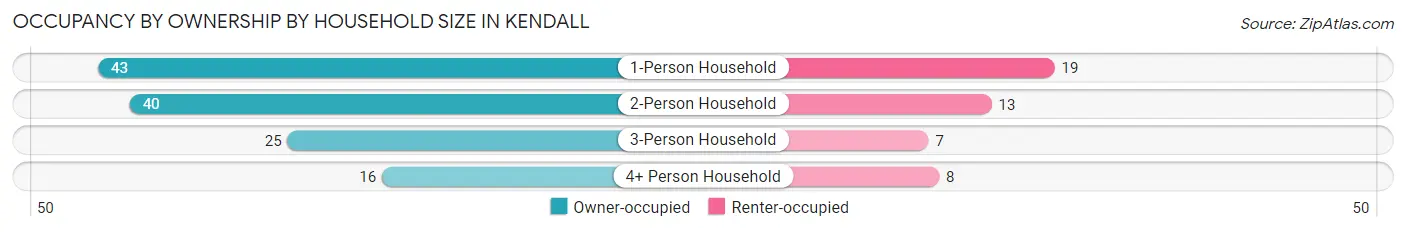
| Household Size | Owner-occupied | Renter-occupied |
| 1-Person Household | 43 (69.4%) | 19 (30.6%) |
| 2-Person Household | 40 (75.5%) | 13 (24.5%) |
| 3-Person Household | 25 (78.1%) | 7 (21.9%) |
| 4+ Person Household | 16 (66.7%) | 8 (33.3%) |
| Total Housing Units | 124 (72.5%) | 47 (27.5%) |
Occupancy by Educational Attainment in Kendall
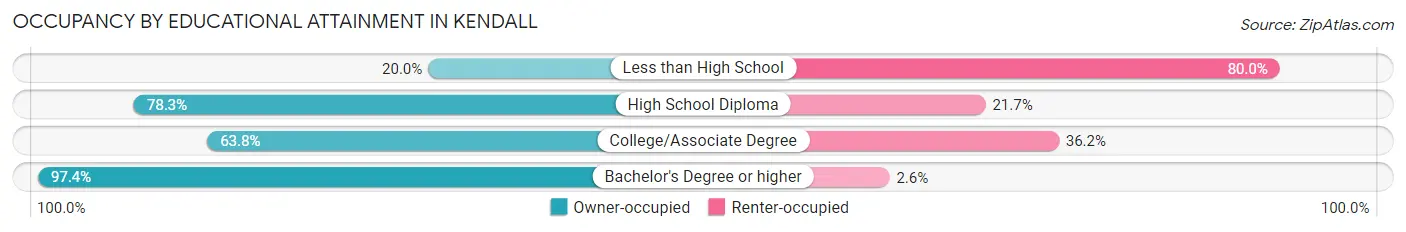
| Household Size | Owner-occupied | Renter-occupied |
| Less than High School | 3 (20.0%) | 12 (80.0%) |
| High School Diploma | 47 (78.3%) | 13 (21.7%) |
| College/Associate Degree | 37 (63.8%) | 21 (36.2%) |
| Bachelor's Degree or higher | 37 (97.4%) | 1 (2.6%) |
Occupancy by Age of Householder in Kendall
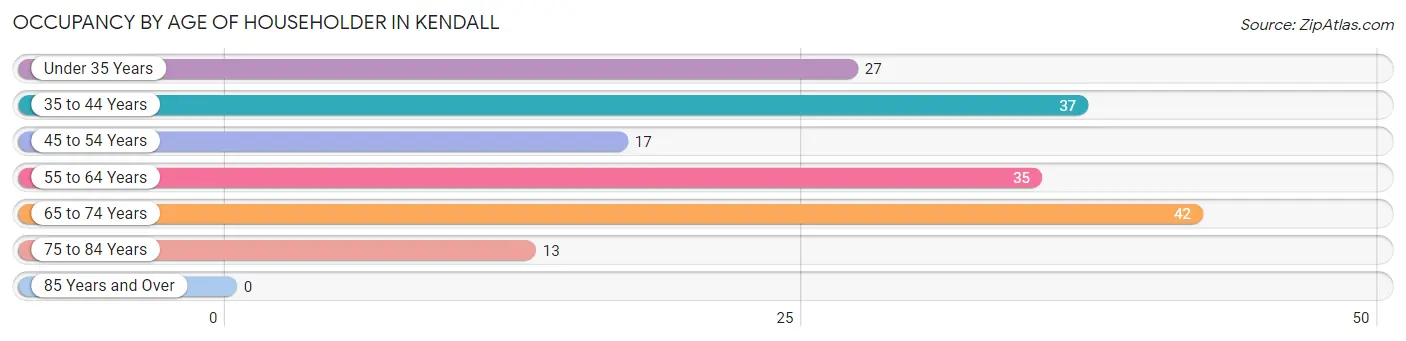
| Age Bracket | # Households | % Households |
| Under 35 Years | 27 | 15.8% |
| 35 to 44 Years | 37 | 21.6% |
| 45 to 54 Years | 17 | 9.9% |
| 55 to 64 Years | 35 | 20.5% |
| 65 to 74 Years | 42 | 24.6% |
| 75 to 84 Years | 13 | 7.6% |
| 85 Years and Over | 0 | 0.0% |
| Total | 171 | 100.0% |
Housing Finances in Kendall
Median Income by Occupancy in Kendall
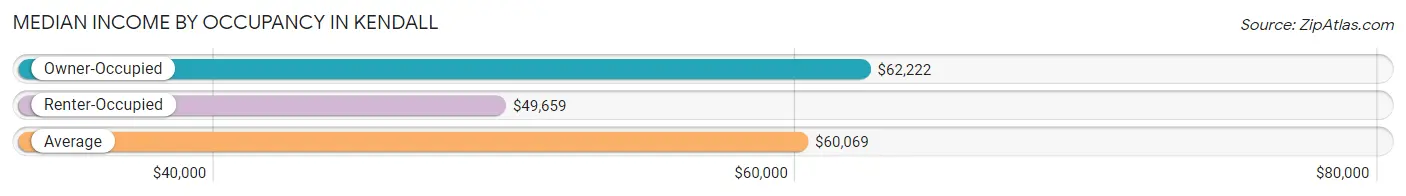
| Occupancy Type | # Households | Median Income |
| Owner-Occupied | 124 (72.5%) | $62,222 |
| Renter-Occupied | 47 (27.5%) | $49,659 |
| Average | 171 (100.0%) | $60,069 |
Occupancy by Householder Income Bracket in Kendall
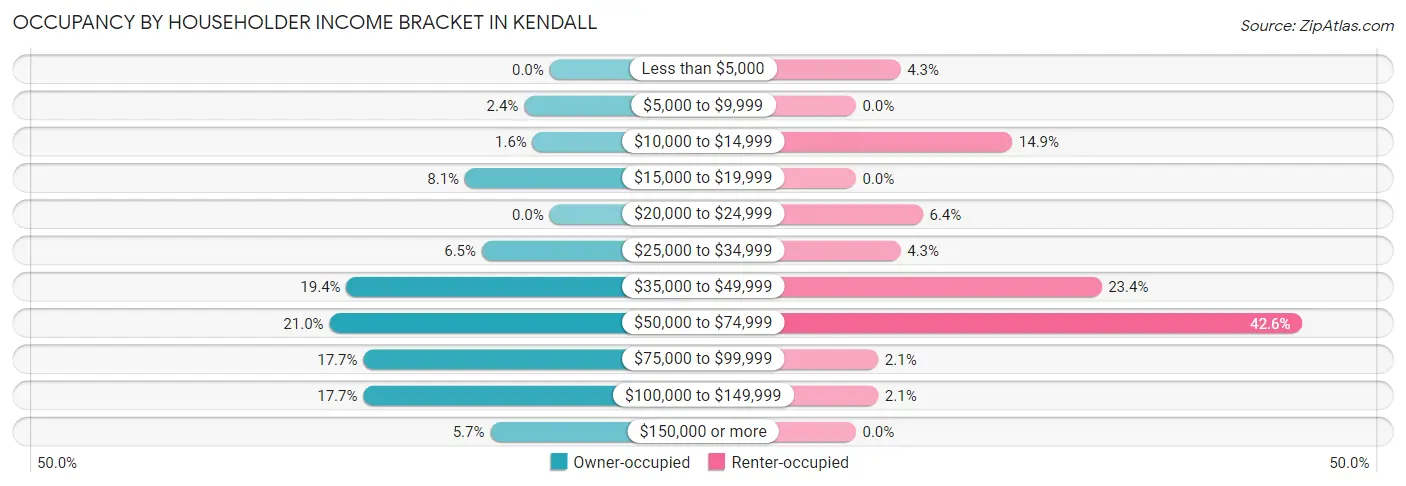
| Income Bracket | Owner-occupied | Renter-occupied |
| Less than $5,000 | 0 (0.0%) | 2 (4.3%) |
| $5,000 to $9,999 | 3 (2.4%) | 0 (0.0%) |
| $10,000 to $14,999 | 2 (1.6%) | 7 (14.9%) |
| $15,000 to $19,999 | 10 (8.1%) | 0 (0.0%) |
| $20,000 to $24,999 | 0 (0.0%) | 3 (6.4%) |
| $25,000 to $34,999 | 8 (6.5%) | 2 (4.3%) |
| $35,000 to $49,999 | 24 (19.4%) | 11 (23.4%) |
| $50,000 to $74,999 | 26 (21.0%) | 20 (42.5%) |
| $75,000 to $99,999 | 22 (17.7%) | 1 (2.1%) |
| $100,000 to $149,999 | 22 (17.7%) | 1 (2.1%) |
| $150,000 or more | 7 (5.7%) | 0 (0.0%) |
| Total | 124 (100.0%) | 47 (100.0%) |
Monthly Housing Cost Tiers in Kendall
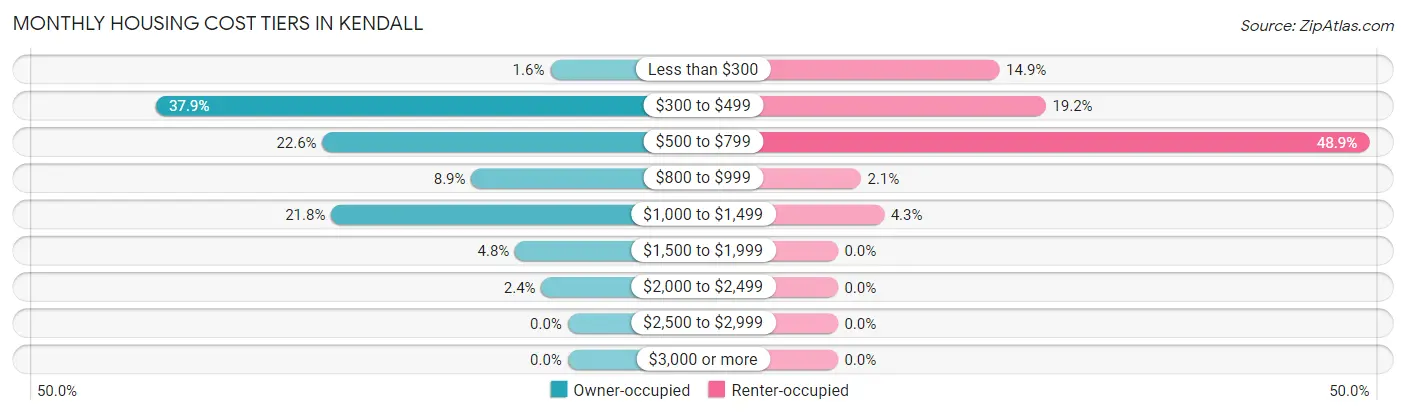
| Monthly Cost | Owner-occupied | Renter-occupied |
| Less than $300 | 2 (1.6%) | 7 (14.9%) |
| $300 to $499 | 47 (37.9%) | 9 (19.2%) |
| $500 to $799 | 28 (22.6%) | 23 (48.9%) |
| $800 to $999 | 11 (8.9%) | 1 (2.1%) |
| $1,000 to $1,499 | 27 (21.8%) | 2 (4.3%) |
| $1,500 to $1,999 | 6 (4.8%) | 0 (0.0%) |
| $2,000 to $2,499 | 3 (2.4%) | 0 (0.0%) |
| $2,500 to $2,999 | 0 (0.0%) | 0 (0.0%) |
| $3,000 or more | 0 (0.0%) | 0 (0.0%) |
| Total | 124 (100.0%) | 47 (100.0%) |
Physical Housing Characteristics in Kendall
Housing Structures in Kendall
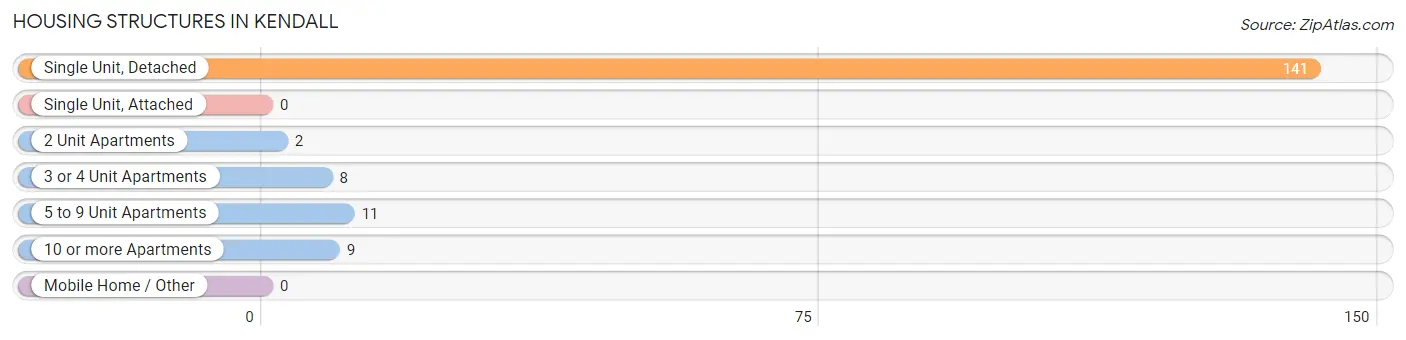
| Structure Type | # Housing Units | % Housing Units |
| Single Unit, Detached | 141 | 82.5% |
| Single Unit, Attached | 0 | 0.0% |
| 2 Unit Apartments | 2 | 1.2% |
| 3 or 4 Unit Apartments | 8 | 4.7% |
| 5 to 9 Unit Apartments | 11 | 6.4% |
| 10 or more Apartments | 9 | 5.3% |
| Mobile Home / Other | 0 | 0.0% |
| Total | 171 | 100.0% |
Housing Structures by Occupancy in Kendall
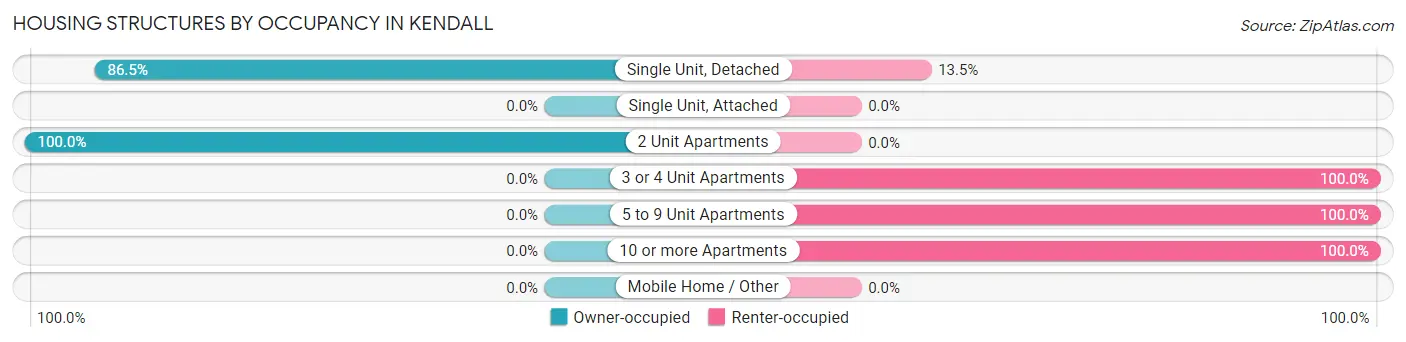
| Structure Type | Owner-occupied | Renter-occupied |
| Single Unit, Detached | 122 (86.5%) | 19 (13.5%) |
| Single Unit, Attached | 0 (0.0%) | 0 (0.0%) |
| 2 Unit Apartments | 2 (100.0%) | 0 (0.0%) |
| 3 or 4 Unit Apartments | 0 (0.0%) | 8 (100.0%) |
| 5 to 9 Unit Apartments | 0 (0.0%) | 11 (100.0%) |
| 10 or more Apartments | 0 (0.0%) | 9 (100.0%) |
| Mobile Home / Other | 0 (0.0%) | 0 (0.0%) |
| Total | 124 (72.5%) | 47 (27.5%) |
Housing Structures by Number of Rooms in Kendall
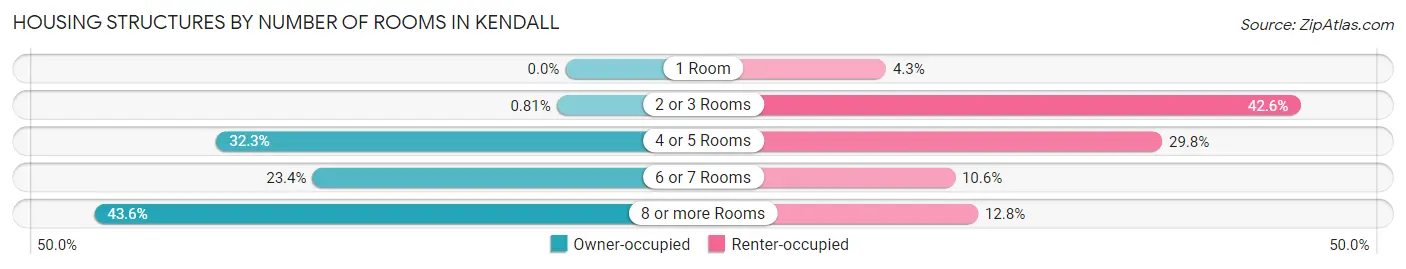
| Number of Rooms | Owner-occupied | Renter-occupied |
| 1 Room | 0 (0.0%) | 2 (4.3%) |
| 2 or 3 Rooms | 1 (0.8%) | 20 (42.5%) |
| 4 or 5 Rooms | 40 (32.3%) | 14 (29.8%) |
| 6 or 7 Rooms | 29 (23.4%) | 5 (10.6%) |
| 8 or more Rooms | 54 (43.5%) | 6 (12.8%) |
| Total | 124 (100.0%) | 47 (100.0%) |
Housing Structure by Heating Type in Kendall
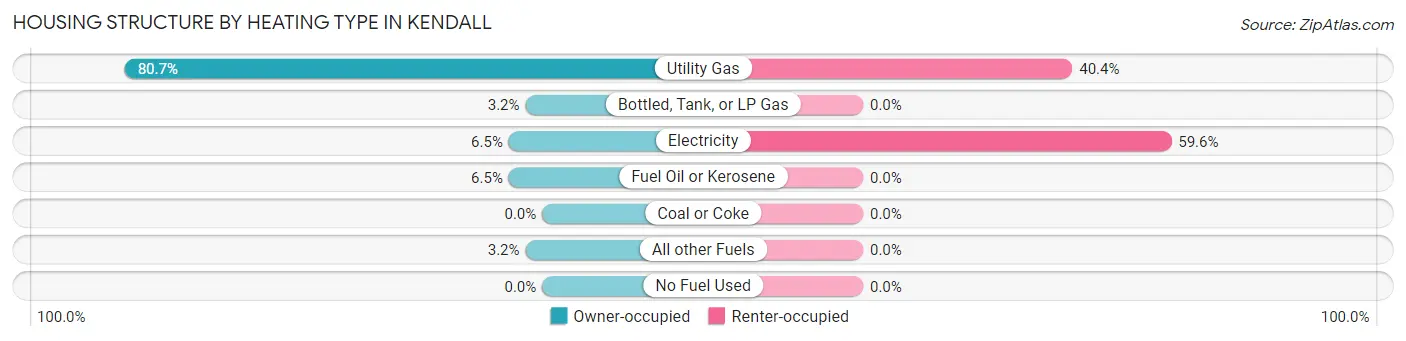
| Heating Type | Owner-occupied | Renter-occupied |
| Utility Gas | 100 (80.6%) | 19 (40.4%) |
| Bottled, Tank, or LP Gas | 4 (3.2%) | 0 (0.0%) |
| Electricity | 8 (6.5%) | 28 (59.6%) |
| Fuel Oil or Kerosene | 8 (6.5%) | 0 (0.0%) |
| Coal or Coke | 0 (0.0%) | 0 (0.0%) |
| All other Fuels | 4 (3.2%) | 0 (0.0%) |
| No Fuel Used | 0 (0.0%) | 0 (0.0%) |
| Total | 124 (100.0%) | 47 (100.0%) |
Household Vehicle Usage in Kendall
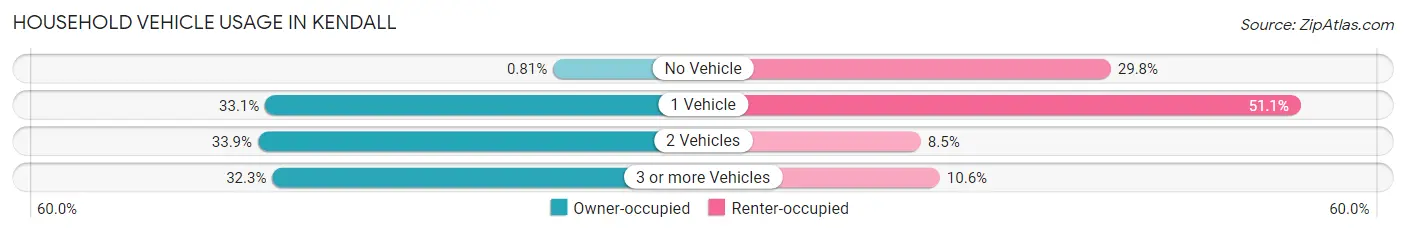
| Vehicles per Household | Owner-occupied | Renter-occupied |
| No Vehicle | 1 (0.8%) | 14 (29.8%) |
| 1 Vehicle | 41 (33.1%) | 24 (51.1%) |
| 2 Vehicles | 42 (33.9%) | 4 (8.5%) |
| 3 or more Vehicles | 40 (32.3%) | 5 (10.6%) |
| Total | 124 (100.0%) | 47 (100.0%) |
Real Estate & Mortgages in Kendall
Real Estate and Mortgage Overview in Kendall
| Characteristic | Without Mortgage | With Mortgage |
| Housing Units | 75 | 49 |
| Median Property Value | $74,100 | $113,800 |
| Median Household Income | $46,645 | $6 |
| Monthly Housing Costs | $469 | $0 |
| Real Estate Taxes | $1,411 | $0 |
Property Value by Mortgage Status in Kendall
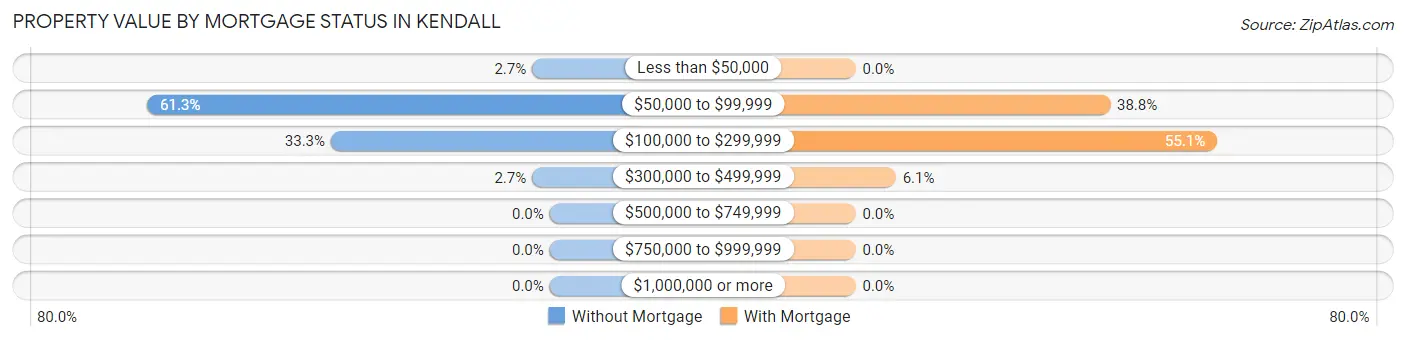
| Property Value | Without Mortgage | With Mortgage |
| Less than $50,000 | 2 (2.7%) | 0 (0.0%) |
| $50,000 to $99,999 | 46 (61.3%) | 19 (38.8%) |
| $100,000 to $299,999 | 25 (33.3%) | 27 (55.1%) |
| $300,000 to $499,999 | 2 (2.7%) | 3 (6.1%) |
| $500,000 to $749,999 | 0 (0.0%) | 0 (0.0%) |
| $750,000 to $999,999 | 0 (0.0%) | 0 (0.0%) |
| $1,000,000 or more | 0 (0.0%) | 0 (0.0%) |
| Total | 75 (100.0%) | 49 (100.0%) |
Household Income by Mortgage Status in Kendall
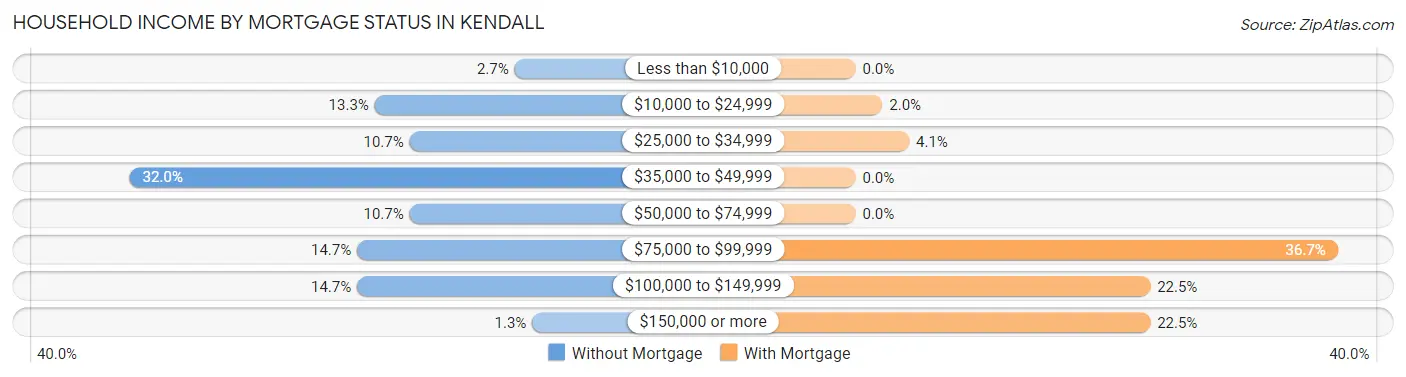
| Household Income | Without Mortgage | With Mortgage |
| Less than $10,000 | 2 (2.7%) | 0 (0.0%) |
| $10,000 to $24,999 | 10 (13.3%) | 1 (2.0%) |
| $25,000 to $34,999 | 8 (10.7%) | 2 (4.1%) |
| $35,000 to $49,999 | 24 (32.0%) | 0 (0.0%) |
| $50,000 to $74,999 | 8 (10.7%) | 0 (0.0%) |
| $75,000 to $99,999 | 11 (14.7%) | 18 (36.7%) |
| $100,000 to $149,999 | 11 (14.7%) | 11 (22.5%) |
| $150,000 or more | 1 (1.3%) | 11 (22.5%) |
| Total | 75 (100.0%) | 49 (100.0%) |
Property Value to Household Income Ratio in Kendall
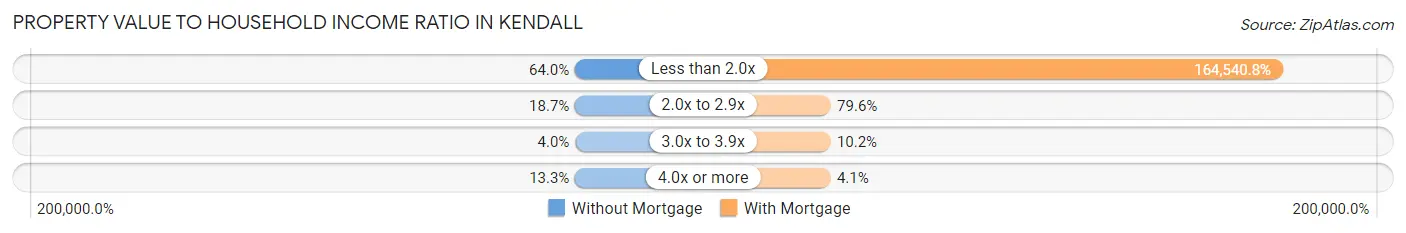
| Value-to-Income Ratio | Without Mortgage | With Mortgage |
| Less than 2.0x | 48 (64.0%) | 80,625 (164,540.8%) |
| 2.0x to 2.9x | 14 (18.7%) | 39 (79.6%) |
| 3.0x to 3.9x | 3 (4.0%) | 5 (10.2%) |
| 4.0x or more | 10 (13.3%) | 2 (4.1%) |
| Total | 75 (100.0%) | 49 (100.0%) |
Real Estate Taxes by Mortgage Status in Kendall
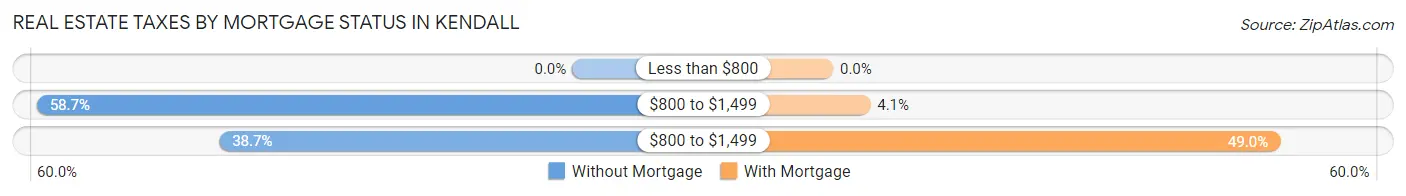
| Property Taxes | Without Mortgage | With Mortgage |
| Less than $800 | 0 (0.0%) | 0 (0.0%) |
| $800 to $1,499 | 44 (58.7%) | 2 (4.1%) |
| $800 to $1,499 | 29 (38.7%) | 24 (49.0%) |
| Total | 75 (100.0%) | 49 (100.0%) |
Health & Disability in Kendall
Health Insurance Coverage by Age in Kendall
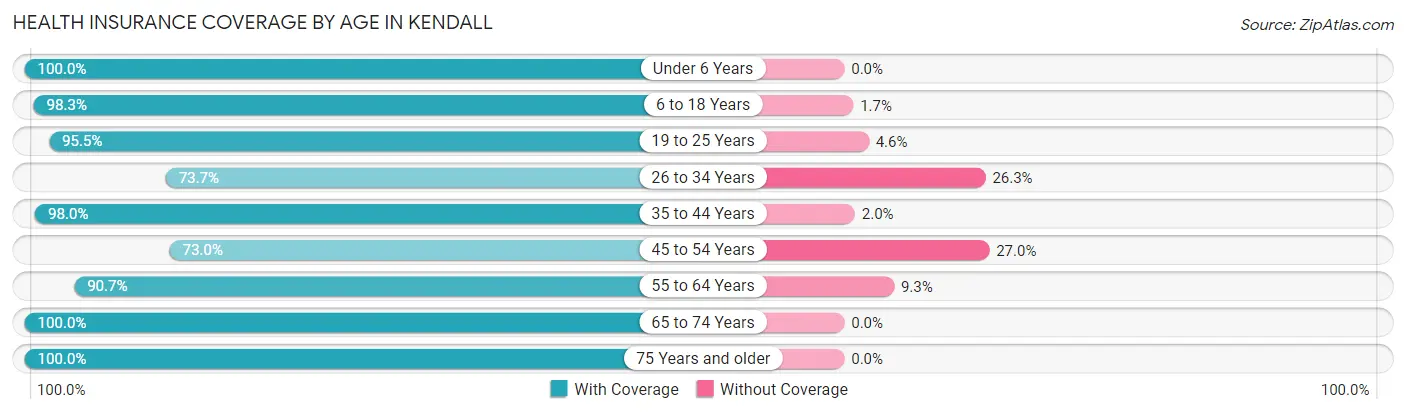
| Age Bracket | With Coverage | Without Coverage |
| Under 6 Years | 27 (100.0%) | 0 (0.0%) |
| 6 to 18 Years | 59 (98.3%) | 1 (1.7%) |
| 19 to 25 Years | 42 (95.5%) | 2 (4.5%) |
| 26 to 34 Years | 28 (73.7%) | 10 (26.3%) |
| 35 to 44 Years | 50 (98.0%) | 1 (2.0%) |
| 45 to 54 Years | 27 (73.0%) | 10 (27.0%) |
| 55 to 64 Years | 49 (90.7%) | 5 (9.3%) |
| 65 to 74 Years | 60 (100.0%) | 0 (0.0%) |
| 75 Years and older | 17 (100.0%) | 0 (0.0%) |
| Total | 359 (92.5%) | 29 (7.5%) |
Health Insurance Coverage by Citizenship Status in Kendall
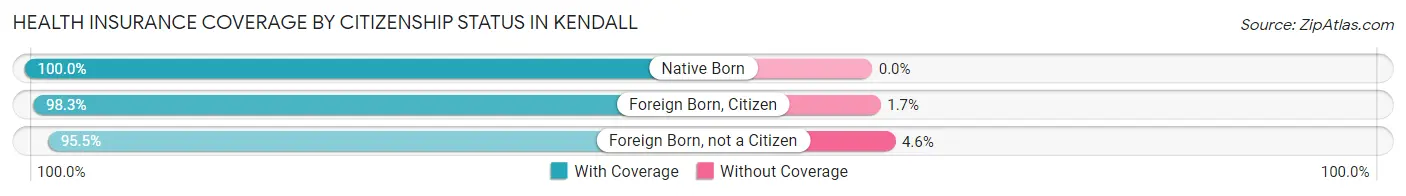
| Citizenship Status | With Coverage | Without Coverage |
| Native Born | 27 (100.0%) | 0 (0.0%) |
| Foreign Born, Citizen | 59 (98.3%) | 1 (1.7%) |
| Foreign Born, not a Citizen | 42 (95.5%) | 2 (4.5%) |
Health Insurance Coverage by Household Income in Kendall
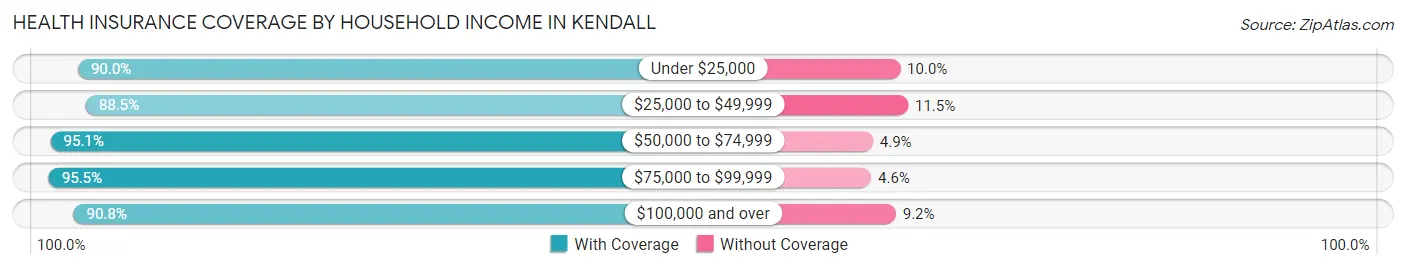
| Household Income | With Coverage | Without Coverage |
| Under $25,000 | 36 (90.0%) | 4 (10.0%) |
| $25,000 to $49,999 | 54 (88.5%) | 7 (11.5%) |
| $50,000 to $74,999 | 117 (95.1%) | 6 (4.9%) |
| $75,000 to $99,999 | 63 (95.5%) | 3 (4.5%) |
| $100,000 and over | 89 (90.8%) | 9 (9.2%) |
Public vs Private Health Insurance Coverage by Age in Kendall
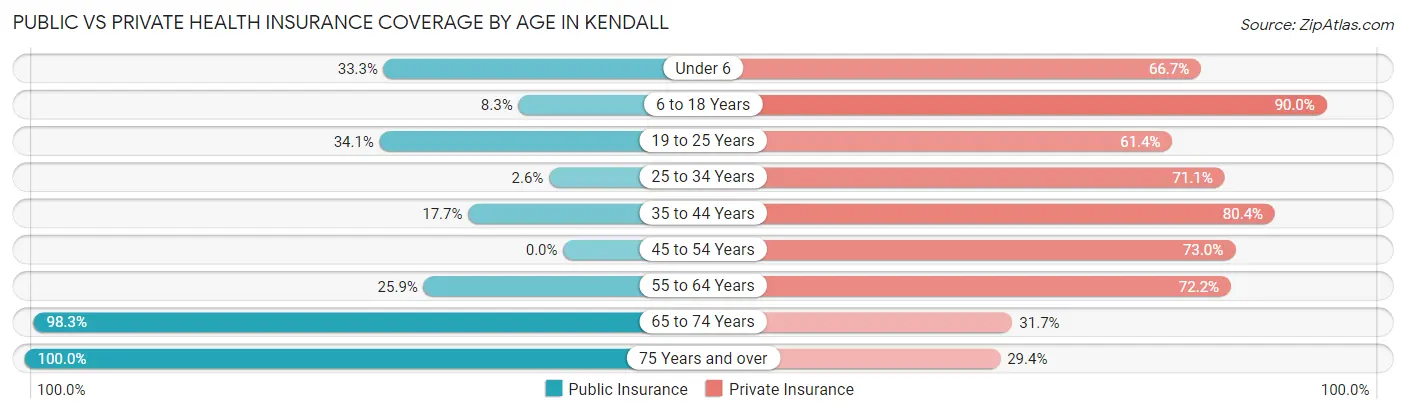
| Age Bracket | Public Insurance | Private Insurance |
| Under 6 | 9 (33.3%) | 18 (66.7%) |
| 6 to 18 Years | 5 (8.3%) | 54 (90.0%) |
| 19 to 25 Years | 15 (34.1%) | 27 (61.4%) |
| 25 to 34 Years | 1 (2.6%) | 27 (71.1%) |
| 35 to 44 Years | 9 (17.6%) | 41 (80.4%) |
| 45 to 54 Years | 0 (0.0%) | 27 (73.0%) |
| 55 to 64 Years | 14 (25.9%) | 39 (72.2%) |
| 65 to 74 Years | 59 (98.3%) | 19 (31.7%) |
| 75 Years and over | 17 (100.0%) | 5 (29.4%) |
| Total | 129 (33.3%) | 257 (66.2%) |
Disability Status by Sex by Age in Kendall
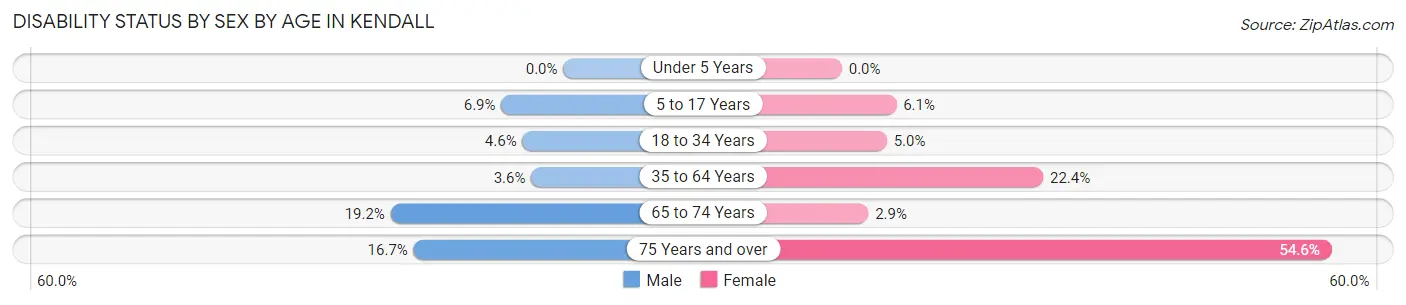
| Age Bracket | Male | Female |
| Under 5 Years | 0 (0.0%) | 0 (0.0%) |
| 5 to 17 Years | 2 (6.9%) | 2 (6.1%) |
| 18 to 34 Years | 2 (4.5%) | 2 (5.0%) |
| 35 to 64 Years | 3 (3.6%) | 13 (22.4%) |
| 65 to 74 Years | 5 (19.2%) | 1 (2.9%) |
| 75 Years and over | 1 (16.7%) | 6 (54.5%) |
Disability Class by Sex by Age in Kendall
Disability Class: Hearing Difficulty
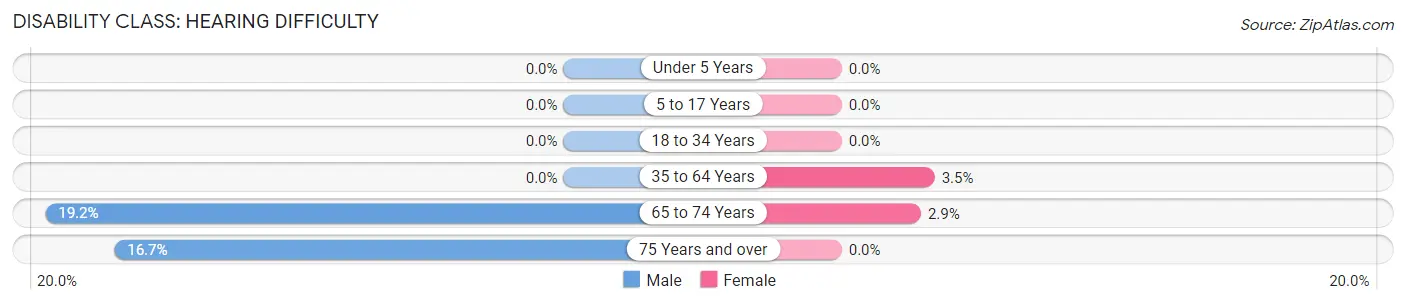
| Age Bracket | Male | Female |
| Under 5 Years | 0 (0.0%) | 0 (0.0%) |
| 5 to 17 Years | 0 (0.0%) | 0 (0.0%) |
| 18 to 34 Years | 0 (0.0%) | 0 (0.0%) |
| 35 to 64 Years | 0 (0.0%) | 2 (3.5%) |
| 65 to 74 Years | 5 (19.2%) | 1 (2.9%) |
| 75 Years and over | 1 (16.7%) | 0 (0.0%) |
Disability Class: Vision Difficulty
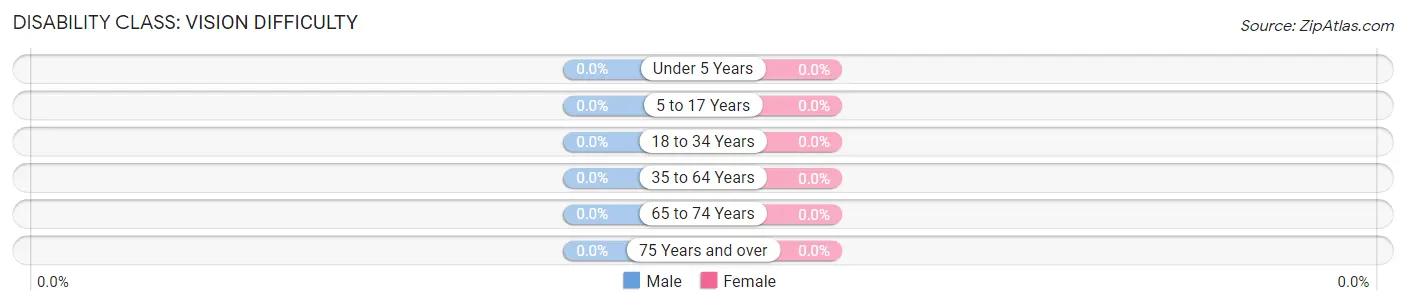
| Age Bracket | Male | Female |
| Under 5 Years | 0 (0.0%) | 0 (0.0%) |
| 5 to 17 Years | 0 (0.0%) | 0 (0.0%) |
| 18 to 34 Years | 0 (0.0%) | 0 (0.0%) |
| 35 to 64 Years | 0 (0.0%) | 0 (0.0%) |
| 65 to 74 Years | 0 (0.0%) | 0 (0.0%) |
| 75 Years and over | 0 (0.0%) | 0 (0.0%) |
Disability Class: Cognitive Difficulty
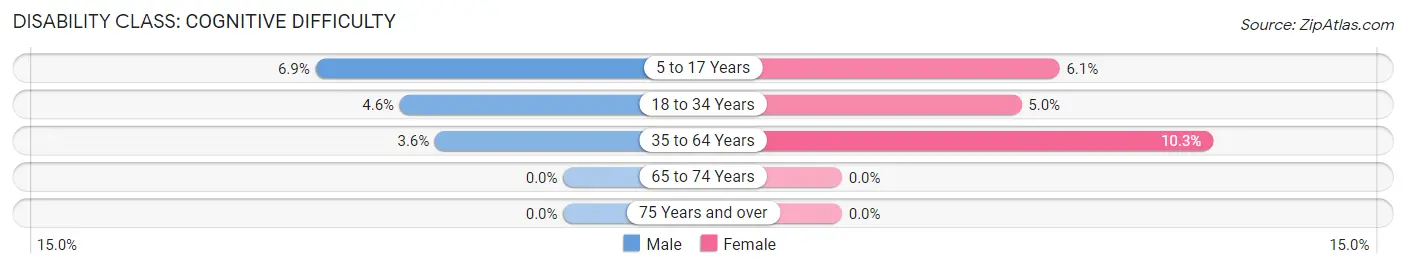
| Age Bracket | Male | Female |
| 5 to 17 Years | 2 (6.9%) | 2 (6.1%) |
| 18 to 34 Years | 2 (4.5%) | 2 (5.0%) |
| 35 to 64 Years | 3 (3.6%) | 6 (10.3%) |
| 65 to 74 Years | 0 (0.0%) | 0 (0.0%) |
| 75 Years and over | 0 (0.0%) | 0 (0.0%) |
Disability Class: Ambulatory Difficulty
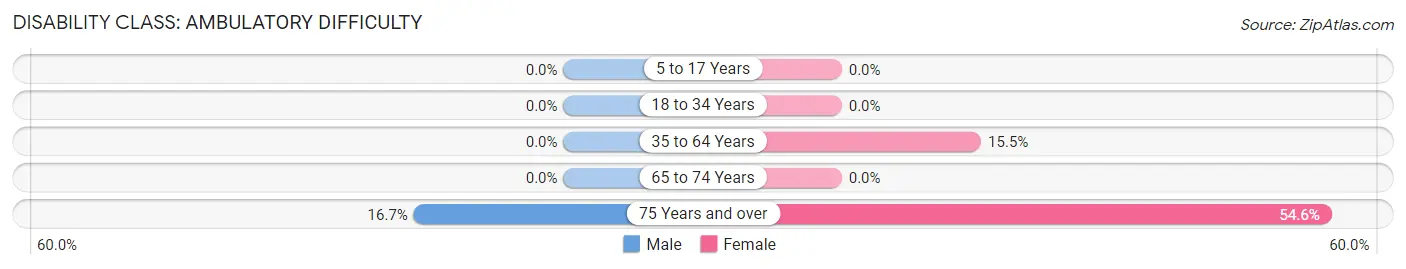
| Age Bracket | Male | Female |
| 5 to 17 Years | 0 (0.0%) | 0 (0.0%) |
| 18 to 34 Years | 0 (0.0%) | 0 (0.0%) |
| 35 to 64 Years | 0 (0.0%) | 9 (15.5%) |
| 65 to 74 Years | 0 (0.0%) | 0 (0.0%) |
| 75 Years and over | 1 (16.7%) | 6 (54.5%) |
Disability Class: Self-Care Difficulty
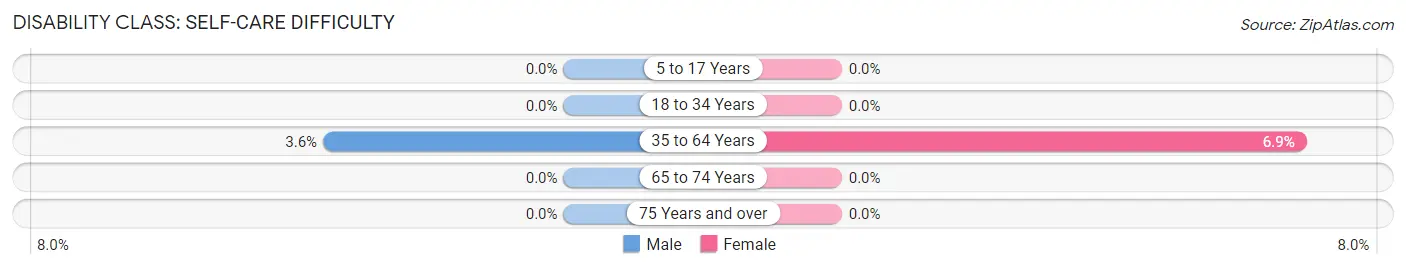
| Age Bracket | Male | Female |
| 5 to 17 Years | 0 (0.0%) | 0 (0.0%) |
| 18 to 34 Years | 0 (0.0%) | 0 (0.0%) |
| 35 to 64 Years | 3 (3.6%) | 4 (6.9%) |
| 65 to 74 Years | 0 (0.0%) | 0 (0.0%) |
| 75 Years and over | 0 (0.0%) | 0 (0.0%) |
Technology Access in Kendall
Computing Device Access in Kendall
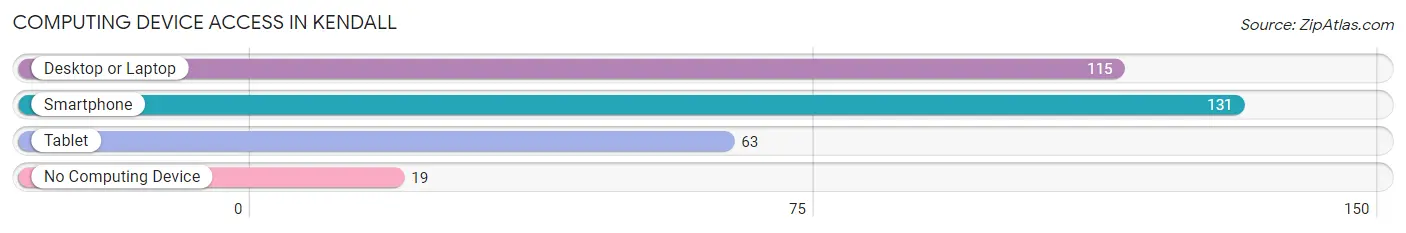
| Device Type | # Households | % Households |
| Desktop or Laptop | 115 | 67.2% |
| Smartphone | 131 | 76.6% |
| Tablet | 63 | 36.8% |
| No Computing Device | 19 | 11.1% |
| Total | 171 | 100.0% |
Internet Access in Kendall
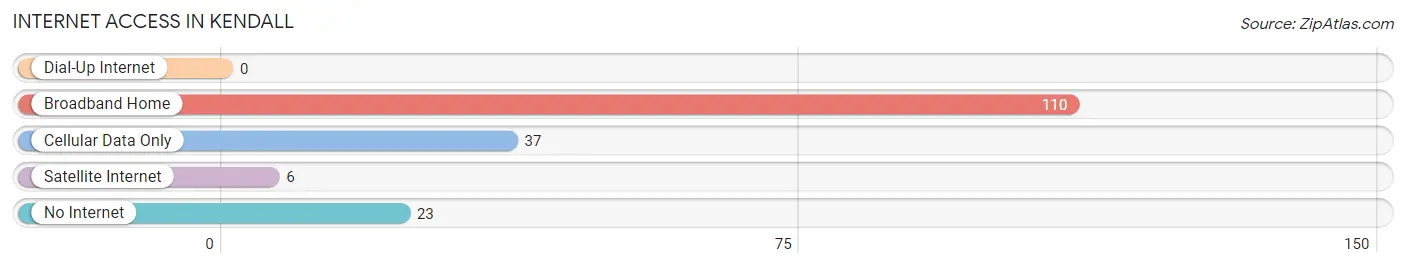
| Internet Type | # Households | % Households |
| Dial-Up Internet | 0 | 0.0% |
| Broadband Home | 110 | 64.3% |
| Cellular Data Only | 37 | 21.6% |
| Satellite Internet | 6 | 3.5% |
| No Internet | 23 | 13.5% |
| Total | 171 | 100.0% |
Kendall Summary
Kendall is a small town located in the western part of Wisconsin, in the county of Pierce. It is situated on the banks of the Chippewa River, and is surrounded by rolling hills and lush forests. The town has a population of just over 1,000 people, and is known for its small-town charm and friendly atmosphere.
History
Kendall was first settled in 1854 by a group of settlers from New York. The town was named after the first settler, William Kendall, who was a prominent businessman in the area. The town quickly grew, and by the late 1800s, it had become a thriving agricultural and lumbering center. The town was also home to a number of small businesses, including a sawmill, a grist mill, and a general store.
In the early 1900s, the town began to decline as the lumber industry moved away and the agricultural industry shifted to larger cities. However, the town was able to remain a small, rural community, and it has remained so to this day.
Geography
Kendall is located in the western part of Wisconsin, in the county of Pierce. It is situated on the banks of the Chippewa River, and is surrounded by rolling hills and lush forests. The town is located about 25 miles from the city of Eau Claire, and about 50 miles from the city of Minneapolis.
The town has a total area of 1.2 square miles, all of which is land. The town is located at an elevation of 890 feet above sea level.
Economy
Kendall’s economy is largely based on agriculture and tourism. The town is home to a number of small farms, which produce a variety of crops, including corn, soybeans, and hay. The town is also home to a number of small businesses, including a sawmill, a grist mill, and a general store.
The town is also a popular tourist destination, as it is located near a number of outdoor recreational areas, including the Chippewa River, the Kinnickinnic State Park, and the St. Croix National Scenic Riverway. The town also hosts a number of festivals and events throughout the year, including the Kendall Days Festival and the Kendall County Fair.
Demographics
As of the 2010 census, Kendall had a population of 1,072 people. The racial makeup of the town was 97.2% White, 0.7% African American, 0.3% Native American, 0.2% Asian, 0.1% Pacific Islander, 0.7% from other races, and 0.9% from two or more races. Hispanic or Latino of any race were 1.7% of the population.
The median household income in Kendall was $45,938, and the median family income was $51,250. The per capita income for the town was $20,945. About 8.2% of families and 10.2% of the population were below the poverty line, including 14.2% of those under age 18 and 6.3% of those age 65 or over.
Common Questions
What is Per Capita Income in Kendall?
Per Capita income in Kendall is $30,596.
What is the Median Family Income in Kendall?
Median Family Income in Kendall is $64,107.
What is the Median Household income in Kendall?
Median Household Income in Kendall is $60,069.
What is Income or Wage Gap in Kendall?
Income or Wage Gap in Kendall is 18.3%.
Women in Kendall earn 81.7 cents for every dollar earned by a man.
What is Inequality or Gini Index in Kendall?
Inequality or Gini Index in Kendall is 0.34.
What is the Total Population of Kendall?
Total Population of Kendall is 388.
What is the Total Male Population of Kendall?
Total Male Population of Kendall is 201.
What is the Total Female Population of Kendall?
Total Female Population of Kendall is 187.
What is the Ratio of Males per 100 Females in Kendall?
There are 107.49 Males per 100 Females in Kendall.
What is the Ratio of Females per 100 Males in Kendall?
There are 93.03 Females per 100 Males in Kendall.
What is the Median Population Age in Kendall?
Median Population Age in Kendall is 40.2 Years.
What is the Average Family Size in Kendall
Average Family Size in Kendall is 2.8 People.
What is the Average Household Size in Kendall
Average Household Size in Kendall is 2.3 People.
How Large is the Labor Force in Kendall?
There are 191 People in the Labor Forcein in Kendall.
What is the Percentage of People in the Labor Force in Kendall?
61.0% of People are in the Labor Force in Kendall.
What is the Unemployment Rate in Kendall?
Unemployment Rate in Kendall is 3.1%.