Zip Codes with the Highest Percentage of Households with Income Below $10,000 in Houston, TX
RELATED REPORTS & OPTIONS
Household Income | $0-10k
Houston
Compare Zip Codes
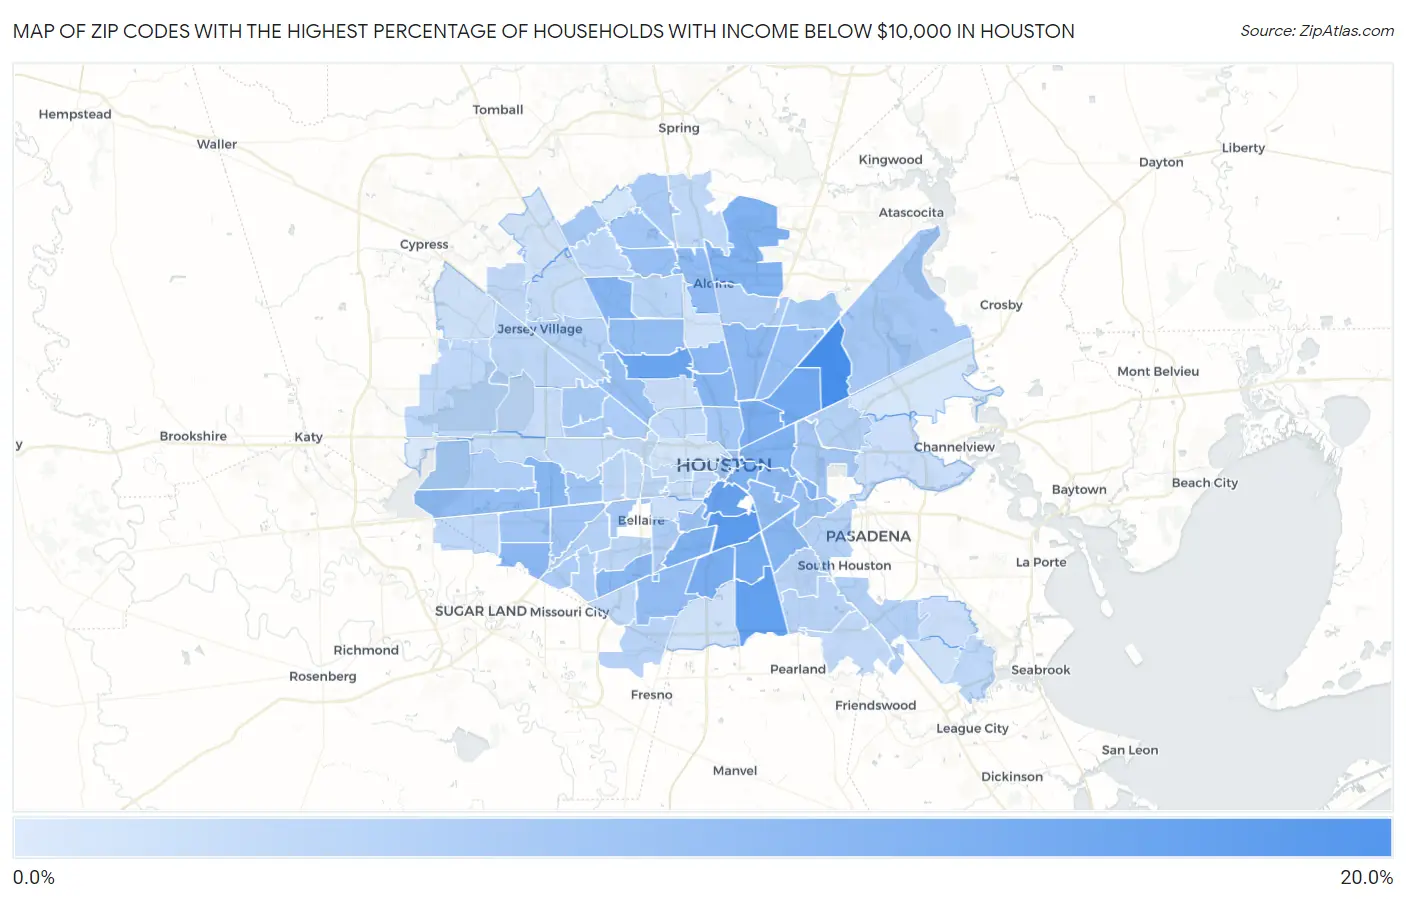
Map of Zip Codes with the Highest Percentage of Households with Income Below $10,000 in Houston
1.2%
16.4%
Zip Codes with the Highest Percentage of Households with Income Below $10,000 in Houston, TX
| Zip Code | Households with Income < $10k | vs State | vs National | |
| 1. | 77078 | 16.4% | 5.1%(+11.3)#60 | 4.9%(+11.5)#1,257 |
| 2. | 77021 | 14.4% | 5.1%(+9.30)#76 | 4.9%(+9.50)#1,665 |
| 3. | 77048 | 13.4% | 5.1%(+8.30)#95 | 4.9%(+8.50)#1,944 |
| 4. | 77004 | 13.0% | 5.1%(+7.90)#106 | 4.9%(+8.10)#2,062 |
| 5. | 77091 | 12.5% | 5.1%(+7.40)#117 | 4.9%(+7.60)#2,252 |
| 6. | 77028 | 11.8% | 5.1%(+6.70)#137 | 4.9%(+6.90)#2,543 |
| 7. | 77033 | 11.6% | 5.1%(+6.50)#145 | 4.9%(+6.70)#2,623 |
| 8. | 77051 | 11.0% | 5.1%(+5.90)#169 | 4.9%(+6.10)#2,954 |
| 9. | 77026 | 10.9% | 5.1%(+5.80)#172 | 4.9%(+6.00)#3,005 |
| 10. | 77054 | 10.5% | 5.1%(+5.40)#188 | 4.9%(+5.60)#3,230 |
| 11. | 77003 | 10.5% | 5.1%(+5.40)#190 | 4.9%(+5.60)#3,239 |
| 12. | 77020 | 10.4% | 5.1%(+5.30)#192 | 4.9%(+5.50)#3,293 |
| 13. | 77032 | 10.3% | 5.1%(+5.20)#198 | 4.9%(+5.40)#3,366 |
| 14. | 77086 | 9.9% | 5.1%(+4.80)#226 | 4.9%(+5.00)#3,648 |
| 15. | 77042 | 9.6% | 5.1%(+4.50)#241 | 4.9%(+4.70)#3,867 |
| 16. | 77022 | 9.6% | 5.1%(+4.50)#242 | 4.9%(+4.70)#3,873 |
| 17. | 77087 | 9.5% | 5.1%(+4.40)#250 | 4.9%(+4.60)#3,952 |
| 18. | 77035 | 9.3% | 5.1%(+4.20)#261 | 4.9%(+4.40)#4,094 |
| 19. | 77099 | 9.2% | 5.1%(+4.10)#268 | 4.9%(+4.30)#4,195 |
| 20. | 77011 | 9.2% | 5.1%(+4.10)#272 | 4.9%(+4.30)#4,215 |
| 21. | 77093 | 9.1% | 5.1%(+4.00)#277 | 4.9%(+4.20)#4,294 |
| 22. | 77076 | 9.0% | 5.1%(+3.90)#285 | 4.9%(+4.10)#4,400 |
| 23. | 77060 | 8.6% | 5.1%(+3.50)#304 | 4.9%(+3.70)#4,816 |
| 24. | 77023 | 8.6% | 5.1%(+3.50)#309 | 4.9%(+3.70)#4,829 |
| 25. | 77082 | 8.5% | 5.1%(+3.40)#318 | 4.9%(+3.60)#4,911 |
| 26. | 77045 | 8.5% | 5.1%(+3.40)#320 | 4.9%(+3.60)#4,922 |
| 27. | 77088 | 8.1% | 5.1%(+3.00)#360 | 4.9%(+3.20)#5,408 |
| 28. | 77092 | 8.0% | 5.1%(+2.90)#367 | 4.9%(+3.10)#5,551 |
| 29. | 77067 | 7.9% | 5.1%(+2.80)#375 | 4.9%(+3.00)#5,676 |
| 30. | 77016 | 7.9% | 5.1%(+2.80)#376 | 4.9%(+3.00)#5,682 |
| 31. | 77030 | 7.8% | 5.1%(+2.70)#391 | 4.9%(+2.90)#5,834 |
| 32. | 77012 | 7.6% | 5.1%(+2.50)#402 | 4.9%(+2.70)#6,092 |
| 33. | 77063 | 7.3% | 5.1%(+2.20)#440 | 4.9%(+2.40)#6,478 |
| 34. | 77002 | 7.2% | 5.1%(+2.10)#452 | 4.9%(+2.30)#6,651 |
| 35. | 77036 | 7.1% | 5.1%(+2.00)#463 | 4.9%(+2.20)#6,766 |
| 36. | 77072 | 7.0% | 5.1%(+1.90)#477 | 4.9%(+2.10)#6,942 |
| 37. | 77009 | 6.8% | 5.1%(+1.70)#499 | 4.9%(+1.90)#7,310 |
| 38. | 77014 | 6.7% | 5.1%(+1.60)#521 | 4.9%(+1.80)#7,528 |
| 39. | 77044 | 6.6% | 5.1%(+1.50)#531 | 4.9%(+1.70)#7,700 |
| 40. | 77069 | 6.6% | 5.1%(+1.50)#534 | 4.9%(+1.70)#7,735 |
| 41. | 77046 | 6.6% | 5.1%(+1.50)#540 | 4.9%(+1.70)#7,848 |
| 42. | 77081 | 6.5% | 5.1%(+1.40)#544 | 4.9%(+1.60)#7,884 |
| 43. | 77029 | 6.5% | 5.1%(+1.40)#548 | 4.9%(+1.60)#7,937 |
| 44. | 77050 | 6.4% | 5.1%(+1.30)#563 | 4.9%(+1.50)#8,192 |
| 45. | 77080 | 6.3% | 5.1%(+1.20)#570 | 4.9%(+1.40)#8,295 |
| 46. | 77090 | 6.2% | 5.1%(+1.10)#585 | 4.9%(+1.30)#8,519 |
| 47. | 77055 | 5.8% | 5.1%(+0.700)#636 | 4.9%(+0.900)#9,450 |
| 48. | 77031 | 5.8% | 5.1%(+0.700)#641 | 4.9%(+0.900)#9,510 |
| 49. | 77039 | 5.7% | 5.1%(+0.600)#656 | 4.9%(+0.800)#9,721 |
| 50. | 77025 | 5.6% | 5.1%(+0.500)#671 | 4.9%(+0.700)#9,977 |
| 51. | 77077 | 5.5% | 5.1%(+0.400)#684 | 4.9%(+0.600)#10,184 |
| 52. | 77034 | 5.3% | 5.1%(+0.200)#716 | 4.9%(+0.400)#10,733 |
| 53. | 77071 | 5.3% | 5.1%(+0.200)#718 | 4.9%(+0.400)#10,764 |
| 54. | 77074 | 5.2% | 5.1%(+0.100)#734 | 4.9%(+0.300)#11,050 |
| 55. | 77040 | 5.0% | 5.1%(-0.100)#776 | 4.9%(+0.100)#11,653 |
| 56. | 77013 | 5.0% | 5.1%(-0.100)#784 | 4.9%(+0.100)#11,730 |
| 57. | 77017 | 4.9% | 5.1%(-0.200)#799 | 4.9%(=0.000)#12,003 |
| 58. | 77053 | 4.8% | 5.1%(-0.300)#820 | 4.9%(-0.100)#12,316 |
| 59. | 77075 | 4.7% | 5.1%(-0.400)#832 | 4.9%(-0.200)#12,632 |
| 60. | 77061 | 4.7% | 5.1%(-0.400)#839 | 4.9%(-0.200)#12,678 |
| 61. | 77038 | 4.5% | 5.1%(-0.600)#874 | 4.9%(-0.400)#13,362 |
| 62. | 77057 | 4.4% | 5.1%(-0.700)#887 | 4.9%(-0.500)#13,672 |
| 63. | 77096 | 4.4% | 5.1%(-0.700)#888 | 4.9%(-0.500)#13,698 |
| 64. | 77041 | 4.3% | 5.1%(-0.800)#907 | 4.9%(-0.600)#14,075 |
| 65. | 77006 | 4.2% | 5.1%(-0.900)#929 | 4.9%(-0.700)#14,515 |
| 66. | 77027 | 4.2% | 5.1%(-0.900)#932 | 4.9%(-0.700)#14,537 |
| 67. | 77058 | 4.1% | 5.1%(-1.00)#959 | 4.9%(-0.800)#14,907 |
| 68. | 77084 | 4.0% | 5.1%(-1.10)#975 | 4.9%(-0.900)#15,183 |
| 69. | 77083 | 4.0% | 5.1%(-1.10)#976 | 4.9%(-0.900)#15,185 |
| 70. | 77073 | 4.0% | 5.1%(-1.10)#980 | 4.9%(-0.900)#15,217 |
| 71. | 77066 | 4.0% | 5.1%(-1.10)#981 | 4.9%(-0.900)#15,224 |
| 72. | 77008 | 4.0% | 5.1%(-1.10)#982 | 4.9%(-0.900)#15,226 |
| 73. | 77085 | 4.0% | 5.1%(-1.10)#986 | 4.9%(-0.900)#15,310 |
| 74. | 77065 | 3.9% | 5.1%(-1.20)#999 | 4.9%(-1.00)#15,609 |
| 75. | 77089 | 3.8% | 5.1%(-1.30)#1,023 | 4.9%(-1.10)#15,966 |
| 76. | 77024 | 3.7% | 5.1%(-1.40)#1,048 | 4.9%(-1.20)#16,402 |
| 77. | 77019 | 3.7% | 5.1%(-1.40)#1,056 | 4.9%(-1.20)#16,454 |
| 78. | 77056 | 3.6% | 5.1%(-1.50)#1,083 | 4.9%(-1.30)#16,876 |
| 79. | 77079 | 3.3% | 5.1%(-1.80)#1,132 | 4.9%(-1.60)#18,076 |
| 80. | 77098 | 3.3% | 5.1%(-1.80)#1,136 | 4.9%(-1.60)#18,165 |
| 81. | 77064 | 3.2% | 5.1%(-1.90)#1,157 | 4.9%(-1.70)#18,453 |
| 82. | 77018 | 3.2% | 5.1%(-1.90)#1,162 | 4.9%(-1.70)#18,508 |
| 83. | 77043 | 3.2% | 5.1%(-1.90)#1,163 | 4.9%(-1.70)#18,529 |
| 84. | 77015 | 3.0% | 5.1%(-2.10)#1,195 | 4.9%(-1.90)#19,284 |
| 85. | 77059 | 3.0% | 5.1%(-2.10)#1,207 | 4.9%(-1.90)#19,420 |
| 86. | 77005 | 2.8% | 5.1%(-2.30)#1,262 | 4.9%(-2.10)#20,289 |
| 87. | 77047 | 2.6% | 5.1%(-2.50)#1,305 | 4.9%(-2.30)#21,090 |
| 88. | 77062 | 2.6% | 5.1%(-2.50)#1,311 | 4.9%(-2.30)#21,137 |
| 89. | 77095 | 2.5% | 5.1%(-2.60)#1,324 | 4.9%(-2.40)#21,528 |
| 90. | 77070 | 2.4% | 5.1%(-2.70)#1,346 | 4.9%(-2.50)#21,975 |
| 91. | 77037 | 2.4% | 5.1%(-2.70)#1,352 | 4.9%(-2.50)#22,079 |
| 92. | 77007 | 2.1% | 5.1%(-3.00)#1,407 | 4.9%(-2.80)#23,220 |
| 93. | 77049 | 1.8% | 5.1%(-3.30)#1,473 | 4.9%(-3.10)#24,344 |
| 94. | 77068 | 1.8% | 5.1%(-3.30)#1,479 | 4.9%(-3.10)#24,431 |
| 95. | 77094 | 1.2% | 5.1%(-3.90)#1,573 | 4.9%(-3.70)#26,339 |
1
Common Questions
What are the Top 10 Zip Codes with the Highest Percentage of Households with Income Below $10,000 in Houston, TX?
Top 10 Zip Codes with the Highest Percentage of Households with Income Below $10,000 in Houston, TX are:
What zip code has the Highest Percentage of Households with Income Below $10,000 in Houston, TX?
77078 has the Highest Percentage of Households with Income Below $10,000 in Houston, TX with 16.4%.
What is the Percentage of Households with Income Below $10,000 in Houston, TX?
Percentage of Households with Income Below $10,000 in Houston is 6.7%.
What is the Percentage of Households with Income Below $10,000 in Texas?
Percentage of Households with Income Below $10,000 in Texas is 5.1%.
What is the Percentage of Households with Income Below $10,000 in the United States?
Percentage of Households with Income Below $10,000 in the United States is 4.9%.