Zip Codes with the Highest Percentage of Households Residing in Detached Homes in Houston, TX
RELATED REPORTS & OPTIONS
Detached Home Residency
Houston
Compare Zip Codes
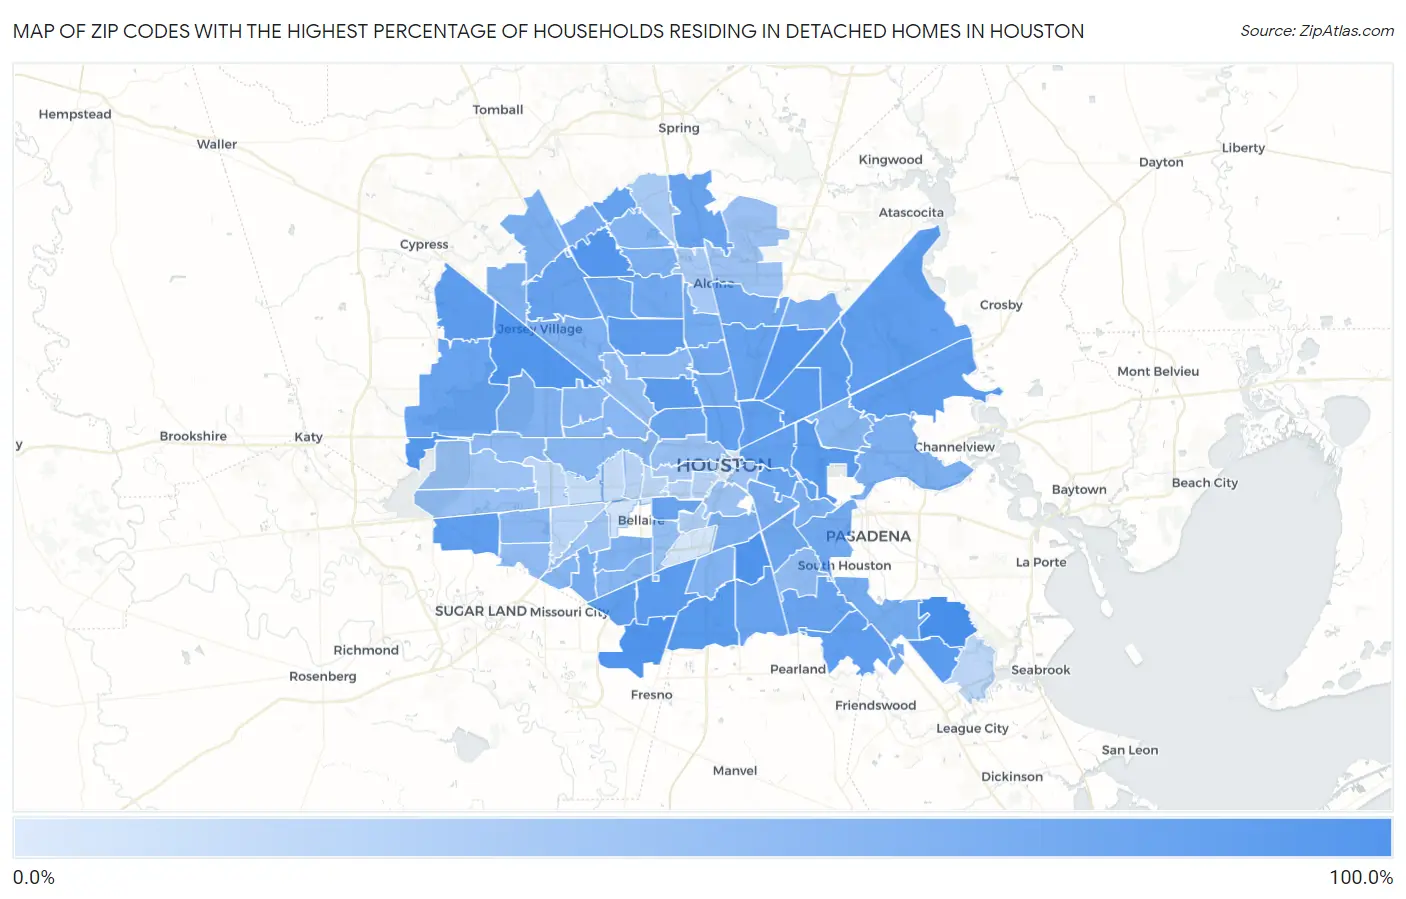
Map of Zip Codes with the Highest Percentage of Households Residing in Detached Homes in Houston
2.4%
95.3%
Zip Codes with the Highest Percentage of Households Residing in Detached Homes in Houston, TX
| Zip Code | Detached Home Residency | vs State | vs National | |
| 1. | 77059 | 95.3% | 66.1%(+29.2)#156 | 62.5%(+32.8)#3,490 |
| 2. | 77033 | 88.4% | 66.1%(+22.3)#293 | 62.5%(+25.9)#7,653 |
| 3. | 77053 | 87.6% | 66.1%(+21.5)#316 | 62.5%(+25.1)#8,197 |
| 4. | 77041 | 85.5% | 66.1%(+19.4)#402 | 62.5%(+23.0)#9,786 |
| 5. | 77066 | 84.4% | 66.1%(+18.3)#443 | 62.5%(+21.9)#10,672 |
| 6. | 77016 | 84.4% | 66.1%(+18.3)#445 | 62.5%(+21.9)#10,674 |
| 7. | 77094 | 84.0% | 66.1%(+17.9)#465 | 62.5%(+21.5)#11,002 |
| 8. | 77047 | 82.5% | 66.1%(+16.4)#523 | 62.5%(+20.0)#12,181 |
| 9. | 77029 | 82.4% | 66.1%(+16.3)#529 | 62.5%(+19.9)#12,261 |
| 10. | 77062 | 80.8% | 66.1%(+14.7)#609 | 62.5%(+18.3)#13,569 |
| 11. | 77078 | 79.4% | 66.1%(+13.3)#675 | 62.5%(+16.9)#14,678 |
| 12. | 77045 | 78.5% | 66.1%(+12.4)#715 | 62.5%(+16.0)#15,344 |
| 13. | 77028 | 78.3% | 66.1%(+12.2)#728 | 62.5%(+15.8)#15,510 |
| 14. | 77018 | 78.2% | 66.1%(+12.1)#734 | 62.5%(+15.7)#15,596 |
| 15. | 77088 | 77.2% | 66.1%(+11.1)#783 | 62.5%(+14.7)#16,374 |
| 16. | 77049 | 76.9% | 66.1%(+10.8)#792 | 62.5%(+14.4)#16,617 |
| 17. | 77095 | 76.8% | 66.1%(+10.7)#799 | 62.5%(+14.3)#16,706 |
| 18. | 77044 | 75.9% | 66.1%(+9.80)#837 | 62.5%(+13.4)#17,441 |
| 19. | 77089 | 75.6% | 66.1%(+9.50)#858 | 62.5%(+13.1)#17,680 |
| 20. | 77083 | 74.8% | 66.1%(+8.70)#909 | 62.5%(+12.3)#18,295 |
| 21. | 77026 | 74.8% | 66.1%(+8.70)#911 | 62.5%(+12.3)#18,306 |
| 22. | 77085 | 74.4% | 66.1%(+8.30)#929 | 62.5%(+11.9)#18,594 |
| 23. | 77009 | 73.8% | 66.1%(+7.70)#959 | 62.5%(+11.3)#19,009 |
| 24. | 77020 | 72.7% | 66.1%(+6.60)#1,018 | 62.5%(+10.2)#19,813 |
| 25. | 77093 | 71.4% | 66.1%(+5.30)#1,086 | 62.5%(+8.90)#20,711 |
| 26. | 77068 | 71.3% | 66.1%(+5.20)#1,094 | 62.5%(+8.80)#20,817 |
| 27. | 77048 | 70.7% | 66.1%(+4.60)#1,126 | 62.5%(+8.20)#21,217 |
| 28. | 77064 | 70.1% | 66.1%(+4.00)#1,151 | 62.5%(+7.60)#21,578 |
| 29. | 77073 | 69.5% | 66.1%(+3.40)#1,189 | 62.5%(+7.00)#21,967 |
| 30. | 77075 | 69.5% | 66.1%(+3.40)#1,190 | 62.5%(+7.00)#21,968 |
| 31. | 77005 | 69.4% | 66.1%(+3.30)#1,196 | 62.5%(+6.90)#22,041 |
| 32. | 77011 | 67.9% | 66.1%(+1.80)#1,255 | 62.5%(+5.40)#22,886 |
| 33. | 77084 | 67.6% | 66.1%(+1.50)#1,267 | 62.5%(+5.10)#23,041 |
| 34. | 77008 | 66.7% | 66.1%(+0.600)#1,297 | 62.5%(+4.20)#23,536 |
| 35. | 77086 | 65.8% | 66.1%(-0.300)#1,345 | 62.5%(+3.30)#24,045 |
| 36. | 77087 | 65.1% | 66.1%(-1.00)#1,369 | 62.5%(+2.60)#24,402 |
| 37. | 77038 | 64.1% | 66.1%(-2.00)#1,400 | 62.5%(+1.60)#24,848 |
| 38. | 77039 | 63.7% | 66.1%(-2.40)#1,410 | 62.5%(+1.20)#25,012 |
| 39. | 77076 | 62.8% | 66.1%(-3.30)#1,435 | 62.5%(+0.300)#25,411 |
| 40. | 77022 | 62.7% | 66.1%(-3.40)#1,438 | 62.5%(+0.200)#25,456 |
| 41. | 77017 | 61.7% | 66.1%(-4.40)#1,461 | 62.5%(-0.800)#25,832 |
| 42. | 77034 | 60.9% | 66.1%(-5.20)#1,486 | 62.5%(-1.60)#26,122 |
| 43. | 77037 | 60.6% | 66.1%(-5.50)#1,499 | 62.5%(-1.90)#26,243 |
| 44. | 77071 | 57.8% | 66.1%(-8.30)#1,564 | 62.5%(-4.70)#27,230 |
| 45. | 77023 | 57.5% | 66.1%(-8.60)#1,572 | 62.5%(-5.00)#27,329 |
| 46. | 77069 | 57.3% | 66.1%(-8.80)#1,579 | 62.5%(-5.20)#27,389 |
| 47. | 77050 | 57.0% | 66.1%(-9.10)#1,588 | 62.5%(-5.50)#27,495 |
| 48. | 77015 | 56.1% | 66.1%(-10.00)#1,608 | 62.5%(-6.40)#27,762 |
| 49. | 77067 | 56.1% | 66.1%(-10.00)#1,609 | 62.5%(-6.40)#27,767 |
| 50. | 77021 | 55.7% | 66.1%(-10.4)#1,620 | 62.5%(-6.80)#27,871 |
| 51. | 77070 | 55.0% | 66.1%(-11.1)#1,632 | 62.5%(-7.50)#28,061 |
| 52. | 77040 | 53.7% | 66.1%(-12.4)#1,650 | 62.5%(-8.80)#28,372 |
| 53. | 77012 | 53.4% | 66.1%(-12.7)#1,654 | 62.5%(-9.10)#28,458 |
| 54. | 77051 | 52.9% | 66.1%(-13.2)#1,658 | 62.5%(-9.60)#28,573 |
| 55. | 77096 | 52.5% | 66.1%(-13.6)#1,664 | 62.5%(-10.00)#28,648 |
| 56. | 77043 | 52.2% | 66.1%(-13.9)#1,669 | 62.5%(-10.3)#28,727 |
| 57. | 77065 | 51.6% | 66.1%(-14.5)#1,676 | 62.5%(-10.9)#28,843 |
| 58. | 77014 | 50.1% | 66.1%(-16.0)#1,694 | 62.5%(-12.4)#29,122 |
| 59. | 77031 | 50.1% | 66.1%(-16.0)#1,695 | 62.5%(-12.4)#29,127 |
| 60. | 77080 | 48.3% | 66.1%(-17.8)#1,715 | 62.5%(-14.2)#29,442 |
| 61. | 77024 | 48.2% | 66.1%(-17.9)#1,718 | 62.5%(-14.3)#29,465 |
| 62. | 77013 | 47.7% | 66.1%(-18.4)#1,723 | 62.5%(-14.8)#29,549 |
| 63. | 77035 | 47.2% | 66.1%(-18.9)#1,728 | 62.5%(-15.3)#29,618 |
| 64. | 77072 | 46.9% | 66.1%(-19.2)#1,732 | 62.5%(-15.6)#29,666 |
| 65. | 77055 | 46.6% | 66.1%(-19.5)#1,736 | 62.5%(-15.9)#29,708 |
| 66. | 77091 | 46.4% | 66.1%(-19.7)#1,740 | 62.5%(-16.1)#29,734 |
| 67. | 77079 | 43.4% | 66.1%(-22.7)#1,765 | 62.5%(-19.1)#30,147 |
| 68. | 77061 | 42.2% | 66.1%(-23.9)#1,773 | 62.5%(-20.3)#30,284 |
| 69. | 77099 | 42.0% | 66.1%(-24.1)#1,774 | 62.5%(-20.5)#30,310 |
| 70. | 77092 | 40.8% | 66.1%(-25.3)#1,778 | 62.5%(-21.7)#30,449 |
| 71. | 77025 | 39.7% | 66.1%(-26.4)#1,783 | 62.5%(-22.8)#30,583 |
| 72. | 77082 | 38.4% | 66.1%(-27.7)#1,788 | 62.5%(-24.1)#30,705 |
| 73. | 77007 | 37.8% | 66.1%(-28.3)#1,790 | 62.5%(-24.7)#30,752 |
| 74. | 77032 | 36.8% | 66.1%(-29.3)#1,794 | 62.5%(-25.7)#30,830 |
| 75. | 77004 | 36.1% | 66.1%(-30.0)#1,799 | 62.5%(-26.4)#30,878 |
| 76. | 77003 | 36.0% | 66.1%(-30.1)#1,800 | 62.5%(-26.5)#30,895 |
| 77. | 77077 | 33.9% | 66.1%(-32.2)#1,809 | 62.5%(-28.6)#31,041 |
| 78. | 77074 | 33.8% | 66.1%(-32.3)#1,810 | 62.5%(-28.7)#31,054 |
| 79. | 77060 | 29.8% | 66.1%(-36.3)#1,817 | 62.5%(-32.7)#31,316 |
| 80. | 77090 | 28.8% | 66.1%(-37.3)#1,823 | 62.5%(-33.7)#31,367 |
| 81. | 77019 | 27.4% | 66.1%(-38.7)#1,827 | 62.5%(-35.1)#31,437 |
| 82. | 77030 | 24.5% | 66.1%(-41.6)#1,831 | 62.5%(-38.0)#31,576 |
| 83. | 77006 | 21.9% | 66.1%(-44.2)#1,839 | 62.5%(-40.6)#31,689 |
| 84. | 77098 | 20.7% | 66.1%(-45.4)#1,842 | 62.5%(-41.8)#31,733 |
| 85. | 77056 | 20.0% | 66.1%(-46.1)#1,844 | 62.5%(-42.5)#31,755 |
| 86. | 77036 | 19.1% | 66.1%(-47.0)#1,849 | 62.5%(-43.4)#31,795 |
| 87. | 77058 | 18.2% | 66.1%(-47.9)#1,855 | 62.5%(-44.3)#31,832 |
| 88. | 77042 | 17.9% | 66.1%(-48.2)#1,856 | 62.5%(-44.6)#31,847 |
| 89. | 77027 | 17.2% | 66.1%(-48.9)#1,858 | 62.5%(-45.3)#31,871 |
| 90. | 77063 | 13.4% | 66.1%(-52.7)#1,868 | 62.5%(-49.1)#31,995 |
| 91. | 77057 | 12.8% | 66.1%(-53.3)#1,870 | 62.5%(-49.7)#32,014 |
| 92. | 77081 | 7.9% | 66.1%(-58.2)#1,878 | 62.5%(-54.6)#32,206 |
| 93. | 77054 | 5.0% | 66.1%(-61.1)#1,883 | 62.5%(-57.5)#32,304 |
| 94. | 77046 | 2.9% | 66.1%(-63.2)#1,887 | 62.5%(-59.6)#32,402 |
| 95. | 77002 | 2.4% | 66.1%(-63.7)#1,888 | 62.5%(-60.1)#32,424 |
1
Common Questions
What are the Top 10 Zip Codes with the Highest Percentage of Households Residing in Detached Homes in Houston, TX?
Top 10 Zip Codes with the Highest Percentage of Households Residing in Detached Homes in Houston, TX are:
What zip code has the Highest Percentage of Households Residing in Detached Homes in Houston, TX?
77059 has the Highest Percentage of Households Residing in Detached Homes in Houston, TX with 95.3%.
What is the Percentage of Households Residing in Detached Homes in Houston, TX?
Percentage of Households Residing in Detached Homes in Houston is 45.1%.
What is the Percentage of Households Residing in Detached Homes in Texas?
Percentage of Households Residing in Detached Homes in Texas is 66.1%.
What is the Percentage of Households Residing in Detached Homes in the United States?
Percentage of Households Residing in Detached Homes in the United States is 62.5%.