Zip Codes with the Most Immigrants from Bangladesh in Houston, TX

RELATED REPORTS & OPTIONS

Bangladesh
Population
Families and Households
Female Fertility
Female Fertility (Unmarried)
Race (Community Size)
Race (Percentage)
Ancestry (Community Size)
AfghanAfricanAlaska NativeAlaskan AthabascanAlbanianAlsatianAmericanApacheArabArgentineanArmenianAssyrian / Chaldean / SyriacAustralianAustrianBahamianBangladeshiBarbadianBasqueBelgianBelizeanBermudanBhutaneseBlackfeetBolivianBrazilianBritishBritish West IndianBulgarianBurmeseCajunCambodianCanadianCape VerdeanCelticCentral AmericanCentral American IndianCherokeeChickasawChileanChippewaChoctawColombianComancheCosta RicanCreekCroatianCubanCypriotCzechCzechoslovakianDanishDelawareDominicanDutchDutch West IndianEastern EuropeanEcuadorianEgyptianEnglishEstonianEthiopianEuropeanFilipinoFinnishFrenchFrench American IndianFrench CanadianGermanGhanaianGreekGuamanian / ChamorroGuatemalanGuyaneseHaitianHonduranHoumaHungarianIcelanderIndian (Asian)IndonesianInupiatIranianIraqiIrishIroquoisIsraeliItalianJamaicanJapaneseJordanianKenyanKiowaKoreanLaotianLatvianLebaneseLiberianLithuanianLumbeeLuxembourgerMacedonianMalaysianMalteseMexicanMexican American IndianMongolianMoroccanNative HawaiianNavajoNew ZealanderNicaraguanNigerianNorthern EuropeanNorwegianOkinawanOsagePakistaniPalestinianPanamanianParaguayanPennsylvania GermanPeruvianPolishPortuguesePotawatomiPuebloPuerto RicanRomanianRussianSalvadoranSamoanScandinavianScotch-IrishScottishSeminoleSenegaleseSerbianSierra LeoneanSiouxSlavicSlovakSloveneSomaliSouth AfricanSouth AmericanSouth American IndianSoviet UnionSpaniardSpanishSpanish AmericanSpanish American IndianSri LankanSubsaharan AfricanSudaneseSwedishSwissSyrianThaiTrinidadian and TobagonianTurkishU.S. Virgin IslanderUgandanUkrainianUruguayanUteVenezuelanVietnameseWelshWest IndianYaquiYugoslavian
Ancestry (Percentage)
AfghanAfricanAlaska NativeAlaskan AthabascanAlbanianAlsatianAmericanApacheArabArgentineanArmenianAssyrian / Chaldean / SyriacAustralianAustrianBahamianBangladeshiBarbadianBasqueBelgianBelizeanBermudanBhutaneseBlackfeetBolivianBrazilianBritishBritish West IndianBulgarianBurmeseCajunCambodianCanadianCape VerdeanCelticCentral AmericanCentral American IndianCherokeeChickasawChileanChippewaChoctawColombianComancheCosta RicanCreekCroatianCubanCypriotCzechCzechoslovakianDanishDelawareDominicanDutchDutch West IndianEastern EuropeanEcuadorianEgyptianEnglishEstonianEthiopianEuropeanFilipinoFinnishFrenchFrench American IndianFrench CanadianGermanGhanaianGreekGuamanian / ChamorroGuatemalanGuyaneseHaitianHonduranHoumaHungarianIcelanderIndian (Asian)IndonesianInupiatIranianIraqiIrishIroquoisIsraeliItalianJamaicanJapaneseJordanianKenyanKiowaKoreanLaotianLatvianLebaneseLiberianLithuanianLumbeeLuxembourgerMacedonianMalaysianMalteseMexicanMexican American IndianMongolianMoroccanNative HawaiianNavajoNew ZealanderNicaraguanNigerianNorthern EuropeanNorwegianOkinawanOsagePakistaniPalestinianPanamanianParaguayanPennsylvania GermanPeruvianPolishPortuguesePotawatomiPuebloPuerto RicanRomanianRussianSalvadoranSamoanScandinavianScotch-IrishScottishSeminoleSenegaleseSerbianSierra LeoneanSiouxSlavicSlovakSloveneSomaliSouth AfricanSouth AmericanSouth American IndianSoviet UnionSpaniardSpanishSpanish AmericanSpanish American IndianSri LankanSubsaharan AfricanSudaneseSwedishSwissSyrianThaiTrinidadian and TobagonianTurkishU.S. Virgin IslanderUgandanUkrainianUruguayanUteVenezuelanVietnameseWelshWest IndianYaquiYugoslavian
Immigrant Origin (Total)
AfghanistanAfricaAlbaniaArgentinaArmeniaAsiaAustraliaAustriaBahamasBangladeshBarbadosBelarusBelgiumBelizeBoliviaBosnia and HerzegovinaBrazilBulgariaBurma / MyanmarCambodiaCameroonCanadaCaribbeanCentral AmericaChileChinaColombiaCongoCosta RicaCroatiaCubaCzechoslovakiaDenmarkDominicaDominican RepublicEastern AfricaEastern AsiaEastern EuropeEcuadorEgyptEl SalvadorEnglandEritreaEthiopiaEuropeFranceGermanyGhanaGreeceGrenadaGuatemalaGuyanaHaitiHondurasHong KongHungaryIndiaIndonesiaIranIraqIrelandIsraelItalyJamaicaJapanJordanKazakhstanKenyaKoreaKuwaitLaosLatin AmericaLatviaLebanonLiberiaMalaysiaMexicoMicronesiaMiddle AfricaMoroccoNepalNetherlandsNicaraguaNigeriaNorth MacedoniaNorthern AfricaNorthern EuropeNorwayOceaniaPakistanPanamaPeruPhilippinesPolandPortugalRomaniaRussiaSaudi ArabiaScotlandSenegalSerbiaSierra LeoneSingaporeSomaliaSouth AfricaSouth AmericaSouth Central AsiaSouth Eastern AsiaSouthern EuropeSpainSri LankaSt. Vincent and the GrenadinesSudanSwedenSwitzerlandSyriaTaiwanThailandTrinidad and TobagoTurkeyUgandaUkraineUruguayUzbekistanVenezuelaVietnamWest IndiesWestern AfricaWestern AsiaWestern EuropeYemenZaireZimbabwe
Immigrant Origin (Percentage)
AfghanistanAfricaAlbaniaArgentinaArmeniaAsiaAustraliaAustriaBahamasBangladeshBarbadosBelarusBelgiumBelizeBoliviaBosnia and HerzegovinaBrazilBulgariaBurma / MyanmarCambodiaCameroonCanadaCaribbeanCentral AmericaChileChinaColombiaCongoCosta RicaCroatiaCubaCzechoslovakiaDenmarkDominicaDominican RepublicEastern AfricaEastern AsiaEastern EuropeEcuadorEgyptEl SalvadorEnglandEritreaEthiopiaEuropeFranceGermanyGhanaGreeceGrenadaGuatemalaGuyanaHaitiHondurasHong KongHungaryIndiaIndonesiaIranIraqIrelandIsraelItalyJamaicaJapanJordanKazakhstanKenyaKoreaKuwaitLaosLatin AmericaLatviaLebanonLiberiaMalaysiaMexicoMicronesiaMiddle AfricaMoroccoNepalNetherlandsNicaraguaNigeriaNorth MacedoniaNorthern AfricaNorthern EuropeNorwayOceaniaPakistanPanamaPeruPhilippinesPolandPortugalRomaniaRussiaSaudi ArabiaScotlandSenegalSerbiaSierra LeoneSingaporeSomaliaSouth AfricaSouth AmericaSouth Central AsiaSouth Eastern AsiaSouthern EuropeSpainSri LankaSt. Vincent and the GrenadinesSudanSwedenSwitzerlandSyriaTaiwanThailandTrinidad and TobagoTurkeyUgandaUkraineUruguayUzbekistanVenezuelaVietnamWest IndiesWestern AfricaWestern AsiaWestern EuropeYemenZaireZimbabwe
Income
Income (Families)
Income (Households)
Poverty
Poverty (Families)
Unemployment
Employment Occupations
Employment Industries
Employer Class
Commute Time
Commute Means
School Enrollment
Education by Degree Field
Occupancy
Finances
Physical Characteristics
Houston
Compare Zip Codes
Comparison Subject

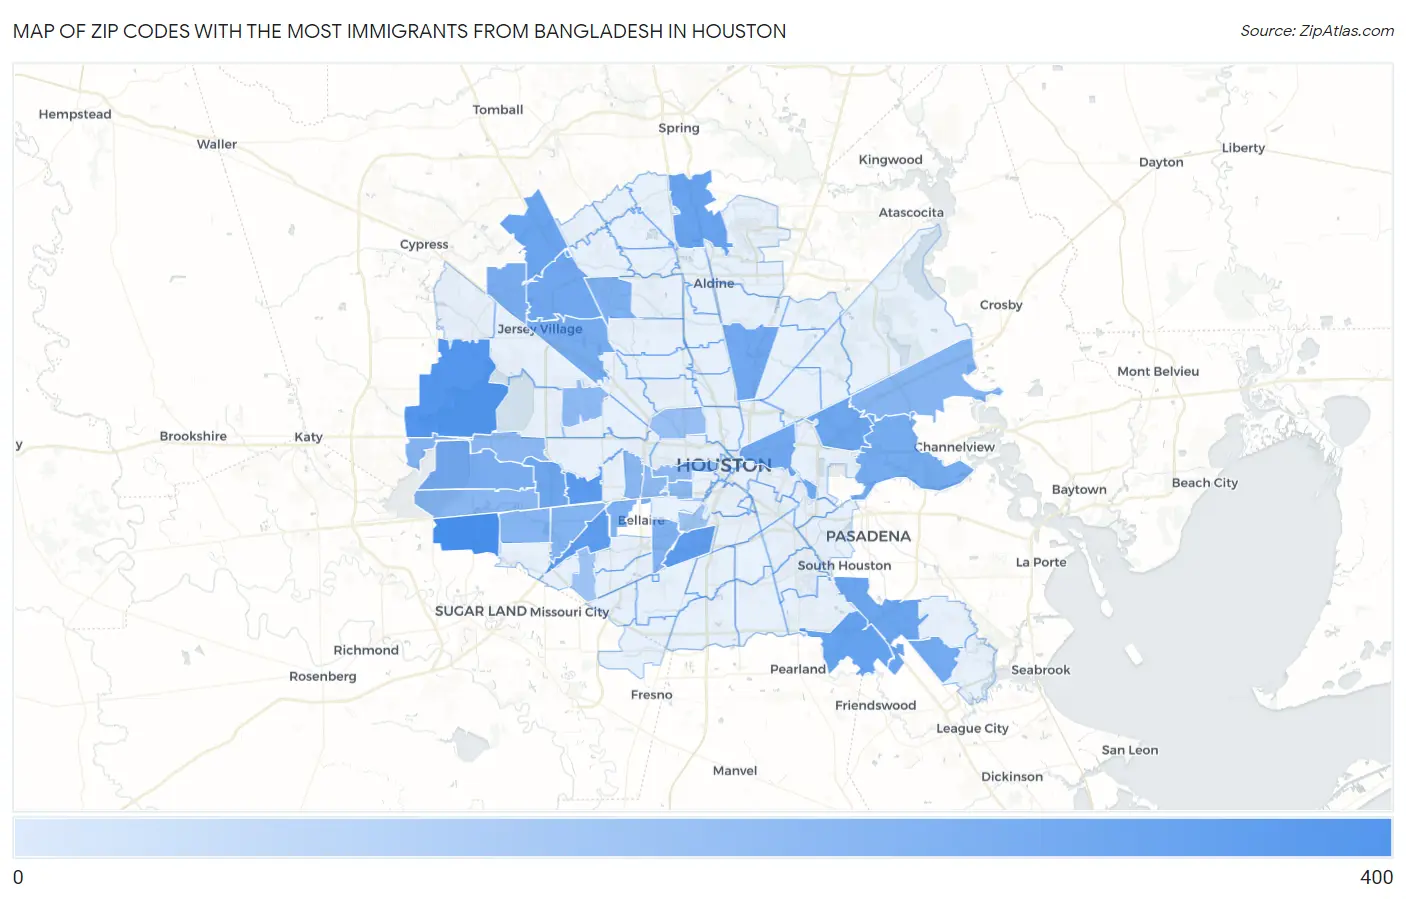
Map of Zip Codes with the Most Immigrants from Bangladesh in Houston

0
400
Zip Codes with the Most Immigrants from Bangladesh in Houston Map

Zip Codes with the Most Immigrants from Bangladesh in Houston, TX

Zip Code Bangladesh vs State vs National
1.7708338016,549(2.30%)#4271,479(0.14%)#100
2.7708421116,549(1.28%)#17271,479(0.08%)#209
3.7706317316,549(1.05%)#23271,479(0.06%)#268
4.7707415616,549(0.94%)#27271,479(0.06%)#314
5.7705415616,549(0.94%)#28271,479(0.06%)#316
6.7708911716,549(0.71%)#41271,479(0.04%)#443
7.7707310816,549(0.65%)#47271,479(0.04%)#488
8.770708816,549(0.53%)#57271,479(0.03%)#604
9.770348816,549(0.53%)#59271,479(0.03%)#606
10.770138316,549(0.50%)#66271,479(0.03%)#648
11.770427816,549(0.47%)#69271,479(0.03%)#677
12.770647316,549(0.44%)#72271,479(0.03%)#717
13.770207116,549(0.43%)#73271,479(0.03%)#733
14.770937016,549(0.42%)#74271,479(0.03%)#739
15.770626416,549(0.39%)#76271,479(0.02%)#798
16.770155916,549(0.36%)#82271,479(0.02%)#846
17.770405416,549(0.33%)#90271,479(0.02%)#915
18.770775216,549(0.31%)#92271,479(0.02%)#938
19.770655116,549(0.31%)#94271,479(0.02%)#955
20.770814016,549(0.24%)#106271,479(0.01%)#1,121
21.770864016,549(0.24%)#107271,479(0.01%)#1,127
22.770253716,549(0.22%)#112271,479(0.01%)#1,188
23.770363616,549(0.22%)#114271,479(0.01%)#1,199
24.770943616,549(0.22%)#116271,479(0.01%)#1,217
25.770723216,549(0.19%)#121271,479(0.01%)#1,300
26.770493216,549(0.19%)#122271,479(0.01%)#1,303
27.770562616,549(0.16%)#135271,479(0.01%)#1,463
28.770822516,549(0.15%)#139271,479(0.01%)#1,481
29.770982516,549(0.15%)#140271,479(0.01%)#1,501
30.770792416,549(0.15%)#144271,479(0.01%)#1,521
31.770802116,549(0.13%)#155271,479(0.01%)#1,624
32.770192116,549(0.13%)#160271,479(0.01%)#1,638
33.770272116,549(0.13%)#161271,479(0.01%)#1,642
34.770081516,549(0.09%)#180271,479(0.01%)#1,870
35.770711116,549(0.07%)#197271,479(0.00%)#2,057
36.770301116,549(0.07%)#199271,479(0.00%)#2,069

Common Questions

What are the Top 10 Zip Codes with the Most Immigrants from Bangladesh in Houston, TX?
Top 10 Zip Codes with the Most Immigrants from Bangladesh in Houston, TX are:
#1
380
#2
211
#3
173
#4
156
#5
156
#6
117
#7
108
#8
88
#9
88
#10
83
What zip code has the Most Immigrants from Bangladesh in Houston, TX?
77083 has the Most Immigrants from Bangladesh in Houston, TX with 380.
What is the Total Immigrants from Bangladesh in Houston, TX?
Total Immigrants from Bangladesh in Houston is 1,554.
What is the Total Immigrants from Bangladesh in Texas?
Total Immigrants from Bangladesh in Texas is 16,549.
What is the Total Immigrants from Bangladesh in the United States?
Total Immigrants from Bangladesh in the United States is 271,479.