Zip Codes with the Largest West Indian Community in Houston, TX

RELATED REPORTS & OPTIONS

West Indian
Population
Families and Households
Female Fertility
Female Fertility (Unmarried)
Race (Community Size)
Race (Percentage)
Ancestry (Community Size)
AfghanAfricanAlaska NativeAlaskan AthabascanAlbanianAlsatianAmericanApacheArabArgentineanArmenianAssyrian / Chaldean / SyriacAustralianAustrianBahamianBangladeshiBarbadianBasqueBelgianBelizeanBermudanBhutaneseBlackfeetBolivianBrazilianBritishBritish West IndianBulgarianBurmeseCajunCambodianCanadianCape VerdeanCelticCentral AmericanCentral American IndianCherokeeChickasawChileanChippewaChoctawColombianComancheCosta RicanCreekCroatianCubanCypriotCzechCzechoslovakianDanishDelawareDominicanDutchDutch West IndianEastern EuropeanEcuadorianEgyptianEnglishEstonianEthiopianEuropeanFilipinoFinnishFrenchFrench American IndianFrench CanadianGermanGhanaianGreekGuamanian / ChamorroGuatemalanGuyaneseHaitianHonduranHoumaHungarianIcelanderIndian (Asian)IndonesianInupiatIranianIraqiIrishIroquoisIsraeliItalianJamaicanJapaneseJordanianKenyanKiowaKoreanLaotianLatvianLebaneseLiberianLithuanianLumbeeLuxembourgerMacedonianMalaysianMalteseMexicanMexican American IndianMongolianMoroccanNative HawaiianNavajoNew ZealanderNicaraguanNigerianNorthern EuropeanNorwegianOkinawanOsagePakistaniPalestinianPanamanianParaguayanPennsylvania GermanPeruvianPolishPortuguesePotawatomiPuebloPuerto RicanRomanianRussianSalvadoranSamoanScandinavianScotch-IrishScottishSeminoleSenegaleseSerbianSierra LeoneanSiouxSlavicSlovakSloveneSomaliSouth AfricanSouth AmericanSouth American IndianSoviet UnionSpaniardSpanishSpanish AmericanSpanish American IndianSri LankanSubsaharan AfricanSudaneseSwedishSwissSyrianThaiTrinidadian and TobagonianTurkishU.S. Virgin IslanderUgandanUkrainianUruguayanUteVenezuelanVietnameseWelshWest IndianYaquiYugoslavian
Ancestry (Percentage)
AfghanAfricanAlaska NativeAlaskan AthabascanAlbanianAlsatianAmericanApacheArabArgentineanArmenianAssyrian / Chaldean / SyriacAustralianAustrianBahamianBangladeshiBarbadianBasqueBelgianBelizeanBermudanBhutaneseBlackfeetBolivianBrazilianBritishBritish West IndianBulgarianBurmeseCajunCambodianCanadianCape VerdeanCelticCentral AmericanCentral American IndianCherokeeChickasawChileanChippewaChoctawColombianComancheCosta RicanCreekCroatianCubanCypriotCzechCzechoslovakianDanishDelawareDominicanDutchDutch West IndianEastern EuropeanEcuadorianEgyptianEnglishEstonianEthiopianEuropeanFilipinoFinnishFrenchFrench American IndianFrench CanadianGermanGhanaianGreekGuamanian / ChamorroGuatemalanGuyaneseHaitianHonduranHoumaHungarianIcelanderIndian (Asian)IndonesianInupiatIranianIraqiIrishIroquoisIsraeliItalianJamaicanJapaneseJordanianKenyanKiowaKoreanLaotianLatvianLebaneseLiberianLithuanianLumbeeLuxembourgerMacedonianMalaysianMalteseMexicanMexican American IndianMongolianMoroccanNative HawaiianNavajoNew ZealanderNicaraguanNigerianNorthern EuropeanNorwegianOkinawanOsagePakistaniPalestinianPanamanianParaguayanPennsylvania GermanPeruvianPolishPortuguesePotawatomiPuebloPuerto RicanRomanianRussianSalvadoranSamoanScandinavianScotch-IrishScottishSeminoleSenegaleseSerbianSierra LeoneanSiouxSlavicSlovakSloveneSomaliSouth AfricanSouth AmericanSouth American IndianSoviet UnionSpaniardSpanishSpanish AmericanSpanish American IndianSri LankanSubsaharan AfricanSudaneseSwedishSwissSyrianThaiTrinidadian and TobagonianTurkishU.S. Virgin IslanderUgandanUkrainianUruguayanUteVenezuelanVietnameseWelshWest IndianYaquiYugoslavian
Immigrant Origin (Total)
AfghanistanAfricaAlbaniaArgentinaArmeniaAsiaAustraliaAustriaBahamasBangladeshBarbadosBelarusBelgiumBelizeBoliviaBosnia and HerzegovinaBrazilBulgariaBurma / MyanmarCambodiaCameroonCanadaCaribbeanCentral AmericaChileChinaColombiaCongoCosta RicaCroatiaCubaCzechoslovakiaDenmarkDominicaDominican RepublicEastern AfricaEastern AsiaEastern EuropeEcuadorEgyptEl SalvadorEnglandEritreaEthiopiaEuropeFranceGermanyGhanaGreeceGrenadaGuatemalaGuyanaHaitiHondurasHong KongHungaryIndiaIndonesiaIranIraqIrelandIsraelItalyJamaicaJapanJordanKazakhstanKenyaKoreaKuwaitLaosLatin AmericaLatviaLebanonLiberiaMalaysiaMexicoMicronesiaMiddle AfricaMoroccoNepalNetherlandsNicaraguaNigeriaNorth MacedoniaNorthern AfricaNorthern EuropeNorwayOceaniaPakistanPanamaPeruPhilippinesPolandPortugalRomaniaRussiaSaudi ArabiaScotlandSenegalSerbiaSierra LeoneSingaporeSomaliaSouth AfricaSouth AmericaSouth Central AsiaSouth Eastern AsiaSouthern EuropeSpainSri LankaSt. Vincent and the GrenadinesSudanSwedenSwitzerlandSyriaTaiwanThailandTrinidad and TobagoTurkeyUgandaUkraineUruguayUzbekistanVenezuelaVietnamWest IndiesWestern AfricaWestern AsiaWestern EuropeYemenZaireZimbabwe
Immigrant Origin (Percentage)
AfghanistanAfricaAlbaniaArgentinaArmeniaAsiaAustraliaAustriaBahamasBangladeshBarbadosBelarusBelgiumBelizeBoliviaBosnia and HerzegovinaBrazilBulgariaBurma / MyanmarCambodiaCameroonCanadaCaribbeanCentral AmericaChileChinaColombiaCongoCosta RicaCroatiaCubaCzechoslovakiaDenmarkDominicaDominican RepublicEastern AfricaEastern AsiaEastern EuropeEcuadorEgyptEl SalvadorEnglandEritreaEthiopiaEuropeFranceGermanyGhanaGreeceGrenadaGuatemalaGuyanaHaitiHondurasHong KongHungaryIndiaIndonesiaIranIraqIrelandIsraelItalyJamaicaJapanJordanKazakhstanKenyaKoreaKuwaitLaosLatin AmericaLatviaLebanonLiberiaMalaysiaMexicoMicronesiaMiddle AfricaMoroccoNepalNetherlandsNicaraguaNigeriaNorth MacedoniaNorthern AfricaNorthern EuropeNorwayOceaniaPakistanPanamaPeruPhilippinesPolandPortugalRomaniaRussiaSaudi ArabiaScotlandSenegalSerbiaSierra LeoneSingaporeSomaliaSouth AfricaSouth AmericaSouth Central AsiaSouth Eastern AsiaSouthern EuropeSpainSri LankaSt. Vincent and the GrenadinesSudanSwedenSwitzerlandSyriaTaiwanThailandTrinidad and TobagoTurkeyUgandaUkraineUruguayUzbekistanVenezuelaVietnamWest IndiesWestern AfricaWestern AsiaWestern EuropeYemenZaireZimbabwe
Income
Income (Families)
Income (Households)
Poverty
Poverty (Families)
Unemployment
Employment Occupations
Employment Industries
Employer Class
Commute Time
Commute Means
School Enrollment
Education by Degree Field
Occupancy
Finances
Physical Characteristics
Houston
Compare Zip Codes
Comparison Subject

Map of Zip Codes with the Largest West Indian Community in Houston

2
526
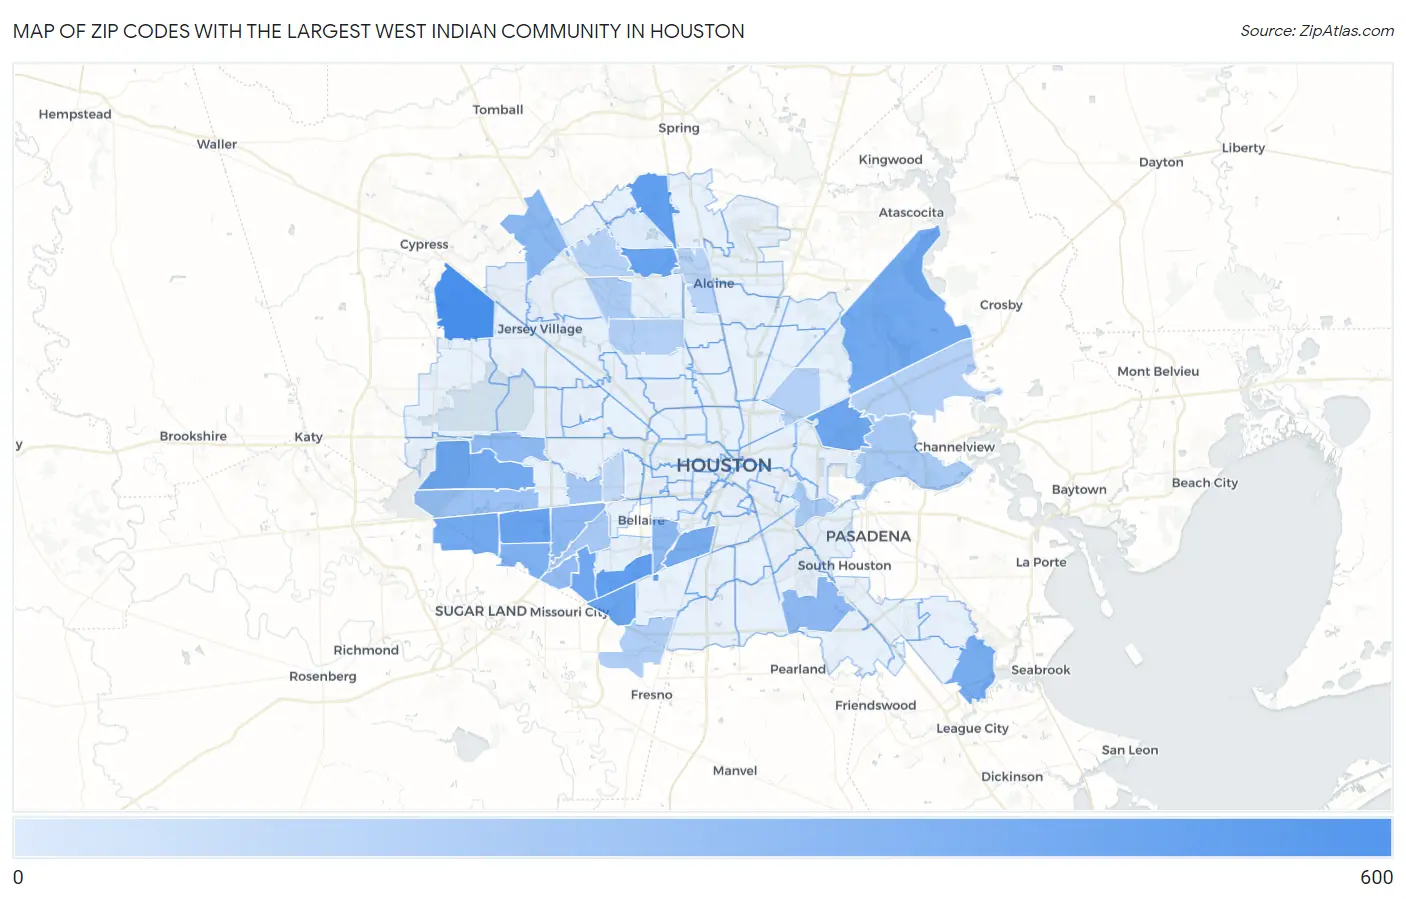
Zip Codes with the Largest West Indian Community in Houston Map

Zip Codes with the Largest West Indian Community in Houston, TX

Zip Code West Indian vs State vs National
1. 77095 526 11,580 (4.54%)#1 267,308 (0.20%)#51
2. 77090 220 11,580 (1.90%)#6 267,308 (0.08%)#216
3. 77035 216 11,580 (1.87%)#7 267,308 (0.08%)#222
4. 77067 194 11,580 (1.68%)#8 267,308 (0.07%)#257
5. 77072 173 11,580 (1.49%)#12 267,308 (0.06%)#306
6. 77085 160 11,580 (1.38%)#13 267,308 (0.06%)#339
7. 77013 139 11,580 (1.20%)#16 267,308 (0.05%)#402
8. 77071 125 11,580 (1.08%)#18 267,308 (0.05%)#455
9. 77044 120 11,580 (1.04%)#20 267,308 (0.04%)#473
10. 77077 116 11,580 (1.00%)#21 267,308 (0.04%)#498
11. 77083 114 11,580 (0.98%)#23 267,308 (0.04%)#512
12. 77058 98 11,580 (0.85%)#29 267,308 (0.04%)#616
13. 77054 97 11,580 (0.84%)#30 267,308 (0.04%)#622
14. 77099 79 11,580 (0.68%)#40 267,308 (0.03%)#767
15. 77070 53 11,580 (0.46%)#60 267,308 (0.02%)#1,119
16. 77036 47 11,580 (0.41%)#71 267,308 (0.02%)#1,229
17. 77075 47 11,580 (0.41%)#74 267,308 (0.02%)#1,234
18. 77025 45 11,580 (0.39%)#79 267,308 (0.02%)#1,296
19. 77079 43 11,580 (0.37%)#81 267,308 (0.02%)#1,330
20. 77031 39 11,580 (0.34%)#88 267,308 (0.01%)#1,447
21. 77082 30 11,580 (0.26%)#113 267,308 (0.01%)#1,716
22. 77063 20 11,580 (0.17%)#148 267,308 (0.01%)#2,162
23. 77074 19 11,580 (0.16%)#152 267,308 (0.01%)#2,223
24. 77015 17 11,580 (0.15%)#158 267,308 (0.01%)#2,347
25. 77012 17 11,580 (0.15%)#161 267,308 (0.01%)#2,392
26. 77086 15 11,580 (0.13%)#171 267,308 (0.01%)#2,500
27. 77053 13 11,580 (0.11%)#176 267,308 (0.00%)#2,649
28. 77088 12 11,580 (0.10%)#180 267,308 (0.00%)#2,701
29. 77049 12 11,580 (0.10%)#182 267,308 (0.00%)#2,715
30. 77028 12 11,580 (0.10%)#184 267,308 (0.00%)#2,764
31. 77066 11 11,580 (0.09%)#189 267,308 (0.00%)#2,838
32. 77060 10 11,580 (0.09%)#200 267,308 (0.00%)#2,942
33. 77057 7 11,580 (0.06%)#216 267,308 (0.00%)#3,266
34. 77014 2 11,580 (0.02%)#237 267,308 (0.00%)#3,720

Common Questions

What are the Top 10 Zip Codes with the Largest West Indian Community in Houston, TX?
Top 10 Zip Codes with the Largest West Indian Community in Houston, TX are:
#1
526
#2
220
#3
216
#4
194
#5
173
#6
160
#7
139
#8
125
#9
120
#10
116
What zip code has the Largest West Indian Community in Houston, TX?
77095 has the Largest West Indian Community in Houston, TX with 526.
What is the Total West Indian Population in Houston, TX?
Total West Indian Population in Houston is 1,612.
What is the Total West Indian Population in Texas?
Total West Indian Population in Texas is 11,580.
What is the Total West Indian Population in the United States?
Total West Indian Population in the United States is 267,308.