Zip Codes with the Highest Percentage of Immigrants from Eastern Asia in Houston, TX
RELATED REPORTS & OPTIONS
Eastern Asia
Houston
Compare Zip Codes
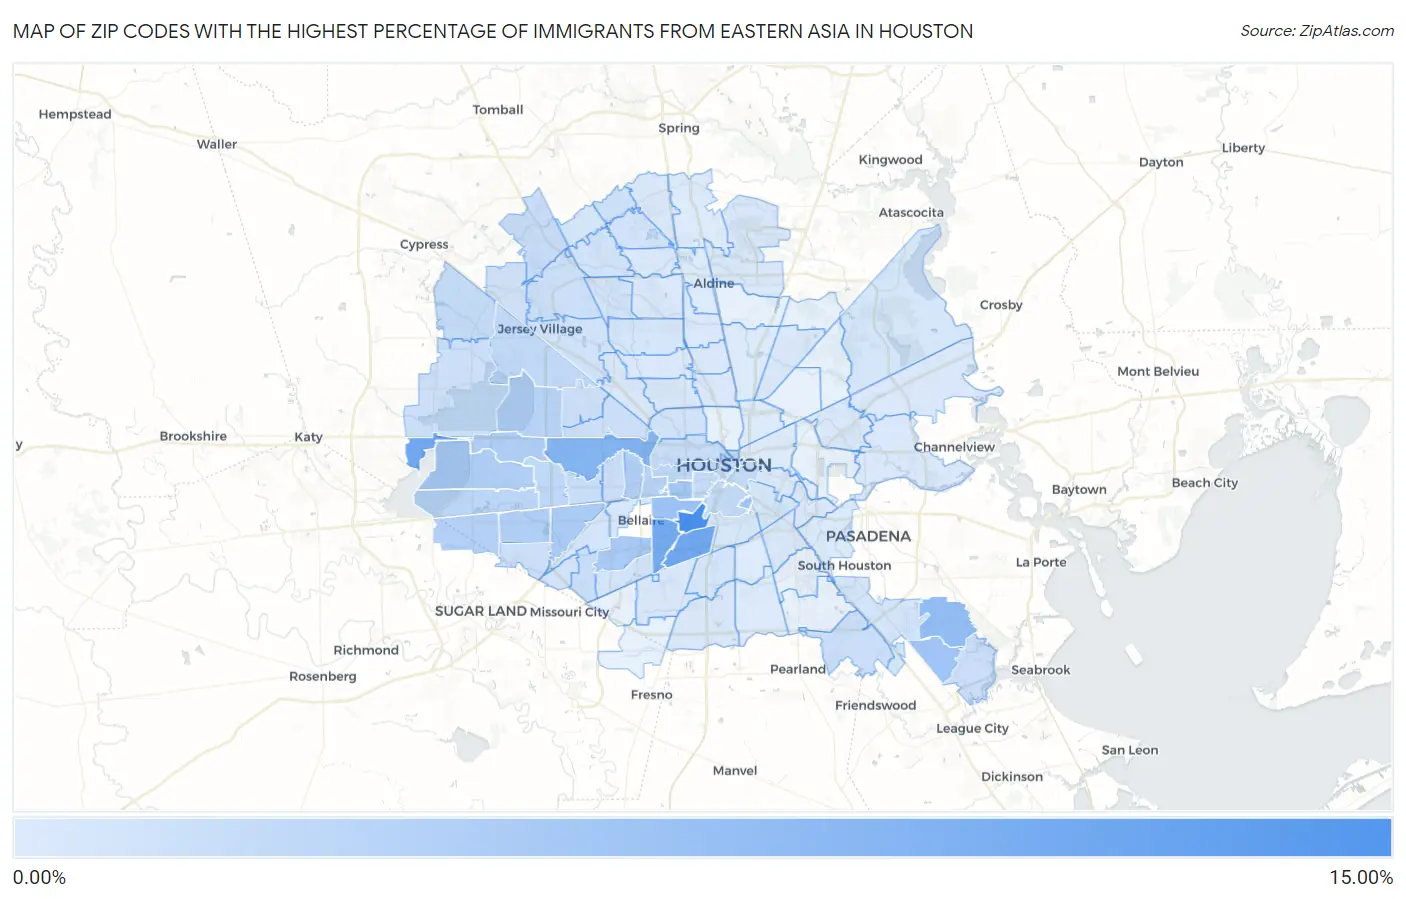
Map of Zip Codes with the Highest Percentage of Immigrants from Eastern Asia in Houston
0.028%
10.10%
Zip Codes with the Highest Percentage of Immigrants from Eastern Asia in Houston, TX
| Zip Code | Eastern Asia | vs State | vs National | |
| 1. | 77030 | 10.10% | 0.79%(+9.31)#1 | 1.28%(+8.82)#255 |
| 2. | 77054 | 7.25% | 0.79%(+6.46)#5 | 1.28%(+5.97)#437 |
| 3. | 77094 | 7.17% | 0.79%(+6.38)#6 | 1.28%(+5.90)#444 |
| 4. | 77025 | 6.87% | 0.79%(+6.08)#8 | 1.28%(+5.59)#472 |
| 5. | 77024 | 5.95% | 0.79%(+5.16)#12 | 1.28%(+4.68)#584 |
| 6. | 77046 | 5.58% | 0.79%(+4.79)#16 | 1.28%(+4.31)#633 |
| 7. | 77059 | 4.81% | 0.79%(+4.02)#20 | 1.28%(+3.54)#761 |
| 8. | 77005 | 4.41% | 0.79%(+3.62)#22 | 1.28%(+3.14)#836 |
| 9. | 77062 | 3.92% | 0.79%(+3.13)#26 | 1.28%(+2.65)#991 |
| 10. | 77204 | 3.90% | 0.79%(+3.11)#27 | 1.28%(+2.62)#999 |
| 11. | 77098 | 3.75% | 0.79%(+2.96)#30 | 1.28%(+2.48)#1,040 |
| 12. | 77096 | 3.38% | 0.79%(+2.59)#38 | 1.28%(+2.11)#1,165 |
| 13. | 77036 | 3.36% | 0.79%(+2.57)#40 | 1.28%(+2.09)#1,172 |
| 14. | 77077 | 3.08% | 0.79%(+2.29)#47 | 1.28%(+1.80)#1,295 |
| 15. | 77079 | 3.04% | 0.79%(+2.25)#48 | 1.28%(+1.76)#1,311 |
| 16. | 77056 | 2.81% | 0.79%(+2.02)#57 | 1.28%(+1.53)#1,415 |
| 17. | 77072 | 2.78% | 0.79%(+1.99)#59 | 1.28%(+1.50)#1,428 |
| 18. | 77083 | 2.68% | 0.79%(+1.88)#64 | 1.28%(+1.40)#1,492 |
| 19. | 77043 | 2.42% | 0.79%(+1.63)#74 | 1.28%(+1.15)#1,656 |
| 20. | 77027 | 2.34% | 0.79%(+1.55)#78 | 1.28%(+1.07)#1,719 |
| 21. | 77082 | 2.07% | 0.79%(+1.28)#92 | 1.28%(+0.799)#1,923 |
| 22. | 77019 | 2.04% | 0.79%(+1.25)#93 | 1.28%(+0.769)#1,956 |
| 23. | 77042 | 1.89% | 0.79%(+1.10)#103 | 1.28%(+0.614)#2,117 |
| 24. | 77041 | 1.83% | 0.79%(+1.04)#106 | 1.28%(+0.557)#2,194 |
| 25. | 77006 | 1.64% | 0.79%(+0.846)#124 | 1.28%(+0.361)#2,462 |
| 26. | 77003 | 1.63% | 0.79%(+0.841)#125 | 1.28%(+0.357)#2,468 |
| 27. | 77004 | 1.60% | 0.79%(+0.805)#126 | 1.28%(+0.321)#2,516 |
| 28. | 77095 | 1.52% | 0.79%(+0.731)#130 | 1.28%(+0.246)#2,636 |
| 29. | 77002 | 1.52% | 0.79%(+0.725)#131 | 1.28%(+0.240)#2,644 |
| 30. | 77071 | 1.42% | 0.79%(+0.624)#136 | 1.28%(+0.140)#2,823 |
| 31. | 77070 | 1.39% | 0.79%(+0.602)#143 | 1.28%(+0.118)#2,872 |
| 32. | 77007 | 1.34% | 0.79%(+0.547)#150 | 1.28%(+0.063)#2,966 |
| 33. | 77063 | 1.32% | 0.79%(+0.526)#156 | 1.28%(+0.042)#3,021 |
| 34. | 77089 | 1.25% | 0.79%(+0.458)#164 | 1.28%(-0.026)#3,162 |
| 35. | 77058 | 1.25% | 0.79%(+0.456)#165 | 1.28%(-0.028)#3,165 |
| 36. | 77057 | 1.22% | 0.79%(+0.432)#172 | 1.28%(-0.052)#3,225 |
| 37. | 77099 | 1.09% | 0.79%(+0.297)#186 | 1.28%(-0.188)#3,604 |
| 38. | 77084 | 1.08% | 0.79%(+0.290)#188 | 1.28%(-0.194)#3,631 |
| 39. | 77055 | 1.03% | 0.79%(+0.239)#195 | 1.28%(-0.245)#3,787 |
| 40. | 77064 | 0.99% | 0.79%(+0.200)#202 | 1.28%(-0.285)#3,933 |
| 41. | 77080 | 0.98% | 0.79%(+0.193)#203 | 1.28%(-0.292)#3,954 |
| 42. | 77068 | 0.86% | 0.79%(+0.064)#229 | 1.28%(-0.420)#4,437 |
| 43. | 77031 | 0.81% | 0.79%(+0.015)#242 | 1.28%(-0.469)#4,667 |
| 44. | 77040 | 0.78% | 0.79%(-0.012)#253 | 1.28%(-0.496)#4,811 |
| 45. | 77008 | 0.76% | 0.79%(-0.033)#257 | 1.28%(-0.517)#4,906 |
| 46. | 77014 | 0.75% | 0.79%(-0.044)#262 | 1.28%(-0.528)#4,975 |
| 47. | 77066 | 0.74% | 0.79%(-0.052)#266 | 1.28%(-0.537)#5,012 |
| 48. | 77065 | 0.73% | 0.79%(-0.061)#269 | 1.28%(-0.545)#5,064 |
| 49. | 77086 | 0.68% | 0.79%(-0.111)#286 | 1.28%(-0.596)#5,354 |
| 50. | 77074 | 0.63% | 0.79%(-0.157)#302 | 1.28%(-0.641)#5,613 |
| 51. | 77035 | 0.63% | 0.79%(-0.161)#304 | 1.28%(-0.645)#5,641 |
| 52. | 77051 | 0.55% | 0.79%(-0.238)#331 | 1.28%(-0.722)#6,158 |
| 53. | 77034 | 0.55% | 0.79%(-0.239)#334 | 1.28%(-0.723)#6,172 |
| 54. | 77021 | 0.50% | 0.79%(-0.289)#353 | 1.28%(-0.774)#6,574 |
| 55. | 77069 | 0.47% | 0.79%(-0.316)#367 | 1.28%(-0.801)#6,817 |
| 56. | 77044 | 0.43% | 0.79%(-0.361)#389 | 1.28%(-0.845)#7,257 |
| 57. | 77088 | 0.39% | 0.79%(-0.399)#409 | 1.28%(-0.883)#7,645 |
| 58. | 77023 | 0.39% | 0.79%(-0.406)#412 | 1.28%(-0.890)#7,740 |
| 59. | 77045 | 0.36% | 0.79%(-0.428)#424 | 1.28%(-0.912)#7,988 |
| 60. | 77092 | 0.35% | 0.79%(-0.442)#439 | 1.28%(-0.926)#8,164 |
| 61. | 77081 | 0.35% | 0.79%(-0.446)#443 | 1.28%(-0.930)#8,202 |
| 62. | 77018 | 0.33% | 0.79%(-0.459)#453 | 1.28%(-0.943)#8,372 |
| 63. | 77090 | 0.28% | 0.79%(-0.514)#494 | 1.28%(-0.998)#9,066 |
| 64. | 77032 | 0.25% | 0.79%(-0.537)#524 | 1.28%(-1.02)#9,391 |
| 65. | 77047 | 0.24% | 0.79%(-0.547)#532 | 1.28%(-1.03)#9,556 |
| 66. | 77016 | 0.22% | 0.79%(-0.567)#547 | 1.28%(-1.05)#9,882 |
| 67. | 77038 | 0.20% | 0.79%(-0.595)#574 | 1.28%(-1.08)#10,343 |
| 68. | 77022 | 0.18% | 0.79%(-0.613)#599 | 1.28%(-1.10)#10,681 |
| 69. | 77015 | 0.15% | 0.79%(-0.641)#628 | 1.28%(-1.13)#11,206 |
| 70. | 77076 | 0.14% | 0.79%(-0.648)#634 | 1.28%(-1.13)#11,320 |
| 71. | 77091 | 0.14% | 0.79%(-0.653)#641 | 1.28%(-1.14)#11,399 |
| 72. | 77011 | 0.12% | 0.79%(-0.672)#659 | 1.28%(-1.16)#11,750 |
| 73. | 77037 | 0.11% | 0.79%(-0.678)#673 | 1.28%(-1.16)#11,893 |
| 74. | 77087 | 0.10% | 0.79%(-0.689)#687 | 1.28%(-1.17)#12,096 |
| 75. | 77067 | 0.089% | 0.79%(-0.702)#707 | 1.28%(-1.19)#12,398 |
| 76. | 77049 | 0.085% | 0.79%(-0.706)#713 | 1.28%(-1.19)#12,490 |
| 77. | 77012 | 0.078% | 0.79%(-0.713)#727 | 1.28%(-1.20)#12,659 |
| 78. | 77013 | 0.076% | 0.79%(-0.716)#732 | 1.28%(-1.20)#12,706 |
| 79. | 77026 | 0.058% | 0.79%(-0.734)#753 | 1.28%(-1.22)#13,085 |
| 80. | 77060 | 0.056% | 0.79%(-0.735)#758 | 1.28%(-1.22)#13,129 |
| 81. | 77048 | 0.056% | 0.79%(-0.736)#760 | 1.28%(-1.22)#13,139 |
| 82. | 77020 | 0.054% | 0.79%(-0.737)#764 | 1.28%(-1.22)#13,164 |
| 83. | 77033 | 0.042% | 0.79%(-0.749)#786 | 1.28%(-1.23)#13,405 |
| 84. | 77073 | 0.041% | 0.79%(-0.751)#792 | 1.28%(-1.24)#13,451 |
| 85. | 77093 | 0.029% | 0.79%(-0.762)#814 | 1.28%(-1.25)#13,676 |
| 86. | 77017 | 0.028% | 0.79%(-0.764)#816 | 1.28%(-1.25)#13,703 |
1
Common Questions
What are the Top 10 Zip Codes with the Highest Percentage of Immigrants from Eastern Asia in Houston, TX?
Top 10 Zip Codes with the Highest Percentage of Immigrants from Eastern Asia in Houston, TX are:
What zip code has the Highest Percentage of Immigrants from Eastern Asia in Houston, TX?
77030 has the Highest Percentage of Immigrants from Eastern Asia in Houston, TX with 10.10%.
What is the Percentage of Immigrants from Eastern Asia in Houston, TX?
Percentage of Immigrants from Eastern Asia in Houston is 1.43%.
What is the Percentage of Immigrants from Eastern Asia in Texas?
Percentage of Immigrants from Eastern Asia in Texas is 0.79%.
What is the Percentage of Immigrants from Eastern Asia in the United States?
Percentage of Immigrants from Eastern Asia in the United States is 1.28%.