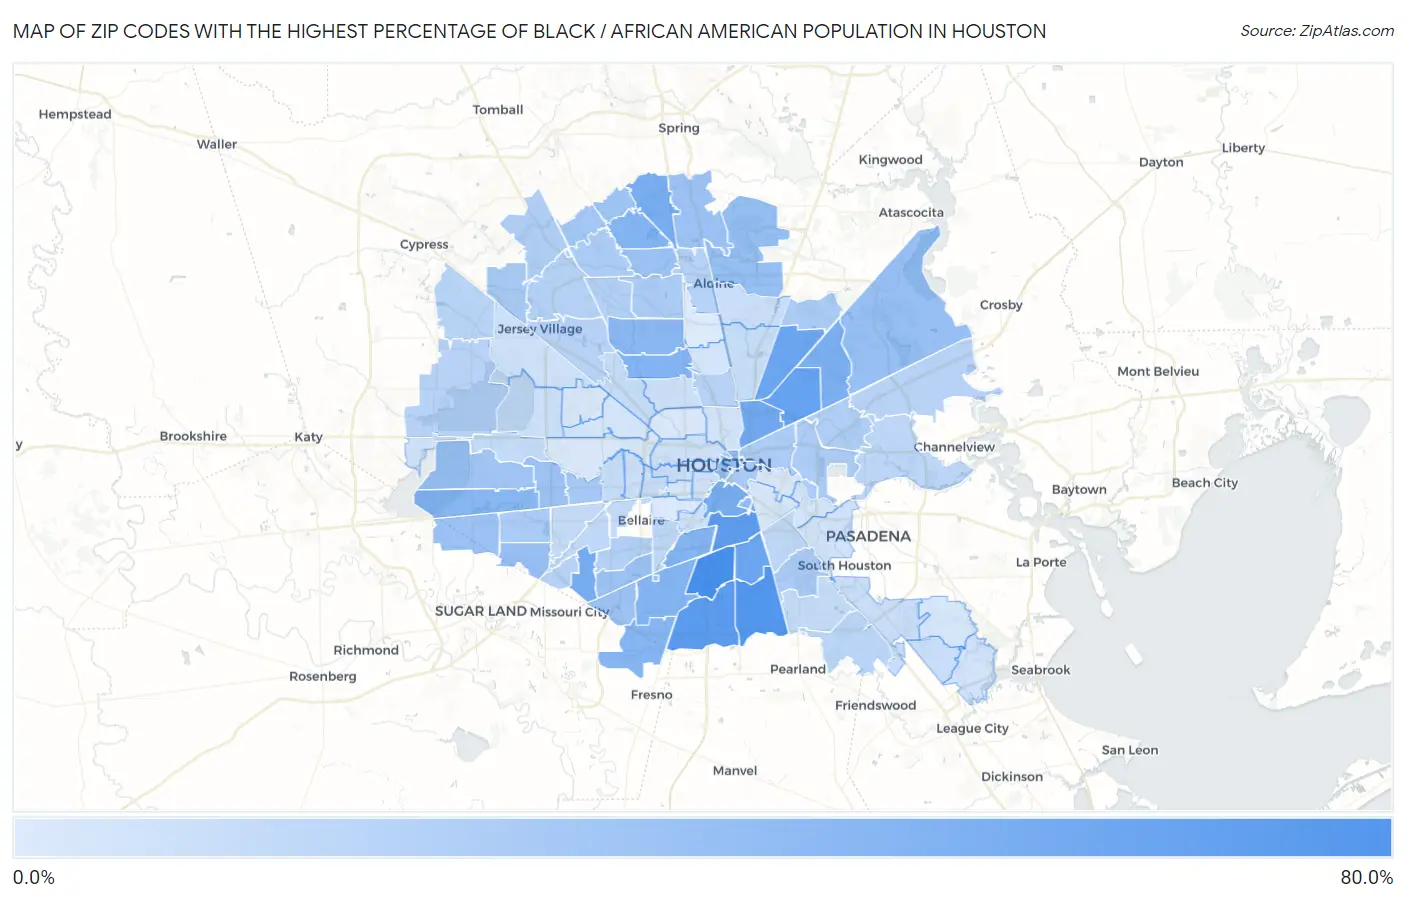
Zip Codes with the Highest Percentage of Black / African American Population in Houston, TX
RELATED REPORTS & OPTIONS
Black / African American
Houston
Compare Zip Codes
Map of Zip Codes with the Highest Percentage of Black / African American Population in Houston
1.6%
78.9%
Zip Codes with the Highest Percentage of Black / African American Population in Houston, TX
| Zip Code | Black / African American | vs State | vs National | |
| 1. | 77051 | 78.9% | 12.1%(+66.7)#7 | 12.5%(+66.4)#354 |
| 2. | 77048 | 71.1% | 12.1%(+58.9)#9 | 12.5%(+58.6)#516 |
| 3. | 77047 | 66.8% | 12.1%(+54.6)#15 | 12.5%(+54.3)#633 |
| 4. | 77021 | 64.1% | 12.1%(+52.0)#19 | 12.5%(+51.6)#723 |
| 5. | 77028 | 59.6% | 12.1%(+47.5)#25 | 12.5%(+47.2)#885 |
| 6. | 77016 | 55.9% | 12.1%(+43.7)#27 | 12.5%(+43.4)#1,006 |
| 7. | 77033 | 55.7% | 12.1%(+43.6)#28 | 12.5%(+43.3)#1,012 |
| 8. | 77026 | 52.5% | 12.1%(+40.3)#32 | 12.5%(+40.0)#1,131 |
| 9. | 77071 | 49.3% | 12.1%(+37.1)#41 | 12.5%(+36.8)#1,302 |
| 10. | 77004 | 49.1% | 12.1%(+36.9)#42 | 12.5%(+36.6)#1,312 |
| 11. | 77090 | 48.6% | 12.1%(+36.4)#43 | 12.5%(+36.1)#1,328 |
| 12. | 77078 | 45.8% | 12.1%(+33.6)#50 | 12.5%(+33.3)#1,473 |
| 13. | 77014 | 42.7% | 12.1%(+30.5)#57 | 12.5%(+30.2)#1,653 |
| 14. | 77054 | 42.3% | 12.1%(+30.1)#62 | 12.5%(+29.8)#1,678 |
| 15. | 77045 | 42.2% | 12.1%(+30.1)#63 | 12.5%(+29.8)#1,680 |
| 16. | 77091 | 42.2% | 12.1%(+30.0)#64 | 12.5%(+29.7)#1,684 |
| 17. | 77053 | 40.9% | 12.1%(+28.8)#68 | 12.5%(+28.5)#1,778 |
| 18. | 77082 | 39.6% | 12.1%(+27.4)#75 | 12.5%(+27.1)#1,876 |
| 19. | 77088 | 39.3% | 12.1%(+27.2)#77 | 12.5%(+26.8)#1,905 |
| 20. | 77204 | 35.1% | 12.1%(+22.9)#90 | 12.5%(+22.6)#2,216 |
| 21. | 77002 | 33.3% | 12.1%(+21.2)#101 | 12.5%(+20.9)#2,353 |
| 22. | 77032 | 33.0% | 12.1%(+20.9)#105 | 12.5%(+20.5)#2,383 |
| 23. | 77044 | 32.4% | 12.1%(+20.2)#111 | 12.5%(+19.9)#2,440 |
| 24. | 77099 | 32.2% | 12.1%(+20.0)#113 | 12.5%(+19.7)#2,455 |
| 25. | 77067 | 31.0% | 12.1%(+18.8)#118 | 12.5%(+18.5)#2,561 |
| 26. | 77073 | 30.9% | 12.1%(+18.7)#120 | 12.5%(+18.4)#2,568 |
| 27. | 77035 | 30.6% | 12.1%(+18.4)#123 | 12.5%(+18.1)#2,591 |
| 28. | 77083 | 30.5% | 12.1%(+18.4)#124 | 12.5%(+18.1)#2,594 |
| 29. | 77042 | 29.9% | 12.1%(+17.7)#127 | 12.5%(+17.4)#2,651 |
| 30. | 77085 | 29.3% | 12.1%(+17.1)#131 | 12.5%(+16.8)#2,719 |
| 31. | 77068 | 28.6% | 12.1%(+16.5)#137 | 12.5%(+16.2)#2,794 |
| 32. | 77077 | 27.4% | 12.1%(+15.2)#148 | 12.5%(+14.9)#2,919 |
| 33. | 77069 | 26.5% | 12.1%(+14.4)#158 | 12.5%(+14.1)#3,030 |
| 34. | 77063 | 25.5% | 12.1%(+13.3)#165 | 12.5%(+13.0)#3,161 |
| 35. | 77065 | 24.0% | 12.1%(+11.9)#181 | 12.5%(+11.5)#3,354 |
| 36. | 77003 | 23.5% | 12.1%(+11.3)#187 | 12.5%(+11.0)#3,418 |
| 37. | 77072 | 23.4% | 12.1%(+11.3)#189 | 12.5%(+11.0)#3,431 |
| 38. | 77050 | 23.3% | 12.1%(+11.2)#191 | 12.5%(+10.9)#3,444 |
| 39. | 77061 | 23.3% | 12.1%(+11.2)#192 | 12.5%(+10.9)#3,446 |
| 40. | 77038 | 22.1% | 12.1%(+9.91)#205 | 12.5%(+9.59)#3,627 |
| 41. | 77029 | 21.8% | 12.1%(+9.69)#214 | 12.5%(+9.37)#3,662 |
| 42. | 77020 | 21.7% | 12.1%(+9.56)#217 | 12.5%(+9.24)#3,683 |
| 43. | 77066 | 21.5% | 12.1%(+9.39)#219 | 12.5%(+9.07)#3,705 |
| 44. | 77013 | 20.3% | 12.1%(+8.14)#238 | 12.5%(+7.81)#3,905 |
| 45. | 77070 | 19.6% | 12.1%(+7.48)#249 | 12.5%(+7.16)#4,023 |
| 46. | 77086 | 19.1% | 12.1%(+6.91)#261 | 12.5%(+6.59)#4,116 |
| 47. | 77096 | 18.3% | 12.1%(+6.20)#272 | 12.5%(+5.88)#4,242 |
| 48. | 77060 | 18.3% | 12.1%(+6.11)#274 | 12.5%(+5.79)#4,262 |
| 49. | 77064 | 18.0% | 12.1%(+5.84)#280 | 12.5%(+5.52)#4,312 |
| 50. | 77031 | 17.2% | 12.1%(+5.10)#298 | 12.5%(+4.78)#4,456 |
| 51. | 77022 | 17.0% | 12.1%(+4.86)#302 | 12.5%(+4.54)#4,506 |
| 52. | 77084 | 17.0% | 12.1%(+4.83)#303 | 12.5%(+4.51)#4,514 |
| 53. | 77040 | 16.5% | 12.1%(+4.30)#316 | 12.5%(+3.98)#4,643 |
| 54. | 77049 | 16.4% | 12.1%(+4.24)#318 | 12.5%(+3.92)#4,658 |
| 55. | 77089 | 16.1% | 12.1%(+3.94)#325 | 12.5%(+3.61)#4,721 |
| 56. | 77046 | 15.9% | 12.1%(+3.80)#330 | 12.5%(+3.48)#4,752 |
| 57. | 77095 | 15.2% | 12.1%(+3.08)#345 | 12.5%(+2.76)#4,902 |
| 58. | 77015 | 14.6% | 12.1%(+2.46)#359 | 12.5%(+2.14)#5,060 |
| 59. | 77087 | 14.1% | 12.1%(+1.98)#382 | 12.5%(+1.66)#5,200 |
| 60. | 77025 | 13.9% | 12.1%(+1.72)#391 | 12.5%(+1.40)#5,274 |
| 61. | 77074 | 13.4% | 12.1%(+1.28)#406 | 12.5%(+0.954)#5,407 |
| 62. | 77081 | 12.2% | 12.1%(+0.098)#453 | 12.5%(-0.224)#5,789 |
| 63. | 77075 | 11.7% | 12.1%(-0.457)#472 | 12.5%(-0.779)#5,984 |
| 64. | 77036 | 11.6% | 12.1%(-0.521)#475 | 12.5%(-0.843)#6,007 |
| 65. | 77079 | 11.5% | 12.1%(-0.660)#486 | 12.5%(-0.982)#6,063 |
| 66. | 77093 | 11.2% | 12.1%(-0.936)#499 | 12.5%(-1.26)#6,158 |
| 67. | 77092 | 10.8% | 12.1%(-1.36)#517 | 12.5%(-1.68)#6,324 |
| 68. | 77057 | 10.7% | 12.1%(-1.49)#525 | 12.5%(-1.82)#6,378 |
| 69. | 77062 | 9.9% | 12.1%(-2.26)#553 | 12.5%(-2.58)#6,660 |
| 70. | 77027 | 9.8% | 12.1%(-2.31)#556 | 12.5%(-2.63)#6,679 |
| 71. | 77034 | 9.8% | 12.1%(-2.35)#559 | 12.5%(-2.67)#6,700 |
| 72. | 77019 | 9.2% | 12.1%(-2.98)#601 | 12.5%(-3.30)#6,958 |
| 73. | 77056 | 9.0% | 12.1%(-3.18)#617 | 12.5%(-3.50)#7,055 |
| 74. | 77039 | 8.7% | 12.1%(-3.44)#634 | 12.5%(-3.76)#7,177 |
| 75. | 77018 | 7.7% | 12.1%(-4.44)#682 | 12.5%(-4.76)#7,686 |
| 76. | 77043 | 7.6% | 12.1%(-4.59)#686 | 12.5%(-4.91)#7,782 |
| 77. | 77006 | 7.3% | 12.1%(-4.82)#700 | 12.5%(-5.14)#7,903 |
| 78. | 77030 | 7.3% | 12.1%(-4.87)#702 | 12.5%(-5.19)#7,932 |
| 79. | 77041 | 6.9% | 12.1%(-5.27)#726 | 12.5%(-5.59)#8,181 |
| 80. | 77007 | 6.7% | 12.1%(-5.44)#735 | 12.5%(-5.76)#8,276 |
| 81. | 77009 | 6.4% | 12.1%(-5.72)#751 | 12.5%(-6.04)#8,441 |
| 82. | 77017 | 5.9% | 12.1%(-6.29)#786 | 12.5%(-6.61)#8,850 |
| 83. | 77094 | 5.8% | 12.1%(-6.33)#787 | 12.5%(-6.65)#8,879 |
| 84. | 77058 | 5.8% | 12.1%(-6.36)#789 | 12.5%(-6.68)#8,898 |
| 85. | 77055 | 5.5% | 12.1%(-6.60)#812 | 12.5%(-6.93)#9,097 |
| 86. | 77076 | 5.3% | 12.1%(-6.83)#833 | 12.5%(-7.15)#9,289 |
| 87. | 77098 | 4.8% | 12.1%(-7.35)#874 | 12.5%(-7.67)#9,726 |
| 88. | 77012 | 4.7% | 12.1%(-7.41)#880 | 12.5%(-7.73)#9,796 |
| 89. | 77059 | 4.2% | 12.1%(-7.95)#916 | 12.5%(-8.27)#10,297 |
| 90. | 77023 | 3.5% | 12.1%(-8.67)#972 | 12.5%(-8.99)#11,080 |
| 91. | 77008 | 3.4% | 12.1%(-8.70)#977 | 12.5%(-9.03)#11,120 |
| 92. | 77011 | 3.3% | 12.1%(-8.89)#1,006 | 12.5%(-9.22)#11,413 |
| 93. | 77080 | 3.2% | 12.1%(-8.91)#1,011 | 12.5%(-9.23)#11,432 |
| 94. | 77024 | 3.1% | 12.1%(-9.05)#1,032 | 12.5%(-9.37)#11,661 |
| 95. | 77005 | 2.5% | 12.1%(-9.65)#1,096 | 12.5%(-9.97)#12,611 |
| 96. | 77037 | 1.6% | 12.1%(-10.6)#1,222 | 12.5%(-10.9)#14,676 |
1
Common Questions
What are the Top 10 Zip Codes with the Highest Percentage of Black / African American Population in Houston, TX?
Top 10 Zip Codes with the Highest Percentage of Black / African American Population in Houston, TX are:
What zip code has the Highest Percentage of Black / African American Population in Houston, TX?
77051 has the Highest Percentage of Black / African American Population in Houston, TX with 78.9%.
What is the Percentage of Black / African American Population in Houston, TX?
Percentage of Black / African American Population in Houston is 22.4%.
What is the Percentage of Black / African American Population in Texas?
Percentage of Black / African American Population in Texas is 12.1%.
What is the Percentage of Black / African American Population in the United States?
Percentage of Black / African American Population in the United States is 12.5%.