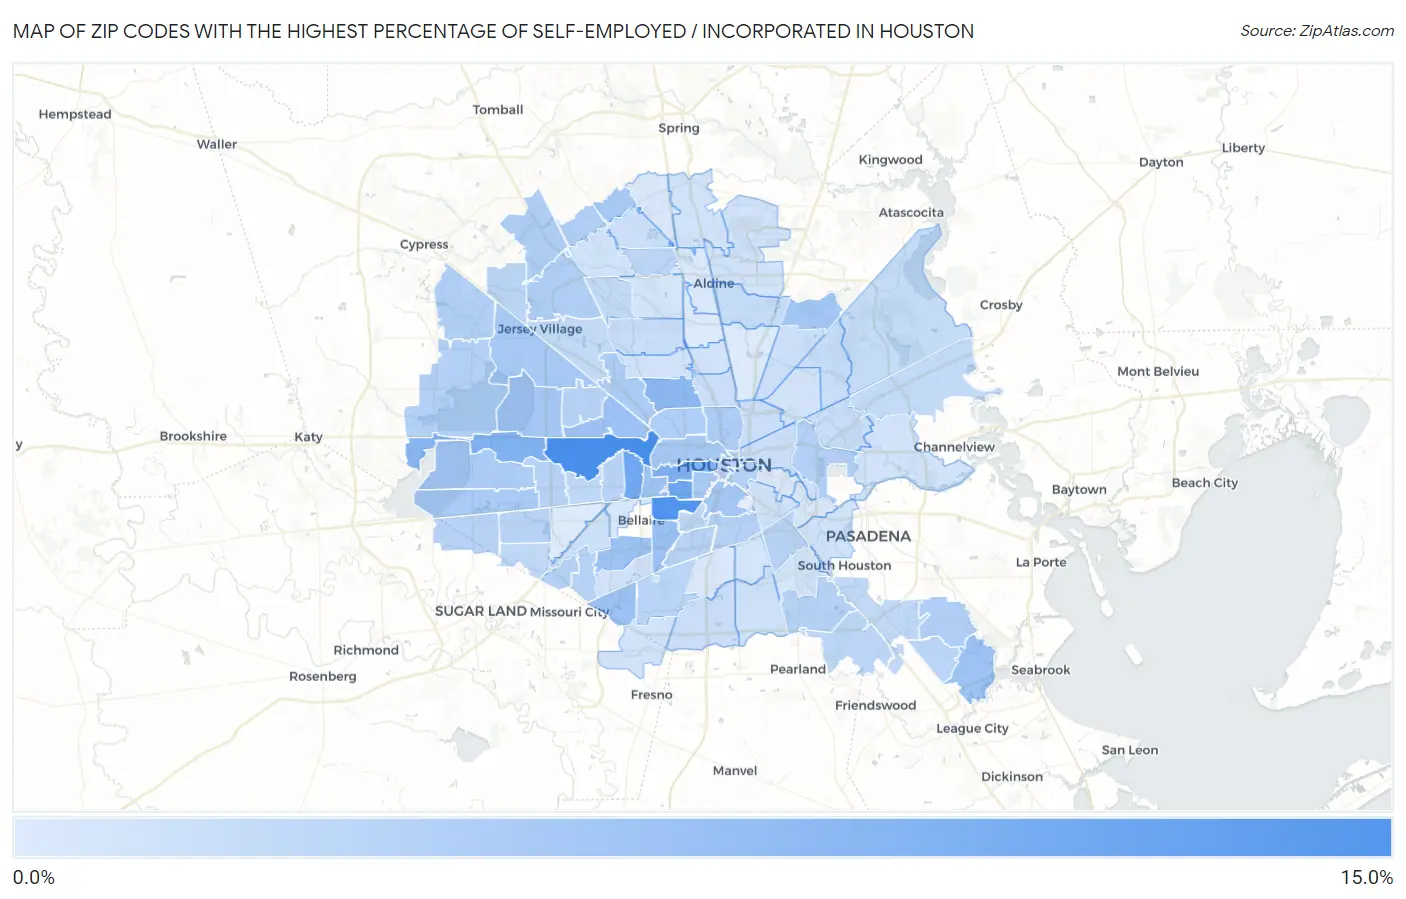
Zip Codes with the Highest Percentage of Self-Employed / Incorporated in Houston, TX
RELATED REPORTS & OPTIONS
Self-Employed / Incorporated
Houston
Compare Zip Codes
Map of Zip Codes with the Highest Percentage of Self-Employed / Incorporated in Houston
0.66%
11.6%
Zip Codes with the Highest Percentage of Self-Employed / Incorporated in Houston, TX
| Zip Code | % Self-Employed / Incorporated | vs State | vs National | |
| 1. | 77024 | 11.6% | 3.4%(+8.24)#57 | 3.8%(+7.79)#1,690 |
| 2. | 77005 | 10.9% | 3.4%(+7.52)#70 | 3.8%(+7.07)#1,938 |
| 3. | 77098 | 8.8% | 3.4%(+5.42)#114 | 3.8%(+4.97)#3,020 |
| 4. | 77056 | 8.4% | 3.4%(+5.07)#125 | 3.8%(+4.62)#3,285 |
| 5. | 77019 | 7.5% | 3.4%(+4.15)#162 | 3.8%(+3.70)#4,153 |
| 6. | 77010 | 7.4% | 3.4%(+4.01)#173 | 3.8%(+3.56)#4,307 |
| 7. | 77079 | 7.3% | 3.4%(+3.96)#176 | 3.8%(+3.51)#4,363 |
| 8. | 77094 | 6.8% | 3.4%(+3.42)#200 | 3.8%(+2.97)#5,043 |
| 9. | 77018 | 6.5% | 3.4%(+3.12)#215 | 3.8%(+2.67)#5,490 |
| 10. | 77025 | 5.5% | 3.4%(+2.10)#303 | 3.8%(+1.65)#7,425 |
| 11. | 77085 | 5.4% | 3.4%(+2.04)#313 | 3.8%(+1.59)#7,564 |
| 12. | 77055 | 5.2% | 3.4%(+1.83)#337 | 3.8%(+1.38)#8,096 |
| 13. | 77096 | 5.0% | 3.4%(+1.68)#357 | 3.8%(+1.23)#8,471 |
| 14. | 77058 | 5.0% | 3.4%(+1.66)#361 | 3.8%(+1.21)#8,515 |
| 15. | 77027 | 4.9% | 3.4%(+1.51)#378 | 3.8%(+1.06)#8,945 |
| 16. | 77050 | 4.7% | 3.4%(+1.35)#407 | 3.8%(+0.901)#9,421 |
| 17. | 77043 | 4.6% | 3.4%(+1.25)#426 | 3.8%(+0.797)#9,739 |
| 18. | 77004 | 4.6% | 3.4%(+1.21)#433 | 3.8%(+0.762)#9,839 |
| 19. | 77041 | 4.4% | 3.4%(+1.04)#466 | 3.8%(+0.590)#10,418 |
| 20. | 77007 | 4.3% | 3.4%(+0.974)#482 | 3.8%(+0.525)#10,659 |
| 21. | 77068 | 4.3% | 3.4%(+0.973)#483 | 3.8%(+0.524)#10,661 |
| 22. | 77006 | 4.3% | 3.4%(+0.970)#487 | 3.8%(+0.521)#10,679 |
| 23. | 77082 | 4.2% | 3.4%(+0.795)#513 | 3.8%(+0.346)#11,304 |
| 24. | 77009 | 4.1% | 3.4%(+0.732)#524 | 3.8%(+0.283)#11,519 |
| 25. | 77092 | 4.1% | 3.4%(+0.709)#529 | 3.8%(+0.260)#11,614 |
| 26. | 77077 | 4.0% | 3.4%(+0.681)#538 | 3.8%(+0.232)#11,732 |
| 27. | 77059 | 3.8% | 3.4%(+0.452)#587 | 3.8%(+0.003)#12,674 |
| 28. | 77069 | 3.8% | 3.4%(+0.411)#594 | 3.8%(-0.038)#12,845 |
| 29. | 77008 | 3.8% | 3.4%(+0.391)#599 | 3.8%(-0.058)#12,930 |
| 30. | 77064 | 3.7% | 3.4%(+0.329)#617 | 3.8%(-0.120)#13,206 |
| 31. | 77070 | 3.7% | 3.4%(+0.308)#619 | 3.8%(-0.141)#13,285 |
| 32. | 77095 | 3.6% | 3.4%(+0.245)#640 | 3.8%(-0.204)#13,558 |
| 33. | 77029 | 3.6% | 3.4%(+0.228)#644 | 3.8%(-0.221)#13,623 |
| 34. | 77084 | 3.5% | 3.4%(+0.169)#656 | 3.8%(-0.280)#13,867 |
| 35. | 77031 | 3.5% | 3.4%(+0.158)#658 | 3.8%(-0.291)#13,911 |
| 36. | 77075 | 3.5% | 3.4%(+0.104)#673 | 3.8%(-0.345)#14,162 |
| 37. | 77021 | 3.4% | 3.4%(+0.015)#695 | 3.8%(-0.434)#14,567 |
| 38. | 77003 | 3.3% | 3.4%(-0.028)#709 | 3.8%(-0.477)#14,777 |
| 39. | 77080 | 3.3% | 3.4%(-0.064)#719 | 3.8%(-0.513)#14,938 |
| 40. | 77002 | 3.3% | 3.4%(-0.079)#726 | 3.8%(-0.528)#14,998 |
| 41. | 77054 | 3.3% | 3.4%(-0.111)#734 | 3.8%(-0.560)#15,136 |
| 42. | 77071 | 3.2% | 3.4%(-0.134)#735 | 3.8%(-0.582)#15,232 |
| 43. | 77087 | 3.2% | 3.4%(-0.164)#746 | 3.8%(-0.613)#15,382 |
| 44. | 77072 | 3.2% | 3.4%(-0.168)#747 | 3.8%(-0.617)#15,397 |
| 45. | 77042 | 3.2% | 3.4%(-0.185)#757 | 3.8%(-0.634)#15,483 |
| 46. | 77057 | 3.2% | 3.4%(-0.191)#760 | 3.8%(-0.640)#15,511 |
| 47. | 77083 | 3.2% | 3.4%(-0.194)#764 | 3.8%(-0.643)#15,531 |
| 48. | 77062 | 3.1% | 3.4%(-0.252)#783 | 3.8%(-0.701)#15,797 |
| 49. | 77045 | 3.0% | 3.4%(-0.322)#805 | 3.8%(-0.771)#16,152 |
| 50. | 77089 | 3.0% | 3.4%(-0.374)#822 | 3.8%(-0.823)#16,435 |
| 51. | 77030 | 2.9% | 3.4%(-0.431)#843 | 3.8%(-0.880)#16,707 |
| 52. | 77065 | 2.9% | 3.4%(-0.434)#845 | 3.8%(-0.883)#16,725 |
| 53. | 77067 | 2.9% | 3.4%(-0.460)#859 | 3.8%(-0.909)#16,864 |
| 54. | 77063 | 2.7% | 3.4%(-0.648)#910 | 3.8%(-1.10)#17,763 |
| 55. | 77099 | 2.6% | 3.4%(-0.754)#955 | 3.8%(-1.20)#18,364 |
| 56. | 77034 | 2.5% | 3.4%(-0.825)#974 | 3.8%(-1.27)#18,684 |
| 57. | 77040 | 2.5% | 3.4%(-0.888)#988 | 3.8%(-1.34)#18,998 |
| 58. | 77086 | 2.5% | 3.4%(-0.909)#996 | 3.8%(-1.36)#19,099 |
| 59. | 77049 | 2.4% | 3.4%(-0.933)#1,005 | 3.8%(-1.38)#19,225 |
| 60. | 77039 | 2.3% | 3.4%(-1.07)#1,047 | 3.8%(-1.51)#19,847 |
| 61. | 77044 | 2.2% | 3.4%(-1.17)#1,072 | 3.8%(-1.62)#20,380 |
| 62. | 77078 | 2.2% | 3.4%(-1.19)#1,083 | 3.8%(-1.64)#20,523 |
| 63. | 77013 | 2.2% | 3.4%(-1.21)#1,090 | 3.8%(-1.66)#20,589 |
| 64. | 77088 | 2.1% | 3.4%(-1.24)#1,100 | 3.8%(-1.69)#20,730 |
| 65. | 77020 | 2.0% | 3.4%(-1.36)#1,141 | 3.8%(-1.81)#21,329 |
| 66. | 77047 | 2.0% | 3.4%(-1.36)#1,144 | 3.8%(-1.81)#21,350 |
| 67. | 77026 | 2.0% | 3.4%(-1.38)#1,149 | 3.8%(-1.83)#21,441 |
| 68. | 77022 | 1.9% | 3.4%(-1.47)#1,172 | 3.8%(-1.92)#21,827 |
| 69. | 77014 | 1.8% | 3.4%(-1.57)#1,206 | 3.8%(-2.02)#22,281 |
| 70. | 77016 | 1.8% | 3.4%(-1.60)#1,214 | 3.8%(-2.04)#22,373 |
| 71. | 77048 | 1.7% | 3.4%(-1.66)#1,227 | 3.8%(-2.11)#22,657 |
| 72. | 77074 | 1.6% | 3.4%(-1.74)#1,257 | 3.8%(-2.18)#22,970 |
| 73. | 77032 | 1.5% | 3.4%(-1.85)#1,300 | 3.8%(-2.30)#23,416 |
| 74. | 77073 | 1.5% | 3.4%(-1.87)#1,310 | 3.8%(-2.32)#23,482 |
| 75. | 77035 | 1.5% | 3.4%(-1.88)#1,313 | 3.8%(-2.33)#23,539 |
| 76. | 77066 | 1.5% | 3.4%(-1.89)#1,316 | 3.8%(-2.34)#23,576 |
| 77. | 77017 | 1.4% | 3.4%(-1.93)#1,324 | 3.8%(-2.38)#23,718 |
| 78. | 77053 | 1.4% | 3.4%(-1.94)#1,327 | 3.8%(-2.39)#23,762 |
| 79. | 77076 | 1.4% | 3.4%(-1.94)#1,329 | 3.8%(-2.39)#23,770 |
| 80. | 77015 | 1.4% | 3.4%(-1.96)#1,333 | 3.8%(-2.41)#23,828 |
| 81. | 77023 | 1.4% | 3.4%(-1.96)#1,334 | 3.8%(-2.41)#23,853 |
| 82. | 77028 | 1.4% | 3.4%(-1.97)#1,336 | 3.8%(-2.42)#23,885 |
| 83. | 77091 | 1.4% | 3.4%(-1.98)#1,339 | 3.8%(-2.42)#23,906 |
| 84. | 77033 | 1.3% | 3.4%(-2.10)#1,371 | 3.8%(-2.55)#24,384 |
| 85. | 77038 | 1.2% | 3.4%(-2.18)#1,390 | 3.8%(-2.63)#24,688 |
| 86. | 77061 | 1.1% | 3.4%(-2.28)#1,412 | 3.8%(-2.73)#25,012 |
| 87. | 77012 | 0.96% | 3.4%(-2.41)#1,438 | 3.8%(-2.86)#25,399 |
| 88. | 77090 | 0.94% | 3.4%(-2.43)#1,443 | 3.8%(-2.87)#25,443 |
| 89. | 77051 | 0.87% | 3.4%(-2.50)#1,459 | 3.8%(-2.95)#25,632 |
| 90. | 77081 | 0.81% | 3.4%(-2.56)#1,470 | 3.8%(-3.01)#25,779 |
| 91. | 77060 | 0.80% | 3.4%(-2.57)#1,472 | 3.8%(-3.02)#25,801 |
| 92. | 77011 | 0.77% | 3.4%(-2.59)#1,478 | 3.8%(-3.04)#25,870 |
| 93. | 77036 | 0.73% | 3.4%(-2.64)#1,484 | 3.8%(-3.09)#26,004 |
| 94. | 77037 | 0.69% | 3.4%(-2.68)#1,489 | 3.8%(-3.12)#26,084 |
| 95. | 77093 | 0.66% | 3.4%(-2.71)#1,498 | 3.8%(-3.16)#26,160 |
1
Common Questions
What are the Top 10 Zip Codes with the Highest Percentage of Self-Employed / Incorporated in Houston, TX?
Top 10 Zip Codes with the Highest Percentage of Self-Employed / Incorporated in Houston, TX are:
What zip code has the Highest Percentage of Self-Employed / Incorporated in Houston, TX?
77024 has the Highest Percentage of Self-Employed / Incorporated in Houston, TX with 11.6%.
What is the Percentage of Self-Employed / Incorporated in Houston, TX?
Percentage of Self-Employed / Incorporated in Houston is 3.3%.
What is the Percentage of Self-Employed / Incorporated in Texas?
Percentage of Self-Employed / Incorporated in Texas is 3.4%.
What is the Percentage of Self-Employed / Incorporated in the United States?
Percentage of Self-Employed / Incorporated in the United States is 3.8%.