Zip Codes with the Highest Percentage of Births to Unmarried Women in Houston, TX
RELATED REPORTS & OPTIONS
Highest Illegitimacy | All Women
Houston
Compare Zip Codes
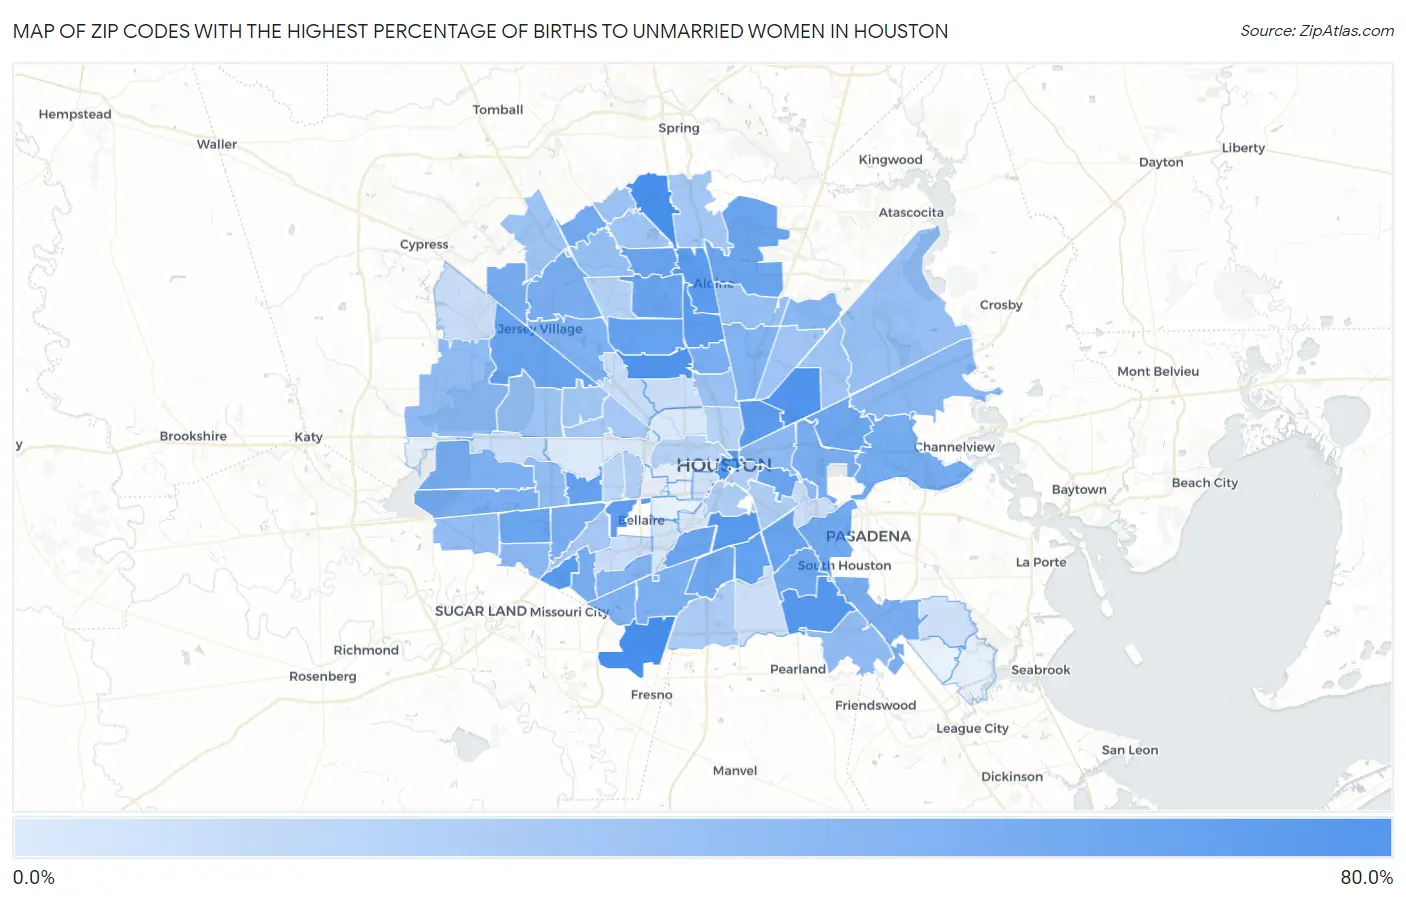
Map of Zip Codes with the Highest Percentage of Births to Unmarried Women in Houston
3.0%
76.1%
Zip Codes with the Highest Percentage of Births to Unmarried Women in Houston, TX
| Zip Code | % Unmarried | vs State | vs National | |
| 1. | 77053 | 76.1% | 32.3%(+43.8)#157 | 32.1%(+44.0)#2,964 |
| 2. | 77090 | 75.6% | 32.3%(+43.3)#158 | 32.1%(+43.5)#2,998 |
| 3. | 77028 | 72.3% | 32.3%(+40.0)#176 | 32.1%(+40.2)#3,318 |
| 4. | 77091 | 71.0% | 32.3%(+38.7)#183 | 32.1%(+38.9)#3,451 |
| 5. | 77075 | 67.8% | 32.3%(+35.5)#204 | 32.1%(+35.7)#3,749 |
| 6. | 77031 | 65.8% | 32.3%(+33.5)#220 | 32.1%(+33.7)#4,001 |
| 7. | 77021 | 65.7% | 32.3%(+33.4)#221 | 32.1%(+33.6)#4,011 |
| 8. | 77037 | 63.7% | 32.3%(+31.4)#237 | 32.1%(+31.6)#4,249 |
| 9. | 77002 | 63.6% | 32.3%(+31.3)#238 | 32.1%(+31.5)#4,253 |
| 10. | 77060 | 63.1% | 32.3%(+30.8)#245 | 32.1%(+31.0)#4,328 |
| 11. | 77026 | 63.1% | 32.3%(+30.8)#246 | 32.1%(+31.0)#4,334 |
| 12. | 77081 | 61.7% | 32.3%(+29.4)#255 | 32.1%(+29.6)#4,504 |
| 13. | 77033 | 59.0% | 32.3%(+26.7)#272 | 32.1%(+26.9)#4,866 |
| 14. | 77063 | 58.1% | 32.3%(+25.8)#284 | 32.1%(+26.0)#4,979 |
| 15. | 77088 | 58.0% | 32.3%(+25.7)#286 | 32.1%(+25.9)#4,999 |
| 16. | 77067 | 57.1% | 32.3%(+24.8)#291 | 32.1%(+25.0)#5,098 |
| 17. | 77038 | 56.6% | 32.3%(+24.3)#294 | 32.1%(+24.5)#5,198 |
| 18. | 77041 | 56.4% | 32.3%(+24.1)#296 | 32.1%(+24.3)#5,232 |
| 19. | 77087 | 55.0% | 32.3%(+22.7)#307 | 32.1%(+22.9)#5,455 |
| 20. | 77032 | 54.6% | 32.3%(+22.3)#315 | 32.1%(+22.5)#5,507 |
| 21. | 77054 | 53.9% | 32.3%(+21.6)#318 | 32.1%(+21.8)#5,597 |
| 22. | 77072 | 53.8% | 32.3%(+21.5)#319 | 32.1%(+21.7)#5,607 |
| 23. | 77011 | 53.8% | 32.3%(+21.5)#320 | 32.1%(+21.7)#5,612 |
| 24. | 77013 | 53.5% | 32.3%(+21.2)#322 | 32.1%(+21.4)#5,660 |
| 25. | 77051 | 53.5% | 32.3%(+21.2)#323 | 32.1%(+21.4)#5,663 |
| 26. | 77017 | 50.7% | 32.3%(+18.4)#349 | 32.1%(+18.6)#6,064 |
| 27. | 77061 | 50.2% | 32.3%(+17.9)#359 | 32.1%(+18.1)#6,122 |
| 28. | 77069 | 50.0% | 32.3%(+17.7)#363 | 32.1%(+17.9)#6,144 |
| 29. | 77015 | 49.9% | 32.3%(+17.6)#372 | 32.1%(+17.8)#6,361 |
| 30. | 77065 | 48.4% | 32.3%(+16.1)#386 | 32.1%(+16.3)#6,535 |
| 31. | 77071 | 47.5% | 32.3%(+15.2)#400 | 32.1%(+15.4)#6,718 |
| 32. | 77082 | 47.2% | 32.3%(+14.9)#406 | 32.1%(+15.1)#6,784 |
| 33. | 77076 | 47.0% | 32.3%(+14.7)#409 | 32.1%(+14.9)#6,836 |
| 34. | 77034 | 46.9% | 32.3%(+14.6)#410 | 32.1%(+14.8)#6,851 |
| 35. | 77036 | 46.8% | 32.3%(+14.5)#412 | 32.1%(+14.7)#6,865 |
| 36. | 77064 | 46.6% | 32.3%(+14.3)#416 | 32.1%(+14.5)#6,925 |
| 37. | 77029 | 46.3% | 32.3%(+14.0)#425 | 32.1%(+14.2)#6,980 |
| 38. | 77045 | 46.2% | 32.3%(+13.9)#427 | 32.1%(+14.1)#6,998 |
| 39. | 77040 | 44.9% | 32.3%(+12.6)#444 | 32.1%(+12.8)#7,256 |
| 40. | 77077 | 44.8% | 32.3%(+12.5)#445 | 32.1%(+12.7)#7,268 |
| 41. | 77093 | 43.8% | 32.3%(+11.5)#453 | 32.1%(+11.7)#7,471 |
| 42. | 77085 | 43.4% | 32.3%(+11.1)#461 | 32.1%(+11.3)#7,551 |
| 43. | 77035 | 41.7% | 32.3%(+9.40)#491 | 32.1%(+9.60)#7,916 |
| 44. | 77050 | 39.4% | 32.3%(+7.10)#536 | 32.1%(+7.30)#8,487 |
| 45. | 77049 | 38.6% | 32.3%(+6.30)#548 | 32.1%(+6.50)#8,667 |
| 46. | 77099 | 37.3% | 32.3%(+5.00)#580 | 32.1%(+5.20)#8,975 |
| 47. | 77020 | 37.1% | 32.3%(+4.80)#587 | 32.1%(+5.00)#9,019 |
| 48. | 77084 | 35.2% | 32.3%(+2.90)#617 | 32.1%(+3.10)#9,442 |
| 49. | 77089 | 35.0% | 32.3%(+2.70)#621 | 32.1%(+2.90)#9,480 |
| 50. | 77042 | 34.9% | 32.3%(+2.60)#624 | 32.1%(+2.80)#9,509 |
| 51. | 77083 | 33.9% | 32.3%(+1.60)#640 | 32.1%(+1.80)#9,687 |
| 52. | 77066 | 32.8% | 32.3%(+0.500)#667 | 32.1%(+0.700)#10,031 |
| 53. | 77044 | 32.2% | 32.3%(-0.100)#680 | 32.1%(+0.100)#10,162 |
| 54. | 77039 | 32.0% | 32.3%(-0.300)#685 | 32.1%(-0.100)#10,216 |
| 55. | 77022 | 31.2% | 32.3%(-1.10)#700 | 32.1%(-0.900)#10,429 |
| 56. | 77068 | 31.1% | 32.3%(-1.20)#703 | 32.1%(-1.00)#10,451 |
| 57. | 77070 | 29.1% | 32.3%(-3.20)#741 | 32.1%(-3.00)#10,929 |
| 58. | 77043 | 29.1% | 32.3%(-3.20)#742 | 32.1%(-3.00)#10,935 |
| 59. | 77014 | 28.9% | 32.3%(-3.40)#744 | 32.1%(-3.20)#10,972 |
| 60. | 77016 | 28.1% | 32.3%(-4.20)#754 | 32.1%(-4.00)#11,187 |
| 61. | 77078 | 27.4% | 32.3%(-4.90)#767 | 32.1%(-4.70)#11,343 |
| 62. | 77073 | 26.5% | 32.3%(-5.80)#786 | 32.1%(-5.60)#11,593 |
| 63. | 77080 | 26.4% | 32.3%(-5.90)#789 | 32.1%(-5.70)#11,614 |
| 64. | 77074 | 25.6% | 32.3%(-6.70)#806 | 32.1%(-6.50)#11,803 |
| 65. | 77055 | 25.5% | 32.3%(-6.80)#807 | 32.1%(-6.60)#11,822 |
| 66. | 77047 | 22.4% | 32.3%(-9.90)#862 | 32.1%(-9.70)#12,618 |
| 67. | 77004 | 21.8% | 32.3%(-10.5)#872 | 32.1%(-10.3)#12,764 |
| 68. | 77056 | 20.7% | 32.3%(-11.6)#897 | 32.1%(-11.4)#13,064 |
| 69. | 77023 | 20.5% | 32.3%(-11.8)#900 | 32.1%(-11.6)#13,109 |
| 70. | 77003 | 20.5% | 32.3%(-11.8)#901 | 32.1%(-11.6)#13,114 |
| 71. | 77009 | 19.0% | 32.3%(-13.3)#924 | 32.1%(-13.1)#13,525 |
| 72. | 77086 | 19.0% | 32.3%(-13.3)#925 | 32.1%(-13.1)#13,529 |
| 73. | 77007 | 17.9% | 32.3%(-14.4)#941 | 32.1%(-14.2)#13,830 |
| 74. | 77057 | 16.0% | 32.3%(-16.3)#960 | 32.1%(-16.1)#14,325 |
| 75. | 77092 | 11.3% | 32.3%(-21.0)#1,037 | 32.1%(-20.8)#15,576 |
| 76. | 77012 | 10.0% | 32.3%(-22.3)#1,054 | 32.1%(-22.1)#15,900 |
| 77. | 77095 | 9.7% | 32.3%(-22.6)#1,058 | 32.1%(-22.4)#15,971 |
| 78. | 77096 | 9.7% | 32.3%(-22.6)#1,059 | 32.1%(-22.4)#15,976 |
| 79. | 77079 | 9.5% | 32.3%(-22.8)#1,065 | 32.1%(-22.6)#16,022 |
| 80. | 77048 | 8.8% | 32.3%(-23.5)#1,073 | 32.1%(-23.3)#16,189 |
| 81. | 77018 | 8.7% | 32.3%(-23.6)#1,076 | 32.1%(-23.4)#16,211 |
| 82. | 77006 | 8.5% | 32.3%(-23.8)#1,079 | 32.1%(-23.6)#16,257 |
| 83. | 77059 | 8.5% | 32.3%(-23.8)#1,080 | 32.1%(-23.6)#16,262 |
| 84. | 77025 | 5.6% | 32.3%(-26.7)#1,111 | 32.1%(-26.5)#16,979 |
| 85. | 77030 | 4.9% | 32.3%(-27.4)#1,121 | 32.1%(-27.2)#17,134 |
| 86. | 77008 | 3.7% | 32.3%(-28.6)#1,140 | 32.1%(-28.4)#17,365 |
| 87. | 77024 | 3.0% | 32.3%(-29.3)#1,149 | 32.1%(-29.1)#17,477 |
1
Common Questions
What are the Top 10 Zip Codes with the Highest Percentage of Births to Unmarried Women in Houston, TX?
Top 10 Zip Codes with the Highest Percentage of Births to Unmarried Women in Houston, TX are:
What zip code has the Highest Percentage of Births to Unmarried Women in Houston, TX?
77053 has the Highest Percentage of Births to Unmarried Women in Houston, TX with 76.1%.
What is the Percentage of Births to Unmarried Women in Houston, TX?
Percentage of Births to Unmarried Women in Houston is 38.8%.
What is the Percentage of Births to Unmarried Women in Texas?
Percentage of Births to Unmarried Women in Texas is 32.3%.
What is the Percentage of Births to Unmarried Women in the United States?
Percentage of Births to Unmarried Women in the United States is 32.1%.