Zip Codes with the Highest Percentage of Population Employed in Arts, Entertainment & Recreation in Houston, TX
RELATED REPORTS & OPTIONS
Arts, Entertainment & Recreation
Houston
Compare Zip Codes
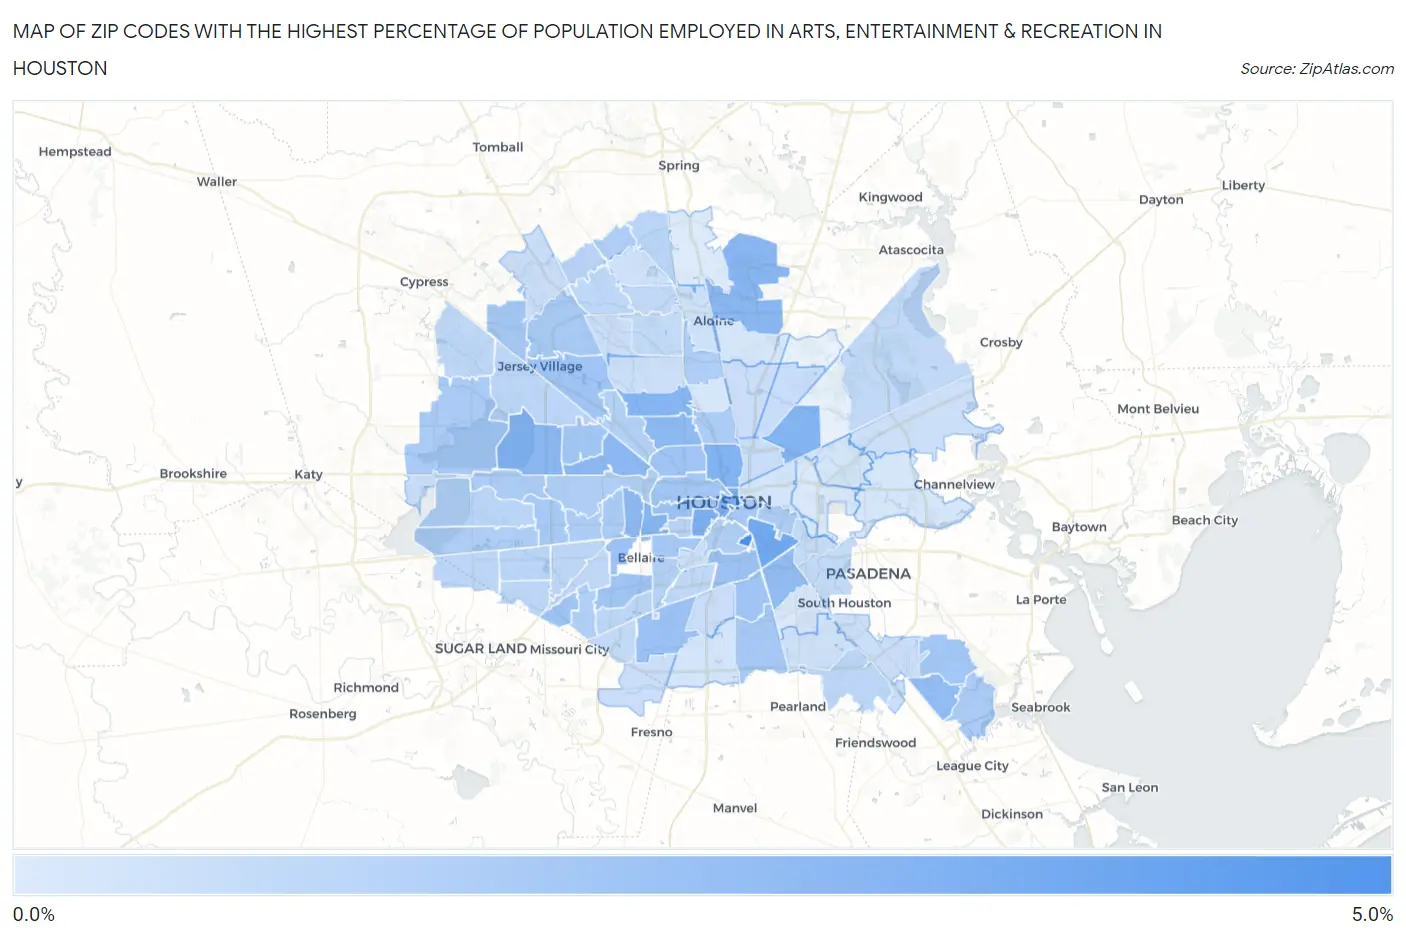
Map of Zip Codes with the Highest Percentage of Population Employed in Arts, Entertainment & Recreation in Houston
0.094%
4.6%
Zip Codes with the Highest Percentage of Population Employed in Arts, Entertainment & Recreation in Houston, TX
| Zip Code | % Employed | vs State | vs National | |
| 1. | 77204 | 4.6% | 1.5%(+3.17)#49 | 2.1%(+2.55)#2,600 |
| 2. | 77010 | 4.3% | 1.5%(+2.81)#61 | 2.1%(+2.19)#2,991 |
| 3. | 77023 | 3.3% | 1.5%(+1.82)#111 | 2.1%(+1.20)#4,609 |
| 4. | 77006 | 3.0% | 1.5%(+1.55)#141 | 2.1%(+0.928)#5,329 |
| 5. | 77002 | 3.0% | 1.5%(+1.50)#148 | 2.1%(+0.881)#5,466 |
| 6. | 77009 | 2.8% | 1.5%(+1.37)#167 | 2.1%(+0.746)#5,891 |
| 7. | 77028 | 2.8% | 1.5%(+1.31)#179 | 2.1%(+0.687)#6,103 |
| 8. | 77091 | 2.7% | 1.5%(+1.28)#181 | 2.1%(+0.660)#6,216 |
| 9. | 77027 | 2.6% | 1.5%(+1.18)#194 | 2.1%(+0.561)#6,593 |
| 10. | 77032 | 2.6% | 1.5%(+1.15)#206 | 2.1%(+0.530)#6,704 |
| 11. | 77043 | 2.5% | 1.5%(+1.09)#218 | 2.1%(+0.467)#6,957 |
| 12. | 77056 | 2.5% | 1.5%(+1.06)#224 | 2.1%(+0.437)#7,092 |
| 13. | 77055 | 2.5% | 1.5%(+1.03)#226 | 2.1%(+0.413)#7,196 |
| 14. | 77018 | 2.4% | 1.5%(+0.975)#234 | 2.1%(+0.355)#7,474 |
| 15. | 77062 | 2.4% | 1.5%(+0.943)#244 | 2.1%(+0.323)#7,621 |
| 16. | 77087 | 2.3% | 1.5%(+0.815)#271 | 2.1%(+0.195)#8,238 |
| 17. | 77019 | 2.1% | 1.5%(+0.608)#335 | 2.1%(-0.012)#9,364 |
| 18. | 77045 | 2.0% | 1.5%(+0.577)#342 | 2.1%(-0.043)#9,555 |
| 19. | 77021 | 2.0% | 1.5%(+0.564)#344 | 2.1%(-0.056)#9,620 |
| 20. | 77081 | 2.0% | 1.5%(+0.529)#350 | 2.1%(-0.091)#9,834 |
| 21. | 77031 | 1.9% | 1.5%(+0.475)#367 | 2.1%(-0.145)#10,148 |
| 22. | 77033 | 1.9% | 1.5%(+0.436)#386 | 2.1%(-0.184)#10,391 |
| 23. | 77040 | 1.9% | 1.5%(+0.424)#390 | 2.1%(-0.196)#10,463 |
| 24. | 77008 | 1.9% | 1.5%(+0.408)#397 | 2.1%(-0.212)#10,552 |
| 25. | 77096 | 1.9% | 1.5%(+0.390)#399 | 2.1%(-0.230)#10,675 |
| 26. | 77080 | 1.8% | 1.5%(+0.366)#414 | 2.1%(-0.254)#10,823 |
| 27. | 77059 | 1.8% | 1.5%(+0.335)#429 | 2.1%(-0.285)#11,032 |
| 28. | 77007 | 1.8% | 1.5%(+0.321)#434 | 2.1%(-0.299)#11,134 |
| 29. | 77005 | 1.8% | 1.5%(+0.317)#437 | 2.1%(-0.303)#11,166 |
| 30. | 77065 | 1.8% | 1.5%(+0.313)#439 | 2.1%(-0.307)#11,190 |
| 31. | 77003 | 1.8% | 1.5%(+0.295)#446 | 2.1%(-0.326)#11,318 |
| 32. | 77048 | 1.7% | 1.5%(+0.260)#458 | 2.1%(-0.360)#11,564 |
| 33. | 77042 | 1.7% | 1.5%(+0.244)#467 | 2.1%(-0.376)#11,693 |
| 34. | 77064 | 1.7% | 1.5%(+0.190)#483 | 2.1%(-0.430)#12,058 |
| 35. | 77057 | 1.6% | 1.5%(+0.152)#500 | 2.1%(-0.468)#12,341 |
| 36. | 77084 | 1.6% | 1.5%(+0.119)#513 | 2.1%(-0.501)#12,600 |
| 37. | 77058 | 1.6% | 1.5%(+0.118)#514 | 2.1%(-0.502)#12,605 |
| 38. | 77079 | 1.6% | 1.5%(+0.089)#527 | 2.1%(-0.531)#12,844 |
| 39. | 77063 | 1.5% | 1.5%(+0.084)#534 | 2.1%(-0.536)#12,895 |
| 40. | 77022 | 1.5% | 1.5%(+0.061)#545 | 2.1%(-0.559)#13,077 |
| 41. | 77011 | 1.5% | 1.5%(+0.061)#546 | 2.1%(-0.559)#13,078 |
| 42. | 77024 | 1.5% | 1.5%(+0.022)#558 | 2.1%(-0.598)#13,343 |
| 43. | 77037 | 1.5% | 1.5%(+0.013)#562 | 2.1%(-0.607)#13,408 |
| 44. | 77068 | 1.5% | 1.5%(+0.013)#563 | 2.1%(-0.607)#13,409 |
| 45. | 77082 | 1.5% | 1.5%(-0.009)#580 | 2.1%(-0.629)#13,577 |
| 46. | 77004 | 1.4% | 1.5%(-0.052)#605 | 2.1%(-0.672)#13,906 |
| 47. | 77071 | 1.4% | 1.5%(-0.083)#623 | 2.1%(-0.704)#14,141 |
| 48. | 77092 | 1.4% | 1.5%(-0.112)#633 | 2.1%(-0.732)#14,356 |
| 49. | 77098 | 1.3% | 1.5%(-0.208)#692 | 2.1%(-0.828)#15,067 |
| 50. | 77025 | 1.2% | 1.5%(-0.216)#696 | 2.1%(-0.836)#15,136 |
| 51. | 77069 | 1.2% | 1.5%(-0.253)#712 | 2.1%(-0.874)#15,408 |
| 52. | 77090 | 1.1% | 1.5%(-0.345)#763 | 2.1%(-0.965)#16,111 |
| 53. | 77072 | 1.1% | 1.5%(-0.350)#767 | 2.1%(-0.970)#16,140 |
| 54. | 77077 | 1.1% | 1.5%(-0.372)#777 | 2.1%(-0.992)#16,320 |
| 55. | 77036 | 1.1% | 1.5%(-0.393)#785 | 2.1%(-1.01)#16,470 |
| 56. | 77041 | 1.1% | 1.5%(-0.400)#792 | 2.1%(-1.02)#16,521 |
| 57. | 77089 | 1.0% | 1.5%(-0.420)#803 | 2.1%(-1.04)#16,634 |
| 58. | 77083 | 1.0% | 1.5%(-0.425)#806 | 2.1%(-1.05)#16,675 |
| 59. | 77099 | 1.0% | 1.5%(-0.426)#807 | 2.1%(-1.05)#16,680 |
| 60. | 77035 | 1.0% | 1.5%(-0.435)#810 | 2.1%(-1.06)#16,755 |
| 61. | 77066 | 1.0% | 1.5%(-0.444)#817 | 2.1%(-1.06)#16,820 |
| 62. | 77095 | 1.0% | 1.5%(-0.448)#821 | 2.1%(-1.07)#16,841 |
| 63. | 77074 | 0.96% | 1.5%(-0.501)#847 | 2.1%(-1.12)#17,245 |
| 64. | 77044 | 0.94% | 1.5%(-0.527)#857 | 2.1%(-1.15)#17,434 |
| 65. | 77067 | 0.89% | 1.5%(-0.569)#875 | 2.1%(-1.19)#17,735 |
| 66. | 77054 | 0.89% | 1.5%(-0.577)#882 | 2.1%(-1.20)#17,791 |
| 67. | 77038 | 0.88% | 1.5%(-0.586)#885 | 2.1%(-1.21)#17,870 |
| 68. | 77017 | 0.87% | 1.5%(-0.591)#888 | 2.1%(-1.21)#17,909 |
| 69. | 77085 | 0.82% | 1.5%(-0.641)#904 | 2.1%(-1.26)#18,249 |
| 70. | 77012 | 0.75% | 1.5%(-0.709)#934 | 2.1%(-1.33)#18,726 |
| 71. | 77016 | 0.73% | 1.5%(-0.730)#948 | 2.1%(-1.35)#18,900 |
| 72. | 77026 | 0.73% | 1.5%(-0.734)#950 | 2.1%(-1.35)#18,927 |
| 73. | 77094 | 0.67% | 1.5%(-0.791)#983 | 2.1%(-1.41)#19,350 |
| 74. | 77070 | 0.65% | 1.5%(-0.812)#995 | 2.1%(-1.43)#19,493 |
| 75. | 77086 | 0.64% | 1.5%(-0.821)#997 | 2.1%(-1.44)#19,537 |
| 76. | 77093 | 0.63% | 1.5%(-0.828)#1,001 | 2.1%(-1.45)#19,589 |
| 77. | 77051 | 0.62% | 1.5%(-0.845)#1,013 | 2.1%(-1.47)#19,707 |
| 78. | 77053 | 0.61% | 1.5%(-0.848)#1,015 | 2.1%(-1.47)#19,724 |
| 79. | 77034 | 0.61% | 1.5%(-0.855)#1,018 | 2.1%(-1.47)#19,767 |
| 80. | 77030 | 0.60% | 1.5%(-0.865)#1,030 | 2.1%(-1.48)#19,846 |
| 81. | 77049 | 0.58% | 1.5%(-0.879)#1,035 | 2.1%(-1.50)#19,946 |
| 82. | 77088 | 0.56% | 1.5%(-0.905)#1,052 | 2.1%(-1.53)#20,127 |
| 83. | 77014 | 0.53% | 1.5%(-0.931)#1,063 | 2.1%(-1.55)#20,296 |
| 84. | 77075 | 0.52% | 1.5%(-0.939)#1,070 | 2.1%(-1.56)#20,351 |
| 85. | 77060 | 0.49% | 1.5%(-0.976)#1,085 | 2.1%(-1.60)#20,579 |
| 86. | 77013 | 0.37% | 1.5%(-1.09)#1,142 | 2.1%(-1.71)#21,308 |
| 87. | 77020 | 0.36% | 1.5%(-1.10)#1,143 | 2.1%(-1.72)#21,337 |
| 88. | 77047 | 0.36% | 1.5%(-1.10)#1,147 | 2.1%(-1.72)#21,368 |
| 89. | 77039 | 0.30% | 1.5%(-1.16)#1,175 | 2.1%(-1.78)#21,722 |
| 90. | 77015 | 0.29% | 1.5%(-1.17)#1,178 | 2.1%(-1.79)#21,759 |
| 91. | 77076 | 0.27% | 1.5%(-1.19)#1,183 | 2.1%(-1.81)#21,853 |
| 92. | 77061 | 0.16% | 1.5%(-1.31)#1,229 | 2.1%(-1.93)#22,376 |
| 93. | 77029 | 0.14% | 1.5%(-1.33)#1,235 | 2.1%(-1.95)#22,453 |
| 94. | 77073 | 0.094% | 1.5%(-1.37)#1,248 | 2.1%(-1.99)#22,556 |
1
Common Questions
What are the Top 10 Zip Codes with the Highest Percentage of Population Employed in Arts, Entertainment & Recreation in Houston, TX?
Top 10 Zip Codes with the Highest Percentage of Population Employed in Arts, Entertainment & Recreation in Houston, TX are:
What zip code has the Highest Percentage of Population Employed in Arts, Entertainment & Recreation in Houston, TX?
77204 has the Highest Percentage of Population Employed in Arts, Entertainment & Recreation in Houston, TX with 4.6%.
What is the Percentage of Population Employed in Arts, Entertainment & Recreation in Houston, TX?
Percentage of Population Employed in Arts, Entertainment & Recreation in Houston is 1.5%.
What is the Percentage of Population Employed in Arts, Entertainment & Recreation in Texas?
Percentage of Population Employed in Arts, Entertainment & Recreation in Texas is 1.5%.
What is the Percentage of Population Employed in Arts, Entertainment & Recreation in the United States?
Percentage of Population Employed in Arts, Entertainment & Recreation in the United States is 2.1%.