Zip Codes with the Highest Percentage of Population Employed in Health Care & Social Assistance in Houston, TX
RELATED REPORTS & OPTIONS
Health Care & Social Assistance
Houston
Compare Zip Codes
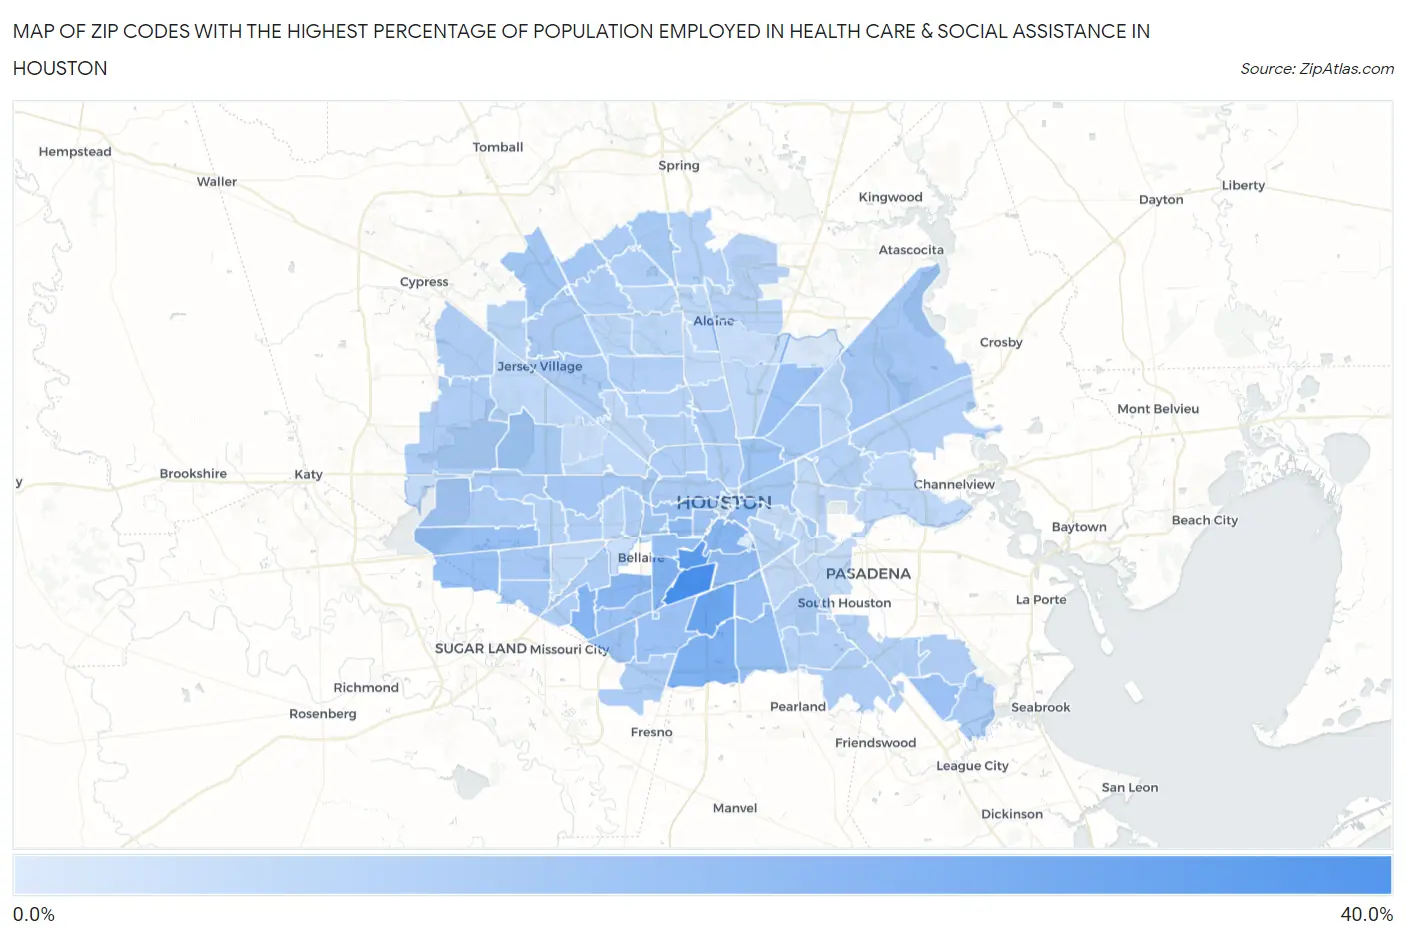
Map of Zip Codes with the Highest Percentage of Population Employed in Health Care & Social Assistance in Houston
2.2%
31.2%
Zip Codes with the Highest Percentage of Population Employed in Health Care & Social Assistance in Houston, TX
| Zip Code | % Employed | vs State | vs National | |
| 1. | 77054 | 31.2% | 11.9%(+19.3)#45 | 13.9%(+17.3)#830 |
| 2. | 77030 | 26.5% | 11.9%(+14.6)#69 | 13.9%(+12.6)#1,423 |
| 3. | 77051 | 23.6% | 11.9%(+11.7)#91 | 13.9%(+9.65)#2,112 |
| 4. | 77047 | 19.6% | 11.9%(+7.72)#166 | 13.9%(+5.71)#4,367 |
| 5. | 77025 | 18.6% | 11.9%(+6.67)#198 | 13.9%(+4.66)#5,428 |
| 6. | 77071 | 18.3% | 11.9%(+6.38)#208 | 13.9%(+4.37)#5,793 |
| 7. | 77004 | 17.8% | 11.9%(+5.90)#229 | 13.9%(+3.89)#6,414 |
| 8. | 77096 | 17.5% | 11.9%(+5.53)#241 | 13.9%(+3.52)#6,998 |
| 9. | 77098 | 17.0% | 11.9%(+5.03)#271 | 13.9%(+3.02)#7,784 |
| 10. | 77021 | 16.1% | 11.9%(+4.20)#318 | 13.9%(+2.19)#9,268 |
| 11. | 77005 | 15.1% | 11.9%(+3.14)#412 | 13.9%(+1.13)#11,509 |
| 12. | 77048 | 15.0% | 11.9%(+3.03)#424 | 13.9%(+1.02)#11,754 |
| 13. | 77083 | 14.8% | 11.9%(+2.84)#448 | 13.9%(+0.832)#12,179 |
| 14. | 77003 | 14.8% | 11.9%(+2.83)#451 | 13.9%(+0.817)#12,219 |
| 15. | 77082 | 14.7% | 11.9%(+2.81)#453 | 13.9%(+0.799)#12,254 |
| 16. | 77016 | 14.4% | 11.9%(+2.48)#491 | 13.9%(+0.473)#13,078 |
| 17. | 77045 | 14.3% | 11.9%(+2.39)#502 | 13.9%(+0.381)#13,290 |
| 18. | 77085 | 14.3% | 11.9%(+2.36)#504 | 13.9%(+0.353)#13,345 |
| 19. | 77033 | 14.2% | 11.9%(+2.30)#515 | 13.9%(+0.294)#13,504 |
| 20. | 77035 | 14.2% | 11.9%(+2.26)#518 | 13.9%(+0.253)#13,605 |
| 21. | 77019 | 13.8% | 11.9%(+1.87)#569 | 13.9%(-0.141)#14,579 |
| 22. | 77062 | 13.7% | 11.9%(+1.75)#584 | 13.9%(-0.260)#14,843 |
| 23. | 77026 | 13.5% | 11.9%(+1.56)#604 | 13.9%(-0.446)#15,304 |
| 24. | 77006 | 13.1% | 11.9%(+1.15)#660 | 13.9%(-0.864)#16,408 |
| 25. | 77070 | 12.5% | 11.9%(+0.604)#739 | 13.9%(-1.41)#17,769 |
| 26. | 77027 | 12.5% | 11.9%(+0.534)#742 | 13.9%(-1.48)#17,943 |
| 27. | 77024 | 12.3% | 11.9%(+0.328)#768 | 13.9%(-1.68)#18,464 |
| 28. | 77044 | 12.0% | 11.9%(+0.089)#813 | 13.9%(-1.92)#18,991 |
| 29. | 77099 | 11.9% | 11.9%(+0.010)#822 | 13.9%(-2.00)#19,158 |
| 30. | 77072 | 11.9% | 11.9%(-0.034)#827 | 13.9%(-2.04)#19,267 |
| 31. | 77069 | 11.9% | 11.9%(-0.045)#829 | 13.9%(-2.06)#19,297 |
| 32. | 77028 | 11.8% | 11.9%(-0.099)#838 | 13.9%(-2.11)#19,418 |
| 33. | 77090 | 11.6% | 11.9%(-0.311)#870 | 13.9%(-2.32)#19,923 |
| 34. | 77043 | 11.5% | 11.9%(-0.400)#881 | 13.9%(-2.41)#20,145 |
| 35. | 77020 | 11.5% | 11.9%(-0.431)#887 | 13.9%(-2.44)#20,223 |
| 36. | 77058 | 11.0% | 11.9%(-0.930)#962 | 13.9%(-2.94)#21,364 |
| 37. | 77074 | 10.9% | 11.9%(-0.989)#967 | 13.9%(-3.00)#21,480 |
| 38. | 77077 | 10.9% | 11.9%(-1.04)#978 | 13.9%(-3.05)#21,596 |
| 39. | 77079 | 10.9% | 11.9%(-1.04)#980 | 13.9%(-3.05)#21,605 |
| 40. | 77064 | 10.9% | 11.9%(-1.06)#984 | 13.9%(-3.07)#21,647 |
| 41. | 77040 | 10.8% | 11.9%(-1.17)#1,001 | 13.9%(-3.18)#21,903 |
| 42. | 77053 | 10.6% | 11.9%(-1.28)#1,017 | 13.9%(-3.29)#22,147 |
| 43. | 77022 | 10.6% | 11.9%(-1.30)#1,021 | 13.9%(-3.31)#22,173 |
| 44. | 77068 | 10.6% | 11.9%(-1.31)#1,027 | 13.9%(-3.32)#22,195 |
| 45. | 77007 | 10.6% | 11.9%(-1.33)#1,033 | 13.9%(-3.34)#22,248 |
| 46. | 77031 | 10.5% | 11.9%(-1.46)#1,055 | 13.9%(-3.47)#22,510 |
| 47. | 77084 | 10.4% | 11.9%(-1.55)#1,063 | 13.9%(-3.56)#22,700 |
| 48. | 77059 | 10.4% | 11.9%(-1.55)#1,065 | 13.9%(-3.56)#22,703 |
| 49. | 77095 | 10.3% | 11.9%(-1.59)#1,072 | 13.9%(-3.60)#22,791 |
| 50. | 77061 | 10.2% | 11.9%(-1.77)#1,105 | 13.9%(-3.78)#23,132 |
| 51. | 77089 | 10.1% | 11.9%(-1.78)#1,107 | 13.9%(-3.79)#23,144 |
| 52. | 77063 | 10.1% | 11.9%(-1.81)#1,110 | 13.9%(-3.82)#23,181 |
| 53. | 77066 | 10.1% | 11.9%(-1.87)#1,121 | 13.9%(-3.88)#23,301 |
| 54. | 77009 | 10.0% | 11.9%(-1.88)#1,126 | 13.9%(-3.89)#23,331 |
| 55. | 77014 | 9.9% | 11.9%(-2.02)#1,155 | 13.9%(-4.03)#23,610 |
| 56. | 77008 | 9.9% | 11.9%(-2.03)#1,158 | 13.9%(-4.04)#23,635 |
| 57. | 77056 | 9.8% | 11.9%(-2.10)#1,160 | 13.9%(-4.11)#23,761 |
| 58. | 77049 | 9.6% | 11.9%(-2.30)#1,191 | 13.9%(-4.31)#24,147 |
| 59. | 77073 | 9.6% | 11.9%(-2.34)#1,200 | 13.9%(-4.35)#24,219 |
| 60. | 77075 | 9.6% | 11.9%(-2.35)#1,201 | 13.9%(-4.36)#24,227 |
| 61. | 77034 | 9.6% | 11.9%(-2.36)#1,203 | 13.9%(-4.37)#24,246 |
| 62. | 77088 | 9.6% | 11.9%(-2.37)#1,205 | 13.9%(-4.38)#24,271 |
| 63. | 77018 | 9.3% | 11.9%(-2.66)#1,242 | 13.9%(-4.67)#24,768 |
| 64. | 77013 | 9.1% | 11.9%(-2.79)#1,254 | 13.9%(-4.80)#24,963 |
| 65. | 77023 | 9.0% | 11.9%(-2.94)#1,276 | 13.9%(-4.95)#25,184 |
| 66. | 77042 | 8.9% | 11.9%(-3.03)#1,293 | 13.9%(-5.04)#25,316 |
| 67. | 77032 | 8.8% | 11.9%(-3.08)#1,297 | 13.9%(-5.09)#25,385 |
| 68. | 77091 | 8.7% | 11.9%(-3.25)#1,331 | 13.9%(-5.26)#25,654 |
| 69. | 77076 | 8.6% | 11.9%(-3.28)#1,333 | 13.9%(-5.29)#25,690 |
| 70. | 77086 | 8.4% | 11.9%(-3.51)#1,362 | 13.9%(-5.52)#25,996 |
| 71. | 77010 | 8.3% | 11.9%(-3.67)#1,377 | 13.9%(-5.68)#26,206 |
| 72. | 77065 | 8.3% | 11.9%(-3.67)#1,378 | 13.9%(-5.68)#26,217 |
| 73. | 77057 | 8.2% | 11.9%(-3.68)#1,379 | 13.9%(-5.69)#26,225 |
| 74. | 77067 | 8.1% | 11.9%(-3.80)#1,391 | 13.9%(-5.81)#26,347 |
| 75. | 77078 | 7.9% | 11.9%(-4.05)#1,421 | 13.9%(-6.06)#26,632 |
| 76. | 77038 | 7.8% | 11.9%(-4.13)#1,430 | 13.9%(-6.14)#26,709 |
| 77. | 77093 | 7.6% | 11.9%(-4.31)#1,444 | 13.9%(-6.32)#26,881 |
| 78. | 77055 | 7.5% | 11.9%(-4.38)#1,453 | 13.9%(-6.39)#26,957 |
| 79. | 77092 | 7.5% | 11.9%(-4.39)#1,455 | 13.9%(-6.40)#26,966 |
| 80. | 77041 | 7.5% | 11.9%(-4.40)#1,458 | 13.9%(-6.41)#26,971 |
| 81. | 77060 | 7.5% | 11.9%(-4.42)#1,461 | 13.9%(-6.43)#26,989 |
| 82. | 77015 | 7.5% | 11.9%(-4.47)#1,467 | 13.9%(-6.48)#27,048 |
| 83. | 77036 | 7.1% | 11.9%(-4.85)#1,501 | 13.9%(-6.86)#27,429 |
| 84. | 77029 | 7.1% | 11.9%(-4.87)#1,502 | 13.9%(-6.88)#27,453 |
| 85. | 77087 | 6.9% | 11.9%(-4.98)#1,514 | 13.9%(-6.99)#27,561 |
| 86. | 77037 | 6.9% | 11.9%(-5.06)#1,522 | 13.9%(-7.07)#27,636 |
| 87. | 77017 | 6.7% | 11.9%(-5.22)#1,533 | 13.9%(-7.23)#27,781 |
| 88. | 77002 | 6.7% | 11.9%(-5.25)#1,535 | 13.9%(-7.26)#27,794 |
| 89. | 77011 | 6.6% | 11.9%(-5.32)#1,539 | 13.9%(-7.33)#27,866 |
| 90. | 77012 | 6.4% | 11.9%(-5.52)#1,548 | 13.9%(-7.53)#28,026 |
| 91. | 77094 | 6.0% | 11.9%(-5.88)#1,578 | 13.9%(-7.89)#28,352 |
| 92. | 77039 | 6.0% | 11.9%(-5.95)#1,582 | 13.9%(-7.96)#28,419 |
| 93. | 77080 | 5.9% | 11.9%(-6.07)#1,593 | 13.9%(-8.08)#28,513 |
| 94. | 77081 | 5.2% | 11.9%(-6.68)#1,630 | 13.9%(-8.69)#28,927 |
| 95. | 77050 | 3.1% | 11.9%(-8.87)#1,697 | 13.9%(-10.9)#30,012 |
| 96. | 77046 | 2.6% | 11.9%(-9.30)#1,711 | 13.9%(-11.3)#30,130 |
| 97. | 77204 | 2.2% | 11.9%(-9.75)#1,725 | 13.9%(-11.8)#30,262 |
1
Common Questions
What are the Top 10 Zip Codes with the Highest Percentage of Population Employed in Health Care & Social Assistance in Houston, TX?
Top 10 Zip Codes with the Highest Percentage of Population Employed in Health Care & Social Assistance in Houston, TX are:
What zip code has the Highest Percentage of Population Employed in Health Care & Social Assistance in Houston, TX?
77054 has the Highest Percentage of Population Employed in Health Care & Social Assistance in Houston, TX with 31.2%.
What is the Percentage of Population Employed in Health Care & Social Assistance in Houston, TX?
Percentage of Population Employed in Health Care & Social Assistance in Houston is 11.2%.
What is the Percentage of Population Employed in Health Care & Social Assistance in Texas?
Percentage of Population Employed in Health Care & Social Assistance in Texas is 11.9%.
What is the Percentage of Population Employed in Health Care & Social Assistance in the United States?
Percentage of Population Employed in Health Care & Social Assistance in the United States is 13.9%.