Zip Codes with the Highest Percentage of Not-for-profit Organizations in Houston, TX
RELATED REPORTS & OPTIONS
Not-for-profit Organizations
Houston
Compare Zip Codes
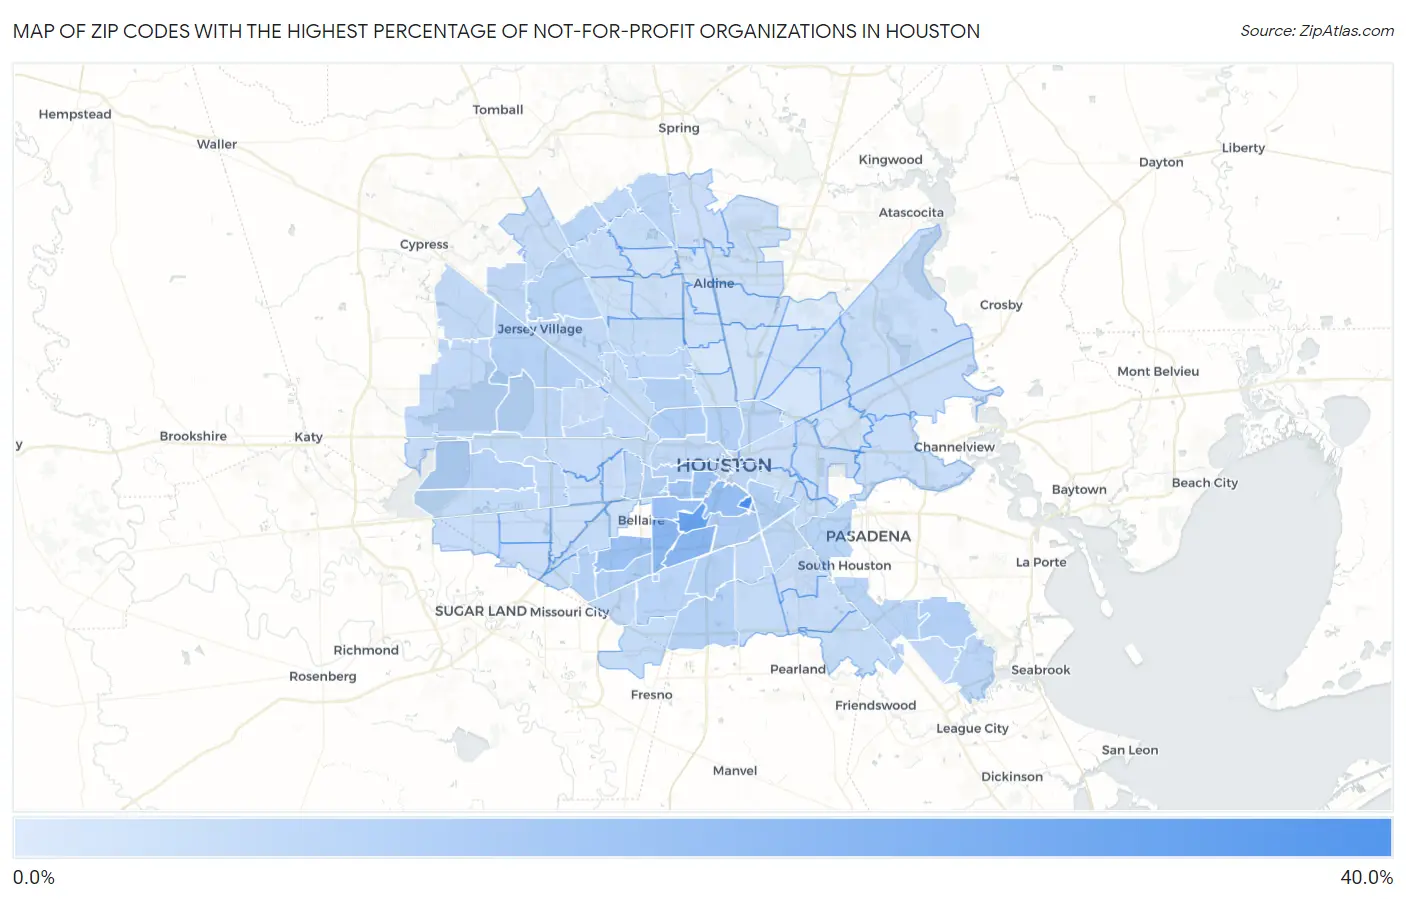
Map of Zip Codes with the Highest Percentage of Not-for-profit Organizations in Houston
0.14%
33.9%
Zip Codes with the Highest Percentage of Not-for-profit Organizations in Houston, TX
| Zip Code | % Employed in Not-for-profit | vs State | vs National | |
| 1. | 77204 | 33.9% | 5.8%(+28.1)#17 | 8.4%(+25.4)#345 |
| 2. | 77030 | 25.6% | 5.8%(+19.8)#25 | 8.4%(+17.1)#660 |
| 3. | 77054 | 17.7% | 5.8%(+11.9)#46 | 8.4%(+9.25)#1,796 |
| 4. | 77025 | 17.2% | 5.8%(+11.5)#48 | 8.4%(+8.80)#1,942 |
| 5. | 77004 | 14.6% | 5.8%(+8.82)#75 | 8.4%(+6.13)#3,194 |
| 6. | 77096 | 13.9% | 5.8%(+8.17)#86 | 8.4%(+5.48)#3,653 |
| 7. | 77005 | 13.6% | 5.8%(+7.89)#90 | 8.4%(+5.20)#3,889 |
| 8. | 77006 | 13.4% | 5.8%(+7.61)#94 | 8.4%(+4.93)#4,146 |
| 9. | 77098 | 12.4% | 5.8%(+6.63)#111 | 8.4%(+3.95)#5,161 |
| 10. | 77021 | 9.7% | 5.8%(+3.92)#195 | 8.4%(+1.23)#9,561 |
| 11. | 77035 | 9.2% | 5.8%(+3.46)#223 | 8.4%(+0.776)#10,552 |
| 12. | 77008 | 8.8% | 5.8%(+3.04)#249 | 8.4%(+0.360)#11,555 |
| 13. | 77027 | 8.7% | 5.8%(+2.99)#250 | 8.4%(+0.301)#11,692 |
| 14. | 77023 | 8.7% | 5.8%(+2.98)#252 | 8.4%(+0.295)#11,705 |
| 15. | 77059 | 8.7% | 5.8%(+2.93)#254 | 8.4%(+0.245)#11,831 |
| 16. | 77009 | 8.6% | 5.8%(+2.80)#265 | 8.4%(+0.111)#12,141 |
| 17. | 77019 | 8.2% | 5.8%(+2.48)#297 | 8.4%(-0.209)#12,998 |
| 18. | 77071 | 8.1% | 5.8%(+2.34)#315 | 8.4%(-0.341)#13,351 |
| 19. | 77041 | 8.0% | 5.8%(+2.25)#323 | 8.4%(-0.431)#13,596 |
| 20. | 77047 | 7.9% | 5.8%(+2.16)#333 | 8.4%(-0.526)#13,846 |
| 21. | 77018 | 7.9% | 5.8%(+2.16)#334 | 8.4%(-0.528)#13,852 |
| 22. | 77051 | 7.9% | 5.8%(+2.14)#338 | 8.4%(-0.548)#13,909 |
| 23. | 77010 | 7.7% | 5.8%(+1.91)#360 | 8.4%(-0.775)#14,569 |
| 24. | 77077 | 7.3% | 5.8%(+1.58)#406 | 8.4%(-1.10)#15,571 |
| 25. | 77045 | 7.3% | 5.8%(+1.53)#422 | 8.4%(-1.16)#15,759 |
| 26. | 77069 | 7.2% | 5.8%(+1.48)#432 | 8.4%(-1.21)#15,892 |
| 27. | 77034 | 7.1% | 5.8%(+1.36)#448 | 8.4%(-1.32)#16,203 |
| 28. | 77017 | 7.1% | 5.8%(+1.35)#451 | 8.4%(-1.33)#16,242 |
| 29. | 77064 | 7.0% | 5.8%(+1.20)#472 | 8.4%(-1.49)#16,694 |
| 30. | 77056 | 6.6% | 5.8%(+0.838)#541 | 8.4%(-1.85)#17,757 |
| 31. | 77058 | 6.5% | 5.8%(+0.762)#547 | 8.4%(-1.92)#17,959 |
| 32. | 77090 | 6.5% | 5.8%(+0.717)#557 | 8.4%(-1.97)#18,088 |
| 33. | 77026 | 6.5% | 5.8%(+0.697)#566 | 8.4%(-1.99)#18,156 |
| 34. | 77003 | 6.4% | 5.8%(+0.677)#571 | 8.4%(-2.01)#18,211 |
| 35. | 77068 | 6.3% | 5.8%(+0.567)#597 | 8.4%(-2.12)#18,540 |
| 36. | 77043 | 6.2% | 5.8%(+0.478)#612 | 8.4%(-2.21)#18,803 |
| 37. | 77087 | 6.2% | 5.8%(+0.462)#615 | 8.4%(-2.22)#18,837 |
| 38. | 77091 | 6.0% | 5.8%(+0.244)#649 | 8.4%(-2.44)#19,465 |
| 39. | 77055 | 5.9% | 5.8%(+0.125)#672 | 8.4%(-2.56)#19,793 |
| 40. | 77042 | 5.8% | 5.8%(+0.001)#698 | 8.4%(-2.68)#20,180 |
| 41. | 77065 | 5.8% | 5.8%(-0.003)#700 | 8.4%(-2.69)#20,191 |
| 42. | 77062 | 5.7% | 5.8%(-0.026)#706 | 8.4%(-2.71)#20,264 |
| 43. | 77040 | 5.7% | 5.8%(-0.101)#729 | 8.4%(-2.79)#20,505 |
| 44. | 77085 | 5.6% | 5.8%(-0.174)#744 | 8.4%(-2.86)#20,699 |
| 45. | 77007 | 5.6% | 5.8%(-0.190)#747 | 8.4%(-2.87)#20,742 |
| 46. | 77084 | 5.5% | 5.8%(-0.223)#757 | 8.4%(-2.91)#20,839 |
| 47. | 77033 | 5.5% | 5.8%(-0.283)#773 | 8.4%(-2.97)#21,007 |
| 48. | 77082 | 5.4% | 5.8%(-0.386)#796 | 8.4%(-3.07)#21,313 |
| 49. | 77095 | 5.4% | 5.8%(-0.396)#798 | 8.4%(-3.08)#21,334 |
| 50. | 77079 | 5.2% | 5.8%(-0.521)#830 | 8.4%(-3.21)#21,697 |
| 51. | 77074 | 4.9% | 5.8%(-0.855)#895 | 8.4%(-3.54)#22,553 |
| 52. | 77014 | 4.9% | 5.8%(-0.872)#899 | 8.4%(-3.56)#22,597 |
| 53. | 77048 | 4.7% | 5.8%(-1.06)#945 | 8.4%(-3.74)#23,069 |
| 54. | 77089 | 4.6% | 5.8%(-1.16)#974 | 8.4%(-3.84)#23,308 |
| 55. | 77053 | 4.6% | 5.8%(-1.16)#975 | 8.4%(-3.84)#23,309 |
| 56. | 77092 | 4.6% | 5.8%(-1.17)#978 | 8.4%(-3.85)#23,336 |
| 57. | 77088 | 4.5% | 5.8%(-1.26)#997 | 8.4%(-3.94)#23,543 |
| 58. | 77031 | 4.5% | 5.8%(-1.28)#1,007 | 8.4%(-3.96)#23,600 |
| 59. | 77066 | 4.4% | 5.8%(-1.32)#1,022 | 8.4%(-4.01)#23,705 |
| 60. | 77072 | 4.4% | 5.8%(-1.35)#1,030 | 8.4%(-4.03)#23,779 |
| 61. | 77024 | 4.4% | 5.8%(-1.38)#1,039 | 8.4%(-4.06)#23,845 |
| 62. | 77049 | 4.3% | 5.8%(-1.42)#1,050 | 8.4%(-4.11)#23,941 |
| 63. | 77075 | 4.3% | 5.8%(-1.48)#1,066 | 8.4%(-4.17)#24,071 |
| 64. | 77070 | 4.3% | 5.8%(-1.50)#1,070 | 8.4%(-4.18)#24,103 |
| 65. | 77029 | 4.2% | 5.8%(-1.52)#1,075 | 8.4%(-4.20)#24,155 |
| 66. | 77063 | 4.2% | 5.8%(-1.55)#1,085 | 8.4%(-4.23)#24,221 |
| 67. | 77078 | 4.1% | 5.8%(-1.63)#1,104 | 8.4%(-4.31)#24,386 |
| 68. | 77094 | 4.1% | 5.8%(-1.67)#1,117 | 8.4%(-4.35)#24,474 |
| 69. | 77015 | 4.1% | 5.8%(-1.69)#1,122 | 8.4%(-4.37)#24,525 |
| 70. | 77083 | 4.1% | 5.8%(-1.69)#1,123 | 8.4%(-4.37)#24,526 |
| 71. | 77012 | 4.1% | 5.8%(-1.70)#1,128 | 8.4%(-4.39)#24,567 |
| 72. | 77044 | 4.0% | 5.8%(-1.72)#1,132 | 8.4%(-4.40)#24,604 |
| 73. | 77080 | 3.8% | 5.8%(-1.99)#1,200 | 8.4%(-4.68)#25,203 |
| 74. | 77020 | 3.8% | 5.8%(-2.01)#1,203 | 8.4%(-4.69)#25,232 |
| 75. | 77057 | 3.7% | 5.8%(-2.03)#1,208 | 8.4%(-4.71)#25,282 |
| 76. | 77061 | 3.7% | 5.8%(-2.05)#1,214 | 8.4%(-4.73)#25,332 |
| 77. | 77002 | 3.7% | 5.8%(-2.08)#1,221 | 8.4%(-4.77)#25,398 |
| 78. | 77073 | 3.6% | 5.8%(-2.13)#1,231 | 8.4%(-4.82)#25,501 |
| 79. | 77099 | 3.6% | 5.8%(-2.16)#1,238 | 8.4%(-4.85)#25,563 |
| 80. | 77038 | 3.5% | 5.8%(-2.29)#1,266 | 8.4%(-4.98)#25,806 |
| 81. | 77016 | 3.4% | 5.8%(-2.31)#1,269 | 8.4%(-5.00)#25,833 |
| 82. | 77032 | 3.3% | 5.8%(-2.42)#1,300 | 8.4%(-5.11)#26,046 |
| 83. | 77036 | 3.3% | 5.8%(-2.44)#1,303 | 8.4%(-5.13)#26,081 |
| 84. | 77037 | 3.2% | 5.8%(-2.52)#1,313 | 8.4%(-5.20)#26,224 |
| 85. | 77039 | 3.2% | 5.8%(-2.59)#1,327 | 8.4%(-5.28)#26,346 |
| 86. | 77022 | 3.1% | 5.8%(-2.71)#1,346 | 8.4%(-5.39)#26,541 |
| 87. | 77011 | 2.8% | 5.8%(-2.93)#1,391 | 8.4%(-5.61)#26,890 |
| 88. | 77081 | 2.8% | 5.8%(-2.96)#1,399 | 8.4%(-5.64)#26,937 |
| 89. | 77086 | 2.7% | 5.8%(-3.03)#1,410 | 8.4%(-5.71)#27,041 |
| 90. | 77093 | 2.5% | 5.8%(-3.22)#1,440 | 8.4%(-5.91)#27,316 |
| 91. | 77067 | 2.5% | 5.8%(-3.25)#1,447 | 8.4%(-5.93)#27,360 |
| 92. | 77060 | 2.5% | 5.8%(-3.30)#1,453 | 8.4%(-5.98)#27,417 |
| 93. | 77013 | 2.2% | 5.8%(-3.51)#1,480 | 8.4%(-6.20)#27,718 |
| 94. | 77028 | 2.0% | 5.8%(-3.71)#1,506 | 8.4%(-6.40)#27,930 |
| 95. | 77076 | 1.7% | 5.8%(-4.04)#1,551 | 8.4%(-6.73)#28,307 |
| 96. | 77046 | 1.4% | 5.8%(-4.40)#1,583 | 8.4%(-7.08)#28,633 |
| 97. | 77050 | 0.14% | 5.8%(-5.62)#1,651 | 8.4%(-8.31)#29,310 |
1
Common Questions
What are the Top 10 Zip Codes with the Highest Percentage of Not-for-profit Organizations in Houston, TX?
Top 10 Zip Codes with the Highest Percentage of Not-for-profit Organizations in Houston, TX are:
What zip code has the Highest Percentage of Not-for-profit Organizations in Houston, TX?
77204 has the Highest Percentage of Not-for-profit Organizations in Houston, TX with 33.9%.
What is the Percentage of Not-for-profit Organizations in Houston, TX?
Percentage of Not-for-profit Organizations in Houston is 6.4%.
What is the Percentage of Not-for-profit Organizations in Texas?
Percentage of Not-for-profit Organizations in Texas is 5.8%.
What is the Percentage of Not-for-profit Organizations in the United States?
Percentage of Not-for-profit Organizations in the United States is 8.4%.