Zip Codes with the Highest Percentage of Population Employed in Arts, Media & Entertainment in Houston, TX
RELATED REPORTS & OPTIONS
Arts, Media & Entertainment
Houston
Compare Zip Codes
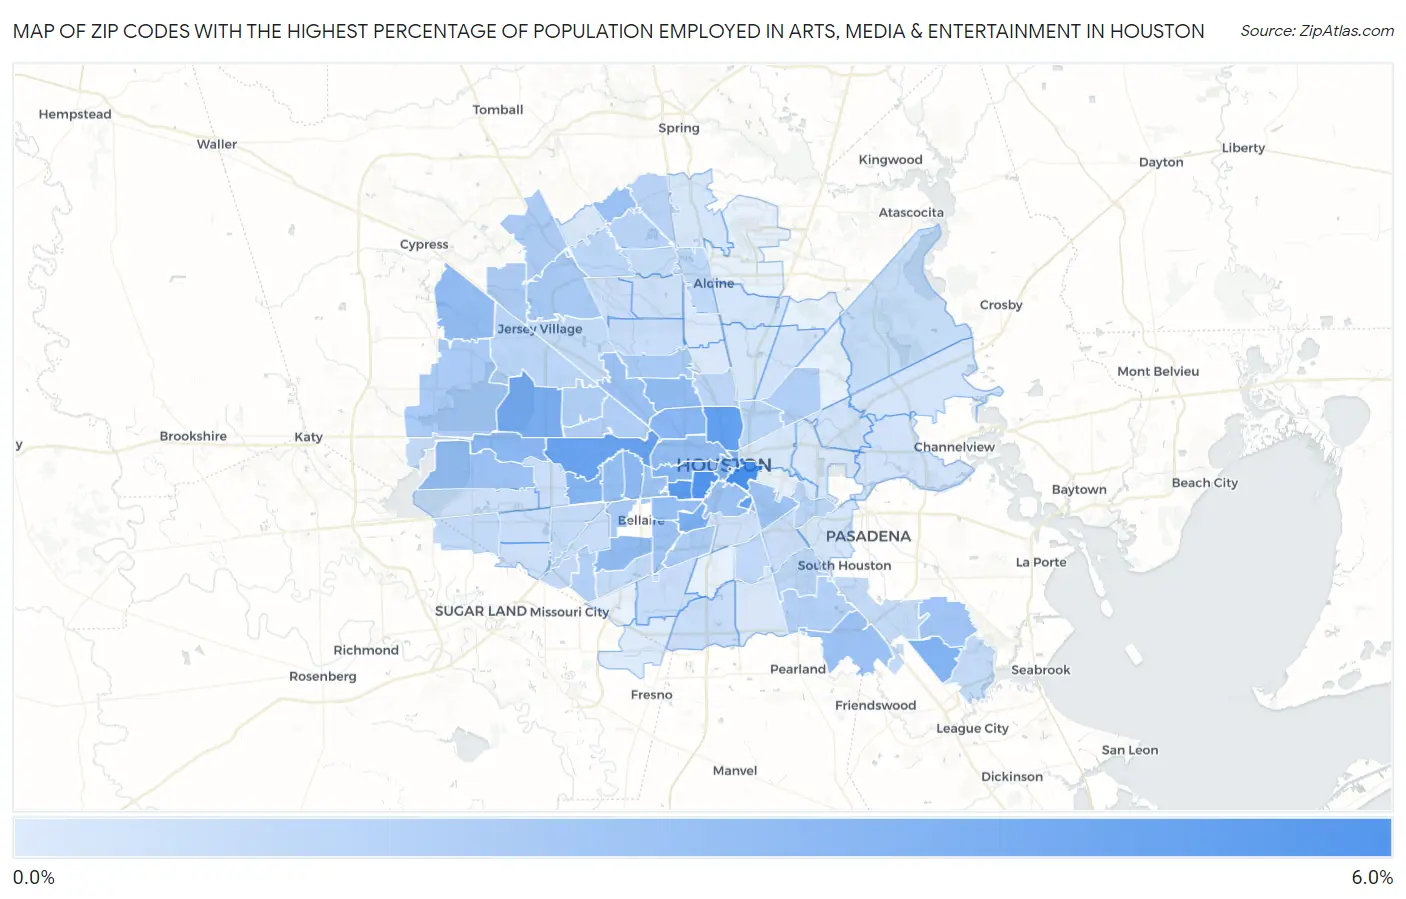
Map of Zip Codes with the Highest Percentage of Population Employed in Arts, Media & Entertainment in Houston
0.21%
5.2%
Zip Codes with the Highest Percentage of Population Employed in Arts, Media & Entertainment in Houston, TX
| Zip Code | % Employed | vs State | vs National | |
| 1. | 77003 | 5.2% | 1.7%(+3.52)#45 | 2.1%(+3.12)#1,408 |
| 2. | 77006 | 4.8% | 1.7%(+3.18)#51 | 2.1%(+2.77)#1,592 |
| 3. | 77098 | 4.6% | 1.7%(+2.98)#54 | 2.1%(+2.58)#1,743 |
| 4. | 77204 | 4.3% | 1.7%(+2.69)#62 | 2.1%(+2.29)#1,984 |
| 5. | 77009 | 4.2% | 1.7%(+2.56)#71 | 2.1%(+2.16)#2,136 |
| 6. | 77024 | 4.1% | 1.7%(+2.43)#78 | 2.1%(+2.03)#2,262 |
| 7. | 77043 | 3.4% | 1.7%(+1.78)#120 | 2.1%(+1.38)#3,156 |
| 8. | 77030 | 3.4% | 1.7%(+1.71)#128 | 2.1%(+1.30)#3,321 |
| 9. | 77062 | 3.2% | 1.7%(+1.55)#144 | 2.1%(+1.15)#3,596 |
| 10. | 77002 | 3.2% | 1.7%(+1.54)#145 | 2.1%(+1.14)#3,616 |
| 11. | 77063 | 3.2% | 1.7%(+1.50)#153 | 2.1%(+1.09)#3,731 |
| 12. | 77019 | 3.0% | 1.7%(+1.39)#165 | 2.1%(+0.988)#3,973 |
| 13. | 77008 | 3.0% | 1.7%(+1.31)#171 | 2.1%(+0.904)#4,168 |
| 14. | 77079 | 3.0% | 1.7%(+1.29)#173 | 2.1%(+0.889)#4,208 |
| 15. | 77056 | 2.9% | 1.7%(+1.22)#180 | 2.1%(+0.816)#4,406 |
| 16. | 77018 | 2.7% | 1.7%(+1.02)#205 | 2.1%(+0.618)#4,971 |
| 17. | 77096 | 2.7% | 1.7%(+1.02)#206 | 2.1%(+0.617)#4,972 |
| 18. | 77007 | 2.7% | 1.7%(+0.995)#214 | 2.1%(+0.590)#5,060 |
| 19. | 77095 | 2.6% | 1.7%(+0.966)#219 | 2.1%(+0.561)#5,161 |
| 20. | 77057 | 2.5% | 1.7%(+0.879)#230 | 2.1%(+0.474)#5,441 |
| 21. | 77005 | 2.5% | 1.7%(+0.861)#233 | 2.1%(+0.456)#5,501 |
| 22. | 77089 | 2.4% | 1.7%(+0.694)#266 | 2.1%(+0.289)#6,138 |
| 23. | 77004 | 2.3% | 1.7%(+0.666)#278 | 2.1%(+0.261)#6,282 |
| 24. | 77077 | 2.3% | 1.7%(+0.651)#282 | 2.1%(+0.246)#6,356 |
| 25. | 77068 | 2.3% | 1.7%(+0.643)#286 | 2.1%(+0.238)#6,384 |
| 26. | 77092 | 2.3% | 1.7%(+0.639)#289 | 2.1%(+0.234)#6,397 |
| 27. | 77027 | 2.3% | 1.7%(+0.621)#294 | 2.1%(+0.216)#6,471 |
| 28. | 77023 | 2.3% | 1.7%(+0.609)#297 | 2.1%(+0.204)#6,531 |
| 29. | 77059 | 2.2% | 1.7%(+0.513)#321 | 2.1%(+0.108)#6,963 |
| 30. | 77025 | 2.2% | 1.7%(+0.505)#324 | 2.1%(+0.100)#6,995 |
| 31. | 77064 | 2.0% | 1.7%(+0.315)#370 | 2.1%(-0.090)#7,974 |
| 32. | 77081 | 1.9% | 1.7%(+0.262)#382 | 2.1%(-0.143)#8,268 |
| 33. | 77091 | 1.9% | 1.7%(+0.259)#386 | 2.1%(-0.146)#8,289 |
| 34. | 77084 | 1.9% | 1.7%(+0.204)#404 | 2.1%(-0.201)#8,616 |
| 35. | 77070 | 1.8% | 1.7%(+0.162)#418 | 2.1%(-0.243)#8,880 |
| 36. | 77054 | 1.8% | 1.7%(+0.157)#420 | 2.1%(-0.248)#8,907 |
| 37. | 77065 | 1.8% | 1.7%(+0.120)#437 | 2.1%(-0.285)#9,120 |
| 38. | 77055 | 1.7% | 1.7%(+0.056)#459 | 2.1%(-0.349)#9,526 |
| 39. | 77080 | 1.7% | 1.7%(-0.000)#494 | 2.1%(-0.405)#9,951 |
| 40. | 77028 | 1.6% | 1.7%(-0.049)#517 | 2.1%(-0.454)#10,294 |
| 41. | 77071 | 1.6% | 1.7%(-0.094)#535 | 2.1%(-0.499)#10,571 |
| 42. | 77075 | 1.5% | 1.7%(-0.124)#557 | 2.1%(-0.529)#10,772 |
| 43. | 77014 | 1.4% | 1.7%(-0.234)#600 | 2.1%(-0.639)#11,549 |
| 44. | 77090 | 1.4% | 1.7%(-0.243)#606 | 2.1%(-0.648)#11,621 |
| 45. | 77026 | 1.3% | 1.7%(-0.345)#643 | 2.1%(-0.750)#12,365 |
| 46. | 77041 | 1.3% | 1.7%(-0.355)#650 | 2.1%(-0.760)#12,450 |
| 47. | 77012 | 1.3% | 1.7%(-0.356)#651 | 2.1%(-0.761)#12,458 |
| 48. | 77061 | 1.3% | 1.7%(-0.379)#667 | 2.1%(-0.784)#12,622 |
| 49. | 77066 | 1.3% | 1.7%(-0.395)#677 | 2.1%(-0.800)#12,766 |
| 50. | 77046 | 1.3% | 1.7%(-0.397)#678 | 2.1%(-0.802)#12,778 |
| 51. | 77022 | 1.3% | 1.7%(-0.400)#682 | 2.1%(-0.805)#12,808 |
| 52. | 77060 | 1.2% | 1.7%(-0.458)#710 | 2.1%(-0.863)#13,248 |
| 53. | 77033 | 1.2% | 1.7%(-0.461)#712 | 2.1%(-0.866)#13,268 |
| 54. | 77031 | 1.1% | 1.7%(-0.532)#740 | 2.1%(-0.937)#13,796 |
| 55. | 77083 | 1.1% | 1.7%(-0.599)#770 | 2.1%(-1.00)#14,349 |
| 56. | 77040 | 1.0% | 1.7%(-0.607)#777 | 2.1%(-1.01)#14,413 |
| 57. | 77036 | 1.0% | 1.7%(-0.608)#778 | 2.1%(-1.01)#14,421 |
| 58. | 77035 | 1.0% | 1.7%(-0.616)#784 | 2.1%(-1.02)#14,496 |
| 59. | 77094 | 1.0% | 1.7%(-0.639)#798 | 2.1%(-1.04)#14,672 |
| 60. | 77034 | 1.0% | 1.7%(-0.639)#799 | 2.1%(-1.04)#14,673 |
| 61. | 77058 | 1.00% | 1.7%(-0.658)#806 | 2.1%(-1.06)#14,820 |
| 62. | 77067 | 0.98% | 1.7%(-0.672)#813 | 2.1%(-1.08)#14,949 |
| 63. | 77044 | 0.97% | 1.7%(-0.683)#821 | 2.1%(-1.09)#15,043 |
| 64. | 77074 | 0.91% | 1.7%(-0.744)#857 | 2.1%(-1.15)#15,541 |
| 65. | 77072 | 0.91% | 1.7%(-0.746)#859 | 2.1%(-1.15)#15,563 |
| 66. | 77045 | 0.89% | 1.7%(-0.765)#867 | 2.1%(-1.17)#15,704 |
| 67. | 77047 | 0.89% | 1.7%(-0.765)#868 | 2.1%(-1.17)#15,705 |
| 68. | 77088 | 0.86% | 1.7%(-0.796)#880 | 2.1%(-1.20)#15,967 |
| 69. | 77086 | 0.83% | 1.7%(-0.830)#895 | 2.1%(-1.23)#16,207 |
| 70. | 77087 | 0.79% | 1.7%(-0.863)#912 | 2.1%(-1.27)#16,479 |
| 71. | 77042 | 0.77% | 1.7%(-0.883)#922 | 2.1%(-1.29)#16,644 |
| 72. | 77082 | 0.70% | 1.7%(-0.958)#965 | 2.1%(-1.36)#17,259 |
| 73. | 77021 | 0.68% | 1.7%(-0.977)#973 | 2.1%(-1.38)#17,437 |
| 74. | 77099 | 0.67% | 1.7%(-0.988)#984 | 2.1%(-1.39)#17,518 |
| 75. | 77038 | 0.64% | 1.7%(-1.02)#998 | 2.1%(-1.43)#17,778 |
| 76. | 77016 | 0.58% | 1.7%(-1.07)#1,021 | 2.1%(-1.48)#18,174 |
| 77. | 77015 | 0.56% | 1.7%(-1.10)#1,035 | 2.1%(-1.50)#18,386 |
| 78. | 77013 | 0.55% | 1.7%(-1.10)#1,038 | 2.1%(-1.51)#18,427 |
| 79. | 77049 | 0.54% | 1.7%(-1.12)#1,048 | 2.1%(-1.52)#18,557 |
| 80. | 77039 | 0.51% | 1.7%(-1.14)#1,061 | 2.1%(-1.55)#18,758 |
| 81. | 77073 | 0.46% | 1.7%(-1.19)#1,082 | 2.1%(-1.60)#19,167 |
| 82. | 77020 | 0.43% | 1.7%(-1.23)#1,097 | 2.1%(-1.63)#19,435 |
| 83. | 77093 | 0.42% | 1.7%(-1.24)#1,103 | 2.1%(-1.64)#19,518 |
| 84. | 77017 | 0.40% | 1.7%(-1.25)#1,110 | 2.1%(-1.66)#19,612 |
| 85. | 77048 | 0.39% | 1.7%(-1.26)#1,117 | 2.1%(-1.67)#19,686 |
| 86. | 77069 | 0.35% | 1.7%(-1.31)#1,137 | 2.1%(-1.71)#19,992 |
| 87. | 77029 | 0.33% | 1.7%(-1.32)#1,147 | 2.1%(-1.73)#20,107 |
| 88. | 77076 | 0.32% | 1.7%(-1.34)#1,154 | 2.1%(-1.74)#20,223 |
| 89. | 77037 | 0.30% | 1.7%(-1.36)#1,162 | 2.1%(-1.76)#20,345 |
| 90. | 77053 | 0.21% | 1.7%(-1.45)#1,199 | 2.1%(-1.85)#20,906 |
1
Common Questions
What are the Top 10 Zip Codes with the Highest Percentage of Population Employed in Arts, Media & Entertainment in Houston, TX?
Top 10 Zip Codes with the Highest Percentage of Population Employed in Arts, Media & Entertainment in Houston, TX are:
What zip code has the Highest Percentage of Population Employed in Arts, Media & Entertainment in Houston, TX?
77003 has the Highest Percentage of Population Employed in Arts, Media & Entertainment in Houston, TX with 5.2%.
What is the Percentage of Population Employed in Arts, Media & Entertainment in Houston, TX?
Percentage of Population Employed in Arts, Media & Entertainment in Houston is 1.8%.
What is the Percentage of Population Employed in Arts, Media & Entertainment in Texas?
Percentage of Population Employed in Arts, Media & Entertainment in Texas is 1.7%.
What is the Percentage of Population Employed in Arts, Media & Entertainment in the United States?
Percentage of Population Employed in Arts, Media & Entertainment in the United States is 2.1%.