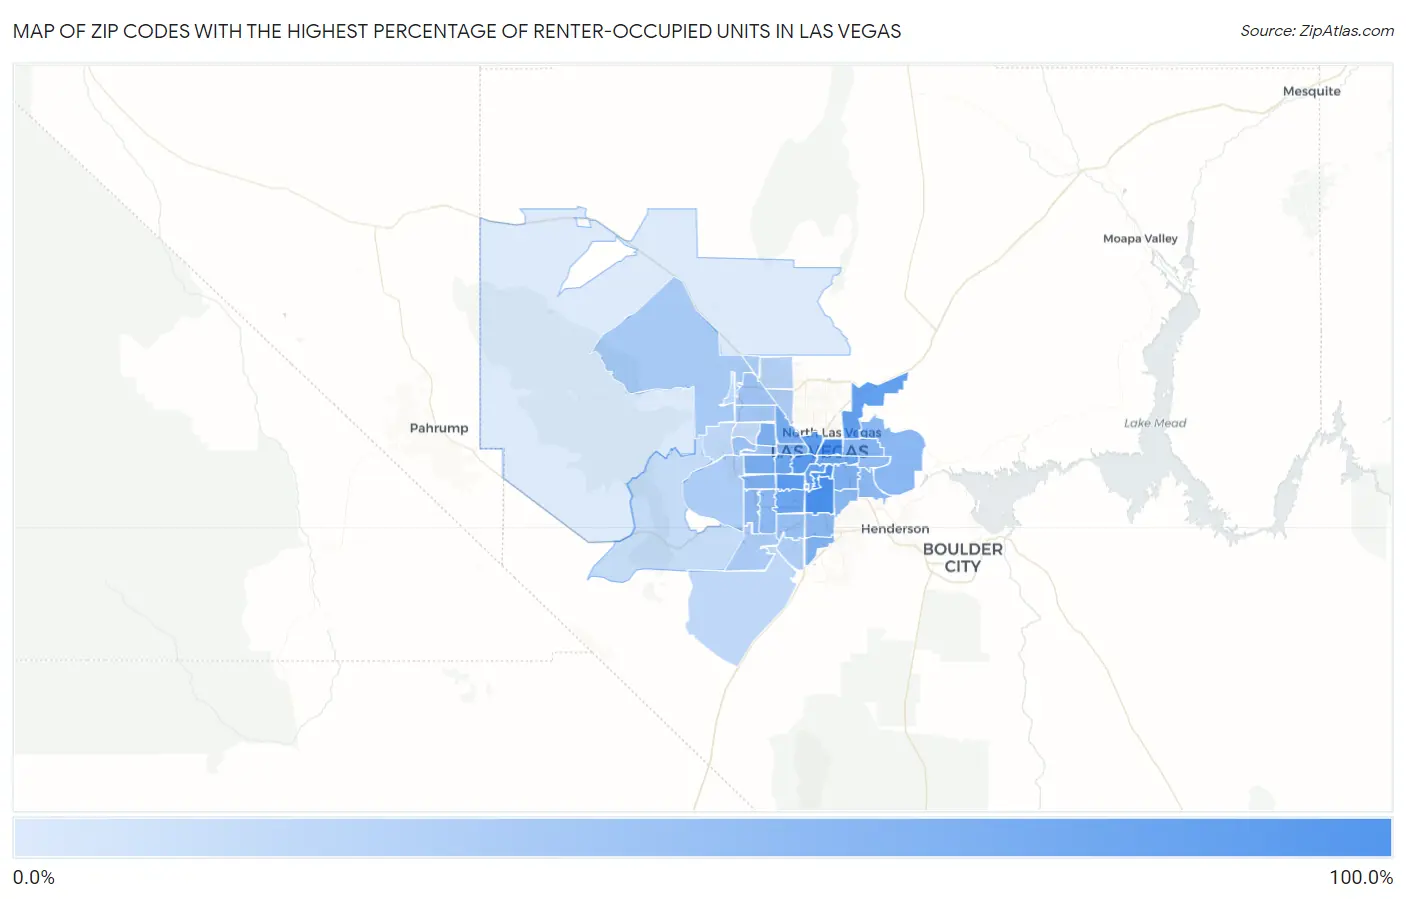
Zip Codes with the Highest Percentage of Renter-Occupied Units in Las Vegas, NV
RELATED REPORTS & OPTIONS
Highest Renter-Occupied
Las Vegas
Compare Zip Codes
Map of Zip Codes with the Highest Percentage of Renter-Occupied Units in Las Vegas
7.3%
81.0%

Zip Codes with the Highest Percentage of Renter-Occupied Units in Las Vegas, NV
| Zip Code | % Renter-Occupied | vs State | vs National | |
| 1. | 89101 | 81.0% | 41.6%(+39.4)#4 | 35.2%(+45.8)#645 |
| 2. | 89119 | 80.0% | 41.6%(+38.4)#5 | 35.2%(+44.8)#671 |
| 3. | 89169 | 79.9% | 41.6%(+38.3)#6 | 35.2%(+44.7)#674 |
| 4. | 89102 | 71.0% | 41.6%(+29.4)#9 | 35.2%(+35.8)#1,012 |
| 5. | 89103 | 68.9% | 41.6%(+27.3)#10 | 35.2%(+33.7)#1,123 |
| 6. | 89106 | 67.6% | 41.6%(+26.1)#11 | 35.2%(+32.5)#1,201 |
| 7. | 89115 | 64.5% | 41.6%(+22.9)#15 | 35.2%(+29.3)#1,411 |
| 8. | 89109 | 63.7% | 41.6%(+22.2)#16 | 35.2%(+28.5)#1,487 |
| 9. | 89146 | 59.1% | 41.6%(+17.5)#18 | 35.2%(+23.9)#1,895 |
| 10. | 89118 | 58.9% | 41.6%(+17.3)#19 | 35.2%(+23.7)#1,906 |
| 11. | 89104 | 57.3% | 41.6%(+15.7)#21 | 35.2%(+22.1)#2,072 |
| 12. | 89108 | 52.6% | 41.6%(+11.0)#30 | 35.2%(+17.4)#2,690 |
| 13. | 89117 | 52.4% | 41.6%(+10.8)#31 | 35.2%(+17.2)#2,715 |
| 14. | 89128 | 50.2% | 41.6%(+8.67)#32 | 35.2%(+15.1)#3,043 |
| 15. | 89121 | 49.5% | 41.6%(+7.90)#34 | 35.2%(+14.3)#3,181 |
| 16. | 89147 | 49.0% | 41.6%(+7.43)#36 | 35.2%(+13.8)#3,270 |
| 17. | 89107 | 48.2% | 41.6%(+6.67)#37 | 35.2%(+13.1)#3,397 |
| 18. | 89183 | 47.4% | 41.6%(+5.87)#38 | 35.2%(+12.3)#3,557 |
| 19. | 89110 | 46.2% | 41.6%(+4.61)#42 | 35.2%(+11.0)#3,791 |
| 20. | 89158 | 45.6% | 41.6%(+4.02)#43 | 35.2%(+10.4)#3,927 |
| 21. | 89123 | 43.8% | 41.6%(+2.28)#47 | 35.2%(+8.66)#4,360 |
| 22. | 89120 | 43.4% | 41.6%(+1.84)#49 | 35.2%(+8.22)#4,468 |
| 23. | 89156 | 43.1% | 41.6%(+1.55)#50 | 35.2%(+7.93)#4,552 |
| 24. | 89113 | 42.6% | 41.6%(+1.02)#51 | 35.2%(+7.40)#4,695 |
| 25. | 89122 | 42.1% | 41.6%(+0.486)#53 | 35.2%(+6.87)#4,822 |
| 26. | 89148 | 41.2% | 41.6%(-0.357)#55 | 35.2%(+6.03)#5,043 |
| 27. | 89142 | 38.7% | 41.6%(-2.83)#61 | 35.2%(+3.56)#5,809 |
| 28. | 89139 | 37.0% | 41.6%(-4.60)#68 | 35.2%(+1.79)#6,497 |
| 29. | 89144 | 34.9% | 41.6%(-6.64)#71 | 35.2%(-0.258)#7,390 |
| 30. | 89145 | 34.4% | 41.6%(-7.20)#73 | 35.2%(-0.820)#7,682 |
| 31. | 89149 | 32.2% | 41.6%(-9.35)#82 | 35.2%(-2.97)#8,726 |
| 32. | 89129 | 31.1% | 41.6%(-10.5)#88 | 35.2%(-4.12)#9,395 |
| 33. | 89166 | 28.9% | 41.6%(-12.6)#99 | 35.2%(-6.25)#10,747 |
| 34. | 89178 | 28.5% | 41.6%(-13.0)#101 | 35.2%(-6.64)#11,012 |
| 35. | 89130 | 27.2% | 41.6%(-14.3)#109 | 35.2%(-7.94)#11,933 |
| 36. | 89143 | 26.9% | 41.6%(-14.7)#111 | 35.2%(-8.29)#12,175 |
| 37. | 89135 | 26.8% | 41.6%(-14.8)#112 | 35.2%(-8.40)#12,245 |
| 38. | 89141 | 25.6% | 41.6%(-15.9)#116 | 35.2%(-9.56)#13,117 |
| 39. | 89131 | 22.7% | 41.6%(-18.9)#123 | 35.2%(-12.5)#15,714 |
| 40. | 89138 | 19.7% | 41.6%(-21.9)#128 | 35.2%(-15.5)#18,522 |
| 41. | 89179 | 18.7% | 41.6%(-22.9)#130 | 35.2%(-16.5)#19,477 |
| 42. | 89134 | 17.9% | 41.6%(-23.7)#133 | 35.2%(-17.3)#20,281 |
| 43. | 89161 | 16.3% | 41.6%(-25.3)#140 | 35.2%(-18.9)#21,840 |
| 44. | 89124 | 7.3% | 41.6%(-34.3)#156 | 35.2%(-27.9)#29,016 |
1
Common Questions
What are the Top 10 Zip Codes with the Highest Percentage of Renter-Occupied Units in Las Vegas, NV?
Top 10 Zip Codes with the Highest Percentage of Renter-Occupied Units in Las Vegas, NV are:
What zip code has the Highest Percentage of Renter-Occupied Units in Las Vegas, NV?
89101 has the Highest Percentage of Renter-Occupied Units in Las Vegas, NV with 81.0%.
What is the Percentage of Renter-Occupied Units in Las Vegas, NV?
Percentage of Renter-Occupied Units in Las Vegas is 45.2%.
What is the Percentage of Renter-Occupied Units in Nevada?
Percentage of Renter-Occupied Units in Nevada is 41.6%.
What is the Percentage of Renter-Occupied Units in the United States?
Percentage of Renter-Occupied Units in the United States is 35.2%.