Zip Codes with the Highest Percentage of Renter-Occupied Units in Pahrump, NV
RELATED REPORTS & OPTIONS
Highest Renter-Occupied
Pahrump
Compare Zip Codes
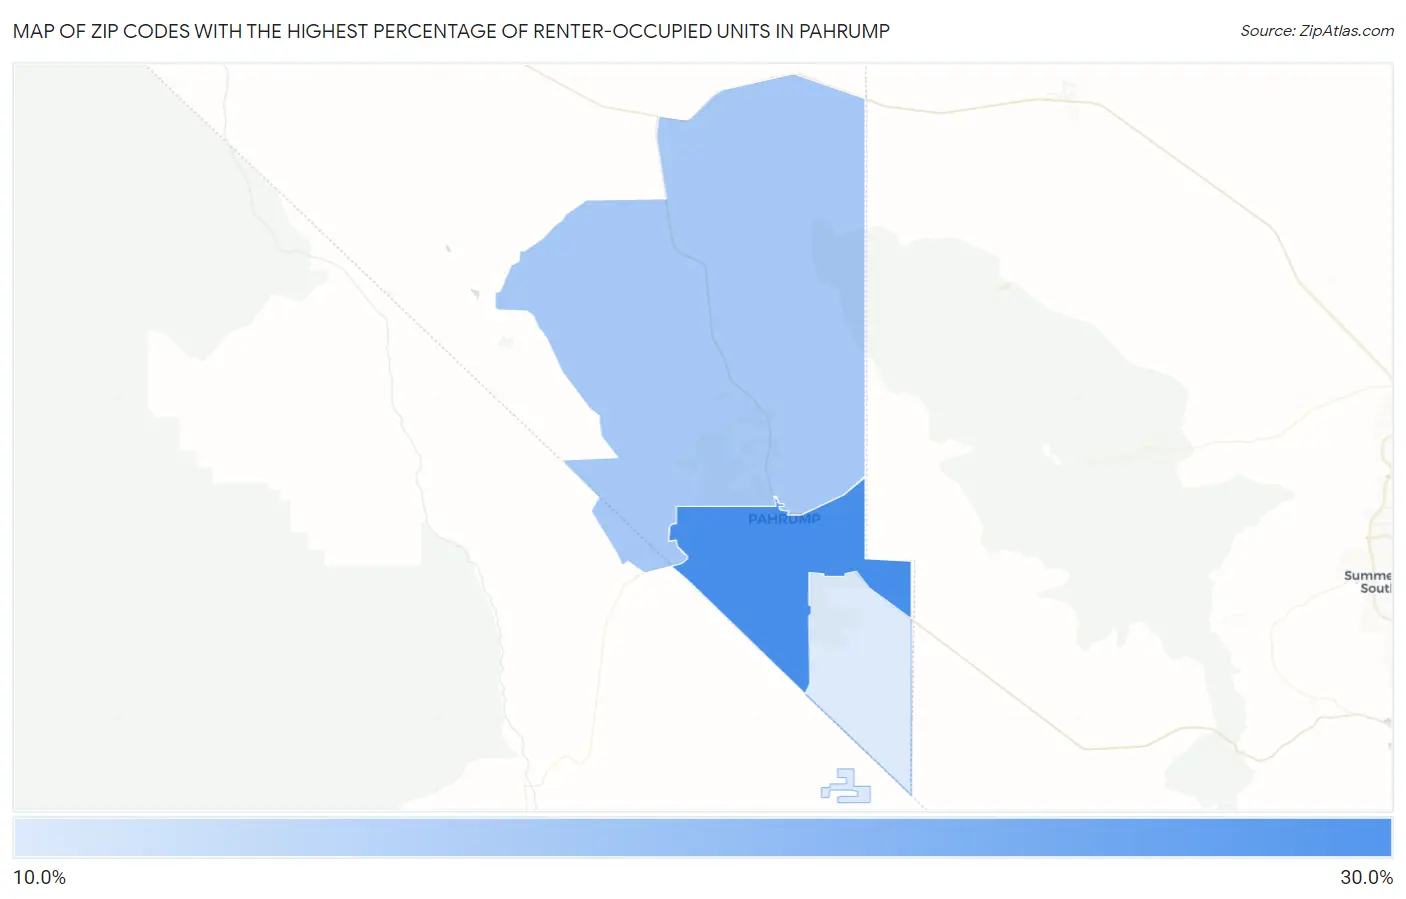
Map of Zip Codes with the Highest Percentage of Renter-Occupied Units in Pahrump
11.1%
27.9%
Zip Codes with the Highest Percentage of Renter-Occupied Units in Pahrump, NV
| Zip Code | % Renter-Occupied | vs State | vs National | |
| 1. | 89048 | 27.9% | 41.6%(-13.6)#106 | 35.2%(-7.25)#11,453 |
| 2. | 89060 | 17.2% | 41.6%(-24.4)#137 | 35.2%(-18.0)#20,995 |
| 3. | 89061 | 11.1% | 41.6%(-30.4)#147 | 35.2%(-24.1)#26,484 |
1
Common Questions
What are the Top Zip Codes with the Highest Percentage of Renter-Occupied Units in Pahrump, NV?
Top Zip Codes with the Highest Percentage of Renter-Occupied Units in Pahrump, NV are:
What zip code has the Highest Percentage of Renter-Occupied Units in Pahrump, NV?
89048 has the Highest Percentage of Renter-Occupied Units in Pahrump, NV with 27.9%.
What is the Percentage of Renter-Occupied Units in Pahrump, NV?
Percentage of Renter-Occupied Units in Pahrump is 21.8%.
What is the Percentage of Renter-Occupied Units in Nevada?
Percentage of Renter-Occupied Units in Nevada is 41.6%.
What is the Percentage of Renter-Occupied Units in the United States?
Percentage of Renter-Occupied Units in the United States is 35.2%.