Fox Lake, MT Map & Demographics
Fox Lake Map
Fox Lake Overview
$33,106
PER CAPITA INCOME
$81,250
AVG FAMILY INCOME
$127,557
AVG HOUSEHOLD INCOME
0.34
INEQUALITY / GINI INDEX
174
TOTAL POPULATION
85
MALE POPULATION
89
FEMALE POPULATION
95.51
MALES / 100 FEMALES
104.71
FEMALES / 100 MALES
23.0
MEDIAN AGE
4.4
AVG FAMILY SIZE
3.0
AVG HOUSEHOLD SIZE
98
LABOR FORCE [ PEOPLE ]
82.4%
PERCENT IN LABOR FORCE
Income in Fox Lake
Income Overview in Fox Lake
Per Capita Income in Fox Lake is $33,106, while median incomes of families and households are $81,250 and $127,557 respectively.
| Characteristic | Number | Measure |
| Per Capita Income | 174 | $33,106 |
| Median Family Income | 30 | $81,250 |
| Mean Family Income | 30 | $100,147 |
| Median Household Income | 59 | $127,557 |
| Mean Household Income | 59 | $118,220 |
| Income Deficit | 30 | $0 |
| Wage / Income Gap (%) | 174 | 0.00% |
| Wage / Income Gap ($) | 174 | 100.00¢ per $1 |
| Gini / Inequality Index | 174 | 0.34 |
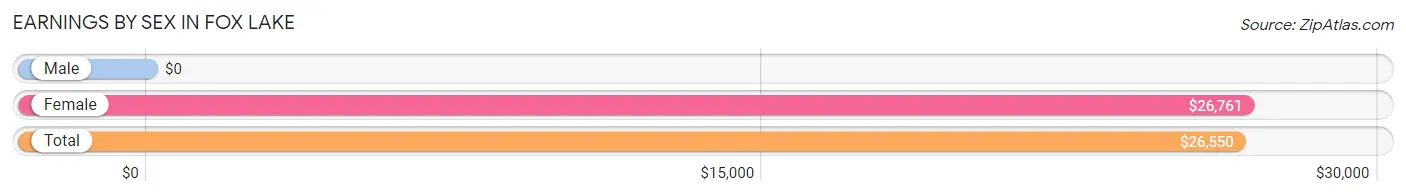
Earnings by Sex in Fox Lake
| Sex | Number | Average Earnings |
| Male | 54 (53.5%) | $0 |
| Female | 47 (46.5%) | $26,761 |
| Total | 101 (100.0%) | $26,550 |
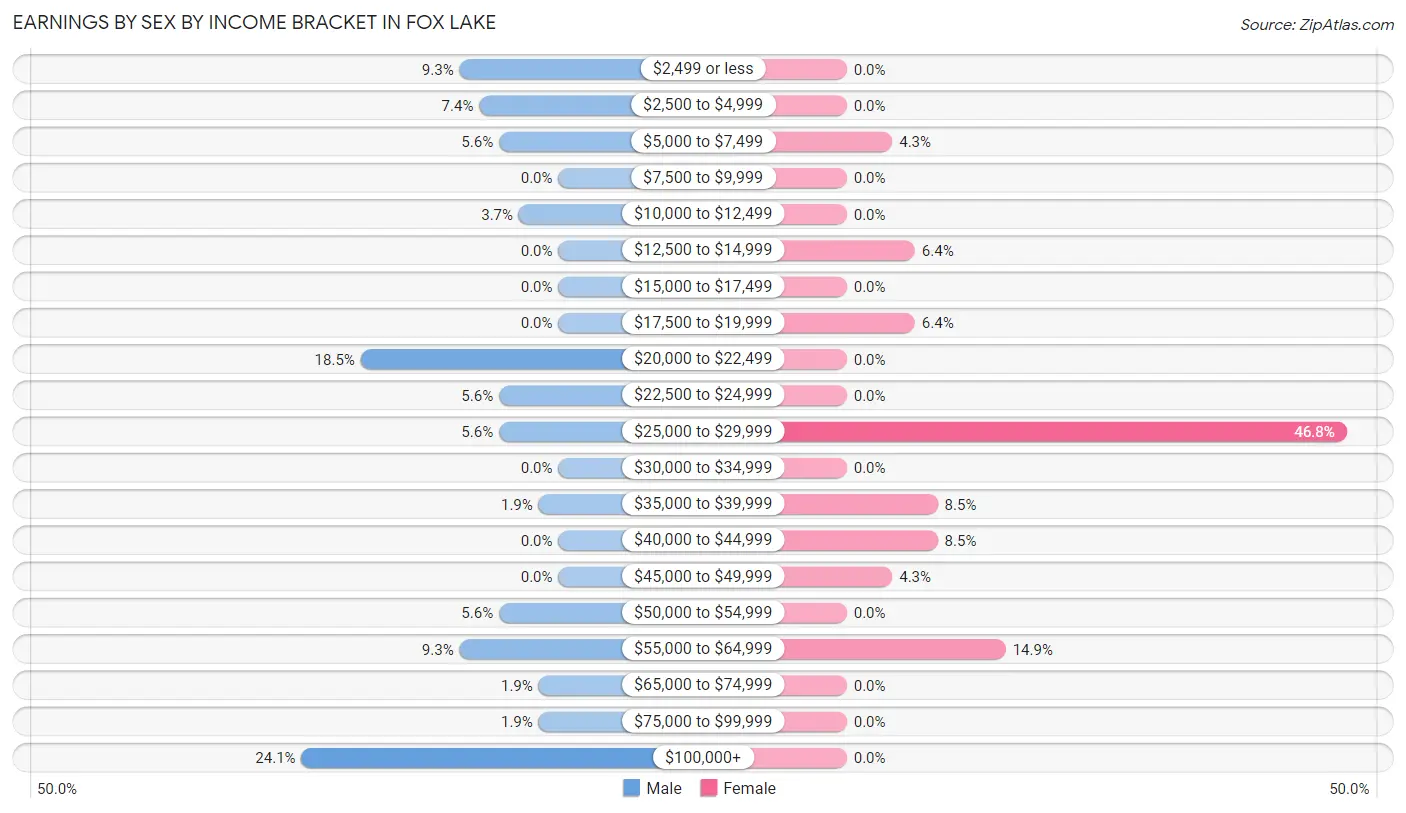
Earnings by Sex by Income Bracket in Fox Lake
The most common earnings brackets in Fox Lake are $100,000+ for men (13 | 24.1%) and $25,000 to $29,999 for women (22 | 46.8%).
| Income | Male | Female |
| $2,499 or less | 5 (9.3%) | 0 (0.0%) |
| $2,500 to $4,999 | 4 (7.4%) | 0 (0.0%) |
| $5,000 to $7,499 | 3 (5.6%) | 2 (4.3%) |
| $7,500 to $9,999 | 0 (0.0%) | 0 (0.0%) |
| $10,000 to $12,499 | 2 (3.7%) | 0 (0.0%) |
| $12,500 to $14,999 | 0 (0.0%) | 3 (6.4%) |
| $15,000 to $17,499 | 0 (0.0%) | 0 (0.0%) |
| $17,500 to $19,999 | 0 (0.0%) | 3 (6.4%) |
| $20,000 to $22,499 | 10 (18.5%) | 0 (0.0%) |
| $22,500 to $24,999 | 3 (5.6%) | 0 (0.0%) |
| $25,000 to $29,999 | 3 (5.6%) | 22 (46.8%) |
| $30,000 to $34,999 | 0 (0.0%) | 0 (0.0%) |
| $35,000 to $39,999 | 1 (1.8%) | 4 (8.5%) |
| $40,000 to $44,999 | 0 (0.0%) | 4 (8.5%) |
| $45,000 to $49,999 | 0 (0.0%) | 2 (4.3%) |
| $50,000 to $54,999 | 3 (5.6%) | 0 (0.0%) |
| $55,000 to $64,999 | 5 (9.3%) | 7 (14.9%) |
| $65,000 to $74,999 | 1 (1.8%) | 0 (0.0%) |
| $75,000 to $99,999 | 1 (1.8%) | 0 (0.0%) |
| $100,000+ | 13 (24.1%) | 0 (0.0%) |
| Total | 54 (100.0%) | 47 (100.0%) |
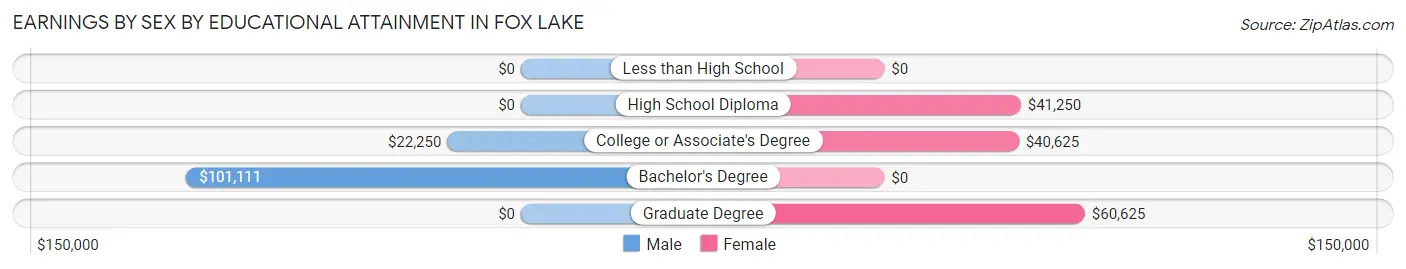
Earnings by Sex by Educational Attainment in Fox Lake
Average earnings in Fox Lake are $51,667 for men and $41,250 for women, a difference of 20.2%. Men with an educational attainment of bachelor's degree enjoy the highest average annual earnings of $101,111, while those with college or associate's degree education earn the least with $22,250. Women with an educational attainment of graduate degree earn the most with the average annual earnings of $60,625, while those with college or associate's degree education have the smallest earnings of $40,625.
| Educational Attainment | Male Income | Female Income |
| Less than High School | - | - |
| High School Diploma | - | - |
| College or Associate's Degree | $22,250 | $40,625 |
| Bachelor's Degree | $101,111 | $0 |
| Graduate Degree | - | - |
| Total | $51,667 | $41,250 |
Family Income in Fox Lake
Family Income Brackets in Fox Lake
According to the Fox Lake family income data, there are 9 families falling into the $50,000 to $74,999 income range, which is the most common income bracket and makes up 30.0% of all families.
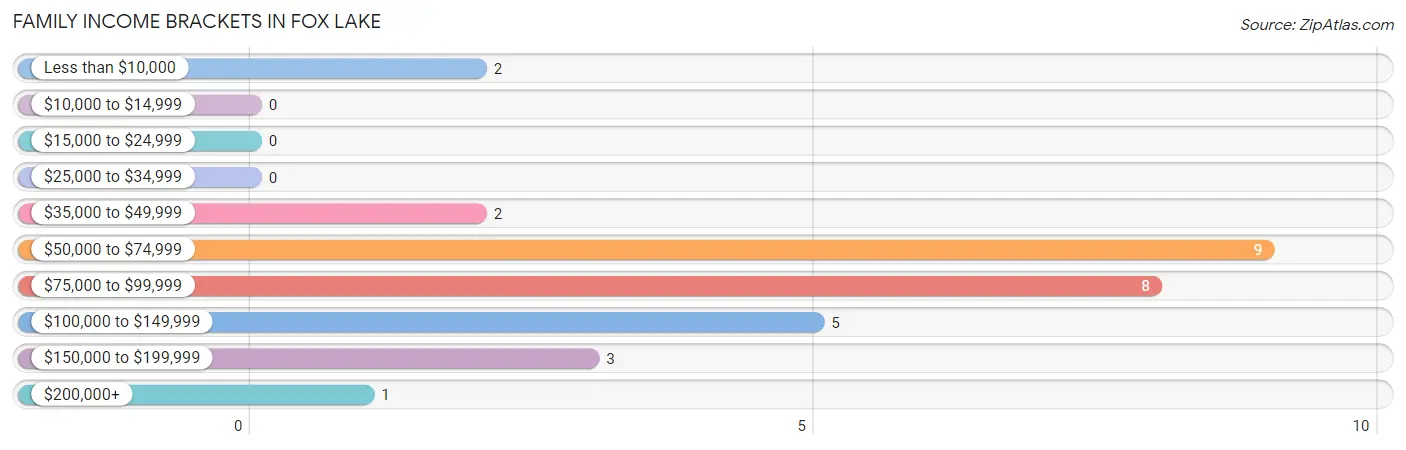
| Income Bracket | # Families | % Families |
| Less than $10,000 | 2 | 6.7% |
| $10,000 to $14,999 | 0 | 0.0% |
| $15,000 to $24,999 | 0 | 0.0% |
| $25,000 to $34,999 | 0 | 0.0% |
| $35,000 to $49,999 | 2 | 6.7% |
| $50,000 to $74,999 | 9 | 30.0% |
| $75,000 to $99,999 | 8 | 26.7% |
| $100,000 to $149,999 | 5 | 16.7% |
| $150,000 to $199,999 | 3 | 10.0% |
| $200,000+ | 1 | 3.3% |
Family Income by Famaliy Size in Fox Lake
4-person families (6 | 20.0%) account for the highest median family income in Fox Lake with $88,750 per family, while 2-person families (14 | 46.7%) have the highest median income of $27,916 per family member.
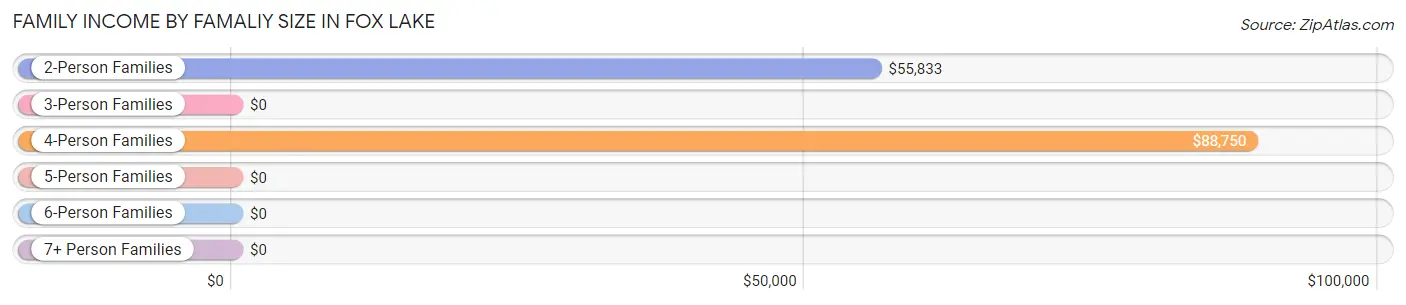
| Income Bracket | # Families | Median Income |
| 2-Person Families | 14 (46.7%) | $55,833 |
| 3-Person Families | 0 (0.0%) | $0 |
| 4-Person Families | 6 (20.0%) | $88,750 |
| 5-Person Families | 6 (20.0%) | $0 |
| 6-Person Families | 4 (13.3%) | $0 |
| 7+ Person Families | 0 (0.0%) | $0 |
| Total | 30 (100.0%) | $81,250 |
Family Income by Number of Earners in Fox Lake
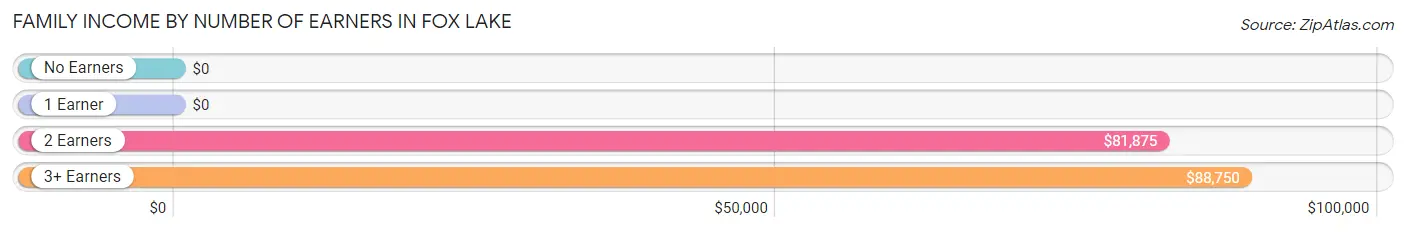
| Number of Earners | # Families | Median Income |
| No Earners | 0 (0.0%) | $0 |
| 1 Earner | 12 (40.0%) | $0 |
| 2 Earners | 12 (40.0%) | $81,875 |
| 3+ Earners | 6 (20.0%) | $88,750 |
| Total | 30 (100.0%) | $81,250 |
Household Income in Fox Lake
Household Income Brackets in Fox Lake
With 27 households falling in the category, the $100,000 to $149,999 income range is the most frequent in Fox Lake, accounting for 45.8% of all households.
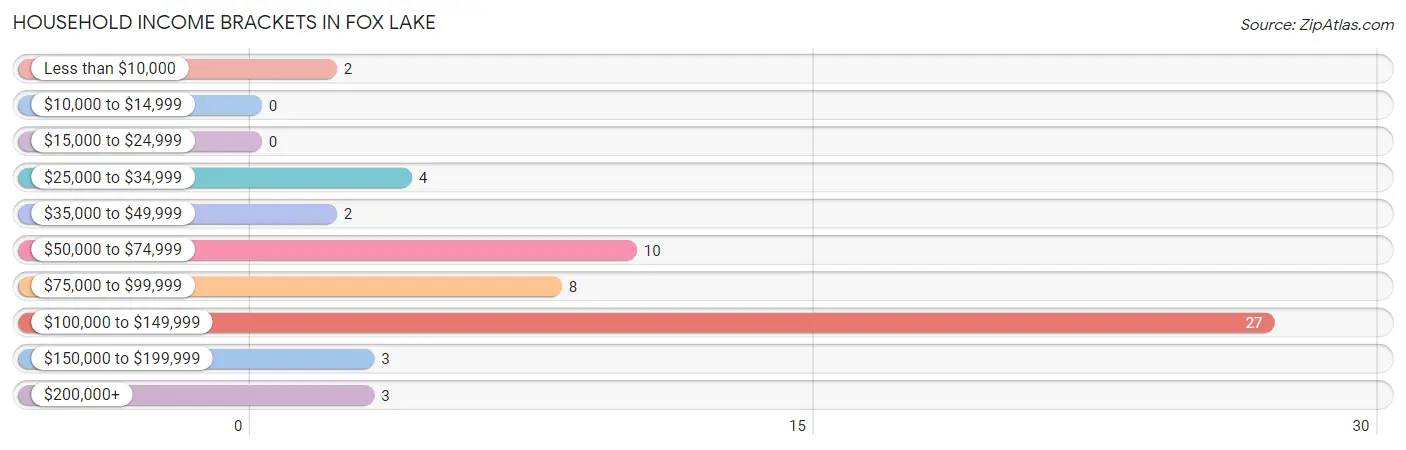
| Income Bracket | # Households | % Households |
| Less than $10,000 | 2 | 3.4% |
| $10,000 to $14,999 | 0 | 0.0% |
| $15,000 to $24,999 | 0 | 0.0% |
| $25,000 to $34,999 | 4 | 6.8% |
| $35,000 to $49,999 | 2 | 3.4% |
| $50,000 to $74,999 | 10 | 16.9% |
| $75,000 to $99,999 | 8 | 13.6% |
| $100,000 to $149,999 | 27 | 45.8% |
| $150,000 to $199,999 | 3 | 5.1% |
| $200,000+ | 3 | 5.1% |
Household Income by Householder Age in Fox Lake
The median household income in Fox Lake is $127,557, with the highest median household income of $90,000 found in the 25 to 44 years age bracket for the primary householder. A total of 14 households (23.7%) fall into this category. Meanwhile, the 15 to 24 years age bracket for the primary householder has the lowest median household income of $0, with 22 households (37.3%) in this group.
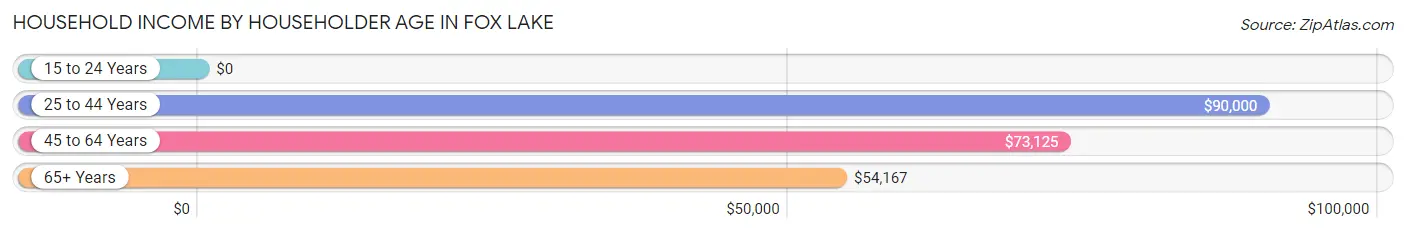
| Income Bracket | # Households | Median Income |
| 15 to 24 Years | 22 (37.3%) | $0 |
| 25 to 44 Years | 14 (23.7%) | $90,000 |
| 45 to 64 Years | 15 (25.4%) | $73,125 |
| 65+ Years | 8 (13.6%) | $54,167 |
| Total | 59 (100.0%) | $127,557 |
Poverty in Fox Lake
Income Below Poverty by Sex and Age in Fox Lake
With 2.4% poverty level for males and 4.5% for females among the residents of Fox Lake, 65 to 74 year old males and 55 to 64 year old females are the most vulnerable to poverty, with 2 males (33.3%) and 2 females (33.3%) in their respective age groups living below the poverty level.
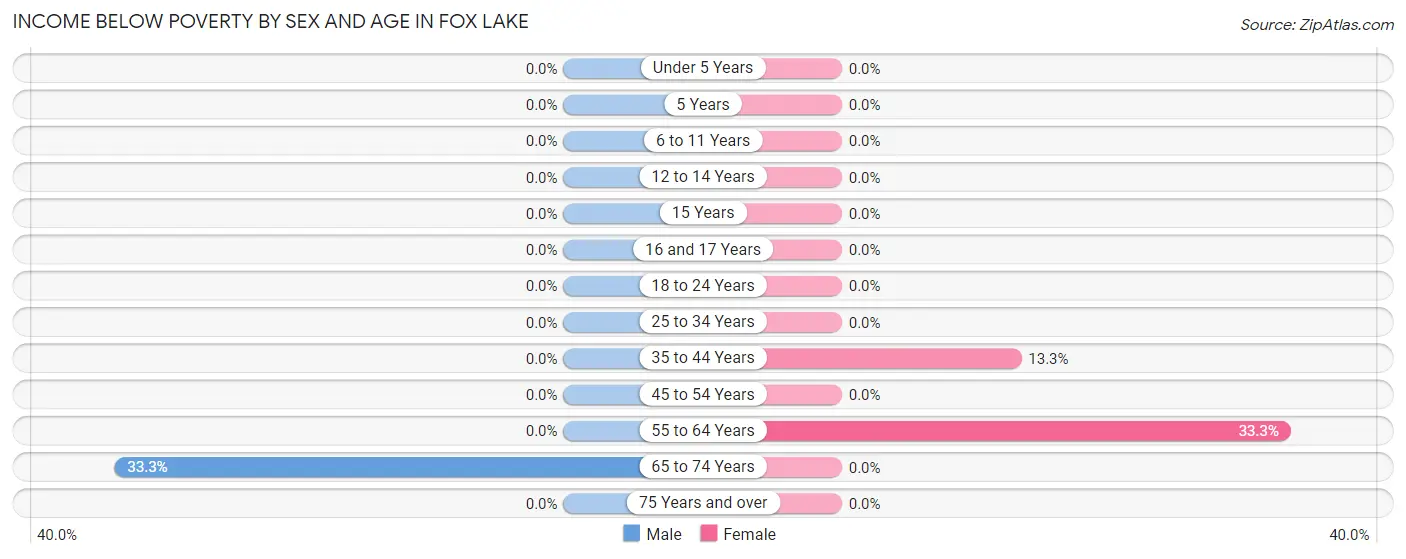
| Age Bracket | Male | Female |
| Under 5 Years | 0 (0.0%) | 0 (0.0%) |
| 5 Years | 0 (0.0%) | 0 (0.0%) |
| 6 to 11 Years | 0 (0.0%) | 0 (0.0%) |
| 12 to 14 Years | 0 (0.0%) | 0 (0.0%) |
| 15 Years | 0 (0.0%) | 0 (0.0%) |
| 16 and 17 Years | 0 (0.0%) | 0 (0.0%) |
| 18 to 24 Years | 0 (0.0%) | 0 (0.0%) |
| 25 to 34 Years | 0 (0.0%) | 0 (0.0%) |
| 35 to 44 Years | 0 (0.0%) | 2 (13.3%) |
| 45 to 54 Years | 0 (0.0%) | 0 (0.0%) |
| 55 to 64 Years | 0 (0.0%) | 2 (33.3%) |
| 65 to 74 Years | 2 (33.3%) | 0 (0.0%) |
| 75 Years and over | 0 (0.0%) | 0 (0.0%) |
| Total | 2 (2.4%) | 4 (4.5%) |
Income Above Poverty by Sex and Age in Fox Lake
According to the poverty statistics in Fox Lake, males aged under 5 years and females aged under 5 years are the age groups that are most secure financially, with 100.0% of males and 100.0% of females in these age groups living above the poverty line.
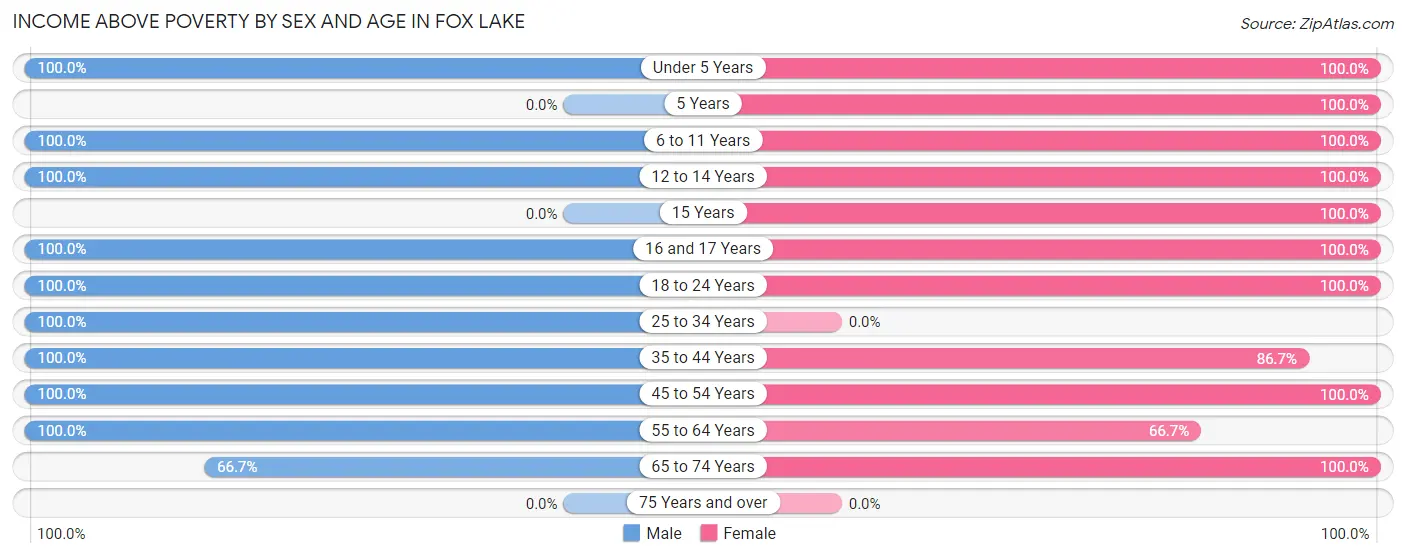
| Age Bracket | Male | Female |
| Under 5 Years | 12 (100.0%) | 7 (100.0%) |
| 5 Years | 0 (0.0%) | 3 (100.0%) |
| 6 to 11 Years | 11 (100.0%) | 6 (100.0%) |
| 12 to 14 Years | 3 (100.0%) | 9 (100.0%) |
| 15 Years | 0 (0.0%) | 4 (100.0%) |
| 16 and 17 Years | 6 (100.0%) | 2 (100.0%) |
| 18 to 24 Years | 9 (100.0%) | 25 (100.0%) |
| 25 to 34 Years | 9 (100.0%) | 0 (0.0%) |
| 35 to 44 Years | 12 (100.0%) | 13 (86.7%) |
| 45 to 54 Years | 10 (100.0%) | 6 (100.0%) |
| 55 to 64 Years | 7 (100.0%) | 4 (66.7%) |
| 65 to 74 Years | 4 (66.7%) | 6 (100.0%) |
| 75 Years and over | 0 (0.0%) | 0 (0.0%) |
| Total | 83 (97.7%) | 85 (95.5%) |
Income Below Poverty Among Married-Couple Families in Fox Lake
The poverty statistics for married-couple families in Fox Lake show that 7.7% or 2 of the total 26 families live below the poverty line. Families with no children have the highest poverty rate of 20.0%, comprising of 2 families. On the other hand, families with 1 or 2 children have the lowest poverty rate of 0.0%, which includes 0 families.
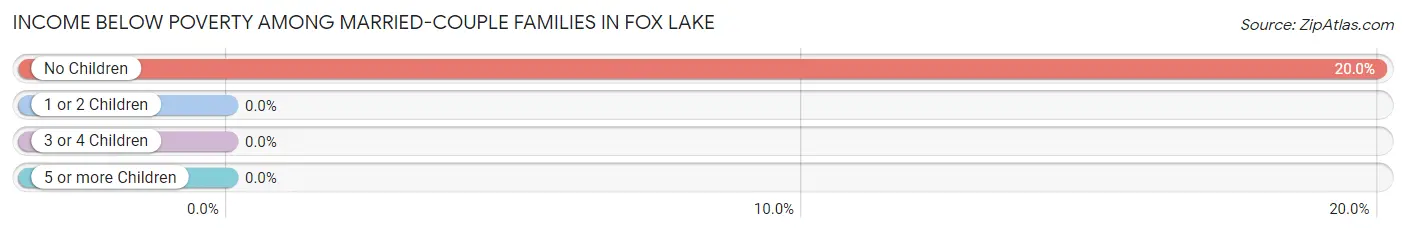
| Children | Above Poverty | Below Poverty |
| No Children | 8 (80.0%) | 2 (20.0%) |
| 1 or 2 Children | 6 (100.0%) | 0 (0.0%) |
| 3 or 4 Children | 10 (100.0%) | 0 (0.0%) |
| 5 or more Children | 0 (0.0%) | 0 (0.0%) |
| Total | 24 (92.3%) | 2 (7.7%) |
Income Below Poverty Among Single-Parent Households in Fox Lake
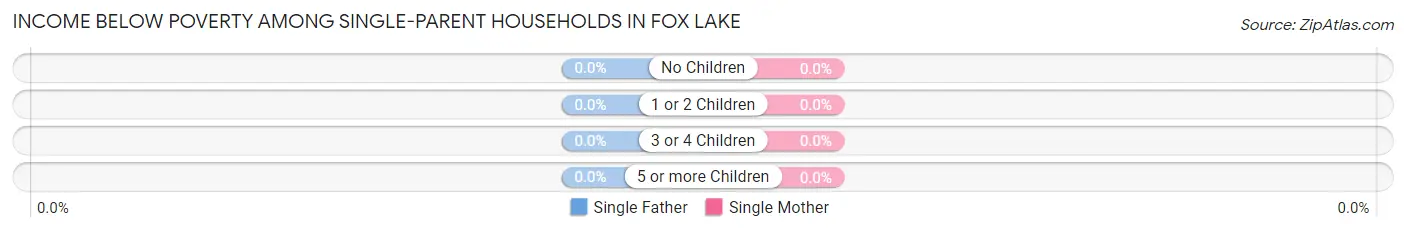
| Children | Single Father | Single Mother |
| No Children | 0 (0.0%) | 0 (0.0%) |
| 1 or 2 Children | 0 (0.0%) | 0 (0.0%) |
| 3 or 4 Children | 0 (0.0%) | 0 (0.0%) |
| 5 or more Children | 0 (0.0%) | 0 (0.0%) |
| Total | 0 (0.0%) | 0 (0.0%) |
Income Below Poverty Among Married-Couple vs Single-Parent Households in Fox Lake
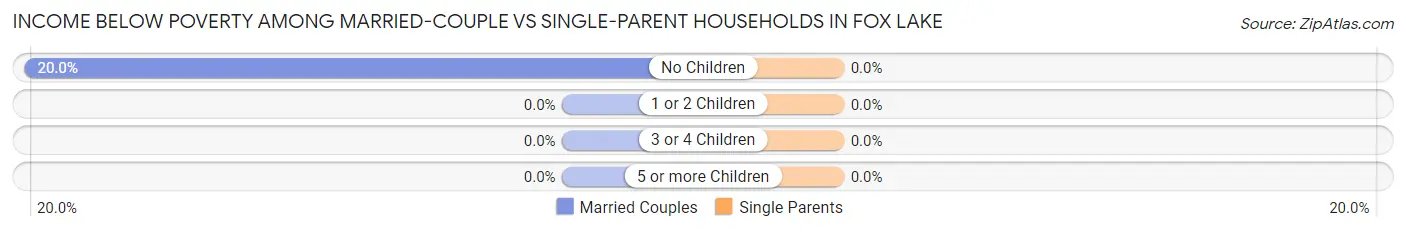
| Children | Married-Couple Families | Single-Parent Households |
| No Children | 2 (20.0%) | 0 (0.0%) |
| 1 or 2 Children | 0 (0.0%) | 0 (0.0%) |
| 3 or 4 Children | 0 (0.0%) | 0 (0.0%) |
| 5 or more Children | 0 (0.0%) | 0 (0.0%) |
| Total | 2 (7.7%) | 0 (0.0%) |
Race in Fox Lake
The most populous races in Fox Lake are White / Caucasian (152 | 87.4%), Two or more Races (13 | 7.5%), and Some other Race (8 | 4.6%).
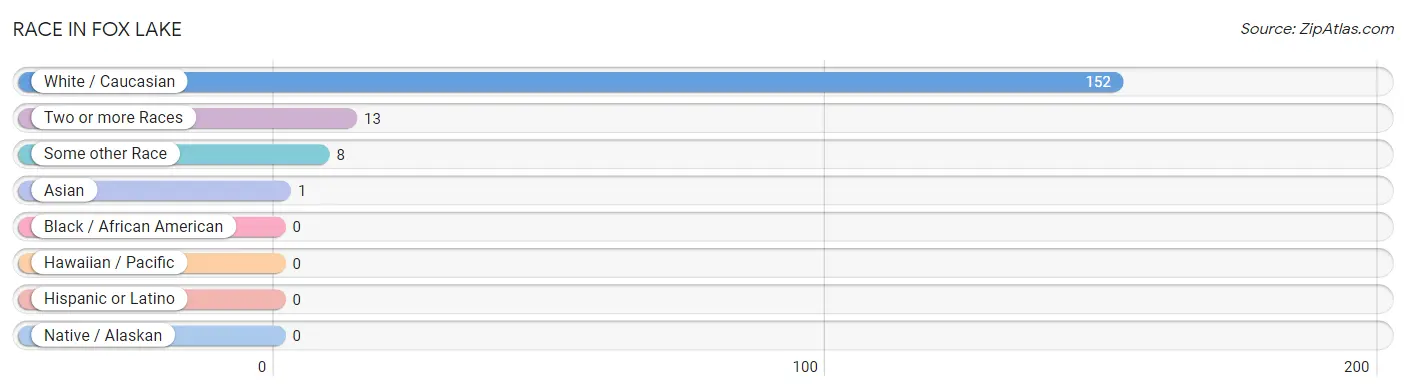
| Race | # Population | % Population |
| Asian | 1 | 0.6% |
| Black / African American | 0 | 0.0% |
| Hawaiian / Pacific | 0 | 0.0% |
| Hispanic or Latino | 0 | 0.0% |
| Native / Alaskan | 0 | 0.0% |
| White / Caucasian | 152 | 87.4% |
| Two or more Races | 13 | 7.5% |
| Some other Race | 8 | 4.6% |
| Total | 174 | 100.0% |
Ancestry in Fox Lake
The most populous ancestries reported in Fox Lake are German (49 | 28.2%), American (25 | 14.4%), Irish (15 | 8.6%), European (14 | 8.1%), and Norwegian (5 | 2.9%), together accounting for 62.1% of all Fox Lake residents.
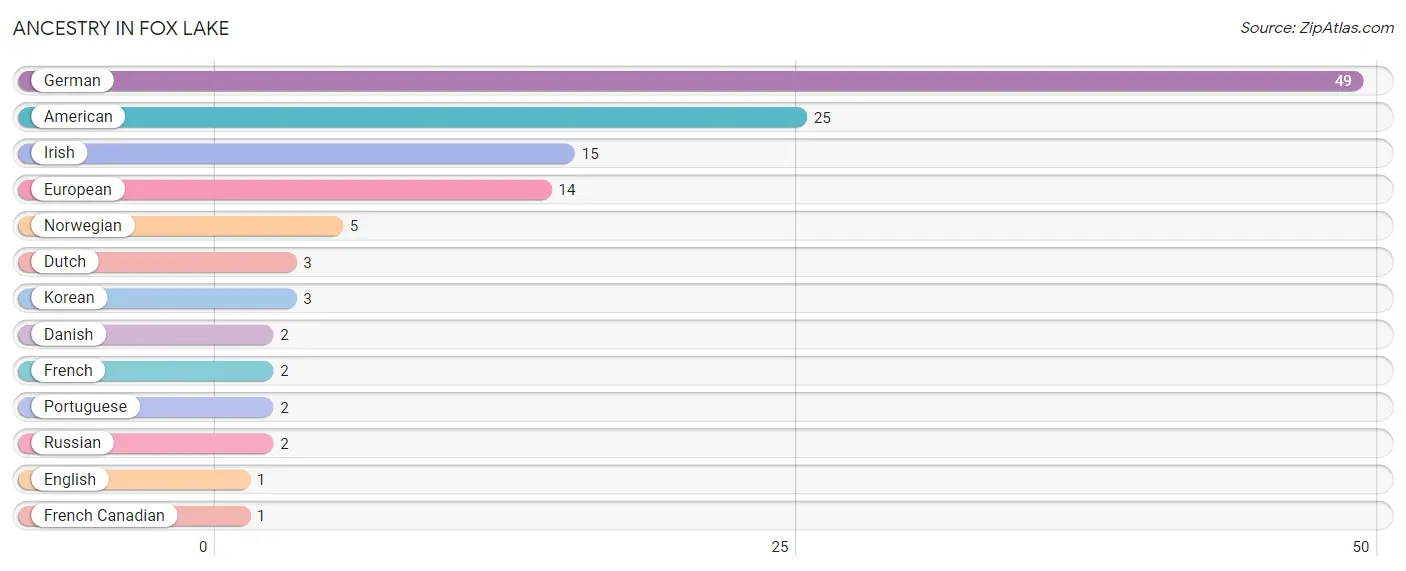
| Ancestry | # Population | % Population |
| American | 25 | 14.4% |
| Danish | 2 | 1.1% |
| Dutch | 3 | 1.7% |
| English | 1 | 0.6% |
| European | 14 | 8.1% |
| French | 2 | 1.1% |
| French Canadian | 1 | 0.6% |
| German | 49 | 28.2% |
| Irish | 15 | 8.6% |
| Korean | 3 | 1.7% |
| Norwegian | 5 | 2.9% |
| Portuguese | 2 | 1.1% |
| Russian | 2 | 1.1% | View All 13 Rows |
Immigrants in Fox Lake
The most numerous immigrant groups reported in Fox Lake came from Asia (1 | 0.6%), Philippines (1 | 0.6%), and South Eastern Asia (1 | 0.6%), together accounting for 1.7% of all Fox Lake residents.
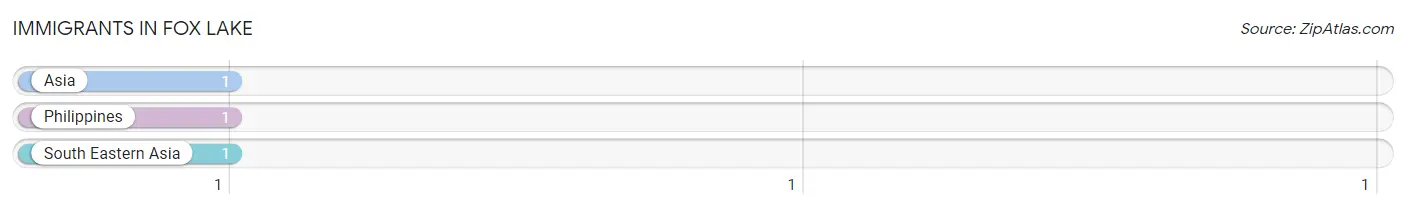
| Immigration Origin | # Population | % Population |
| Asia | 1 | 0.6% |
| Philippines | 1 | 0.6% |
| South Eastern Asia | 1 | 0.6% | View All 3 Rows |
Sex and Age in Fox Lake
Sex and Age in Fox Lake
The most populous age groups in Fox Lake are Under 5 Years (12 | 14.1%) for men and 20 to 24 Years (22 | 24.7%) for women.
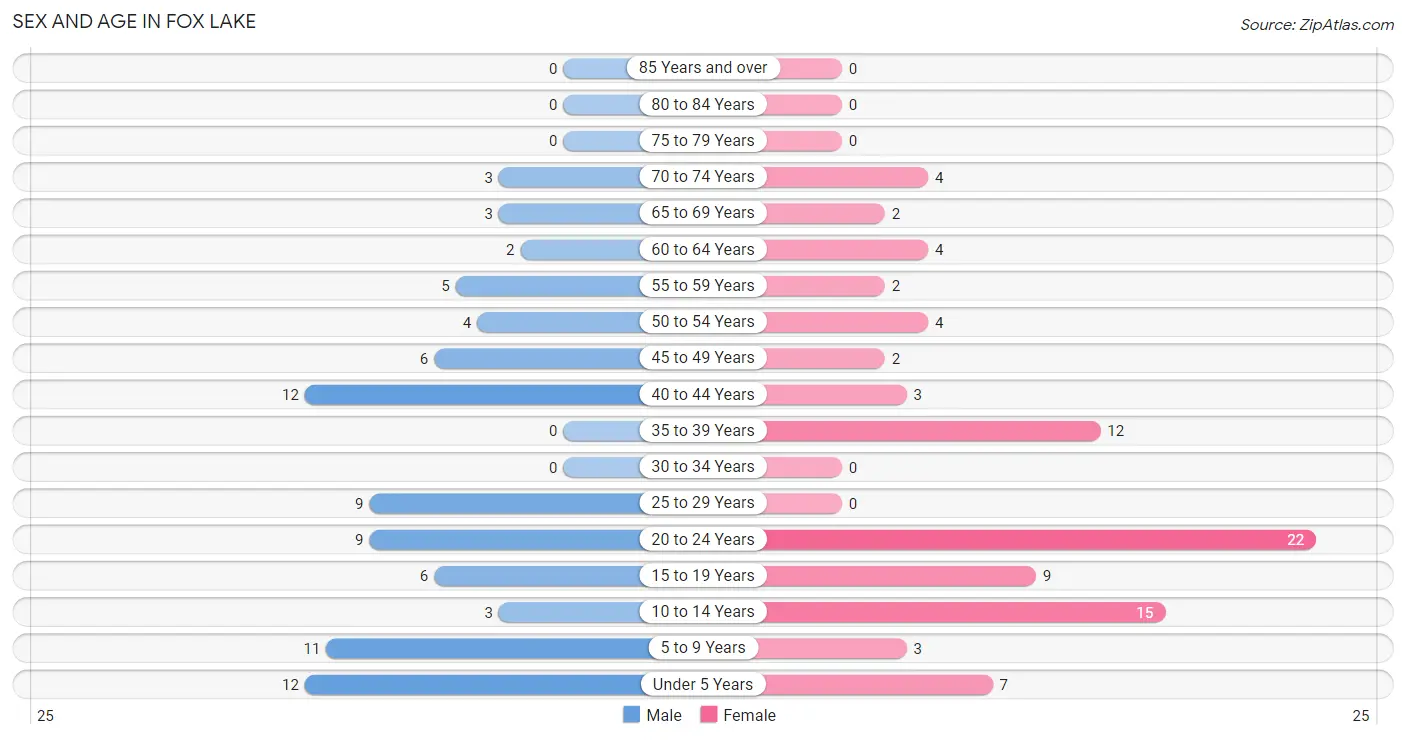
| Age Bracket | Male | Female |
| Under 5 Years | 12 (14.1%) | 7 (7.9%) |
| 5 to 9 Years | 11 (12.9%) | 3 (3.4%) |
| 10 to 14 Years | 3 (3.5%) | 15 (16.9%) |
| 15 to 19 Years | 6 (7.1%) | 9 (10.1%) |
| 20 to 24 Years | 9 (10.6%) | 22 (24.7%) |
| 25 to 29 Years | 9 (10.6%) | 0 (0.0%) |
| 30 to 34 Years | 0 (0.0%) | 0 (0.0%) |
| 35 to 39 Years | 0 (0.0%) | 12 (13.5%) |
| 40 to 44 Years | 12 (14.1%) | 3 (3.4%) |
| 45 to 49 Years | 6 (7.1%) | 2 (2.2%) |
| 50 to 54 Years | 4 (4.7%) | 4 (4.5%) |
| 55 to 59 Years | 5 (5.9%) | 2 (2.2%) |
| 60 to 64 Years | 2 (2.4%) | 4 (4.5%) |
| 65 to 69 Years | 3 (3.5%) | 2 (2.2%) |
| 70 to 74 Years | 3 (3.5%) | 4 (4.5%) |
| 75 to 79 Years | 0 (0.0%) | 0 (0.0%) |
| 80 to 84 Years | 0 (0.0%) | 0 (0.0%) |
| 85 Years and over | 0 (0.0%) | 0 (0.0%) |
| Total | 85 (100.0%) | 89 (100.0%) |
Families and Households in Fox Lake
Median Family Size in Fox Lake
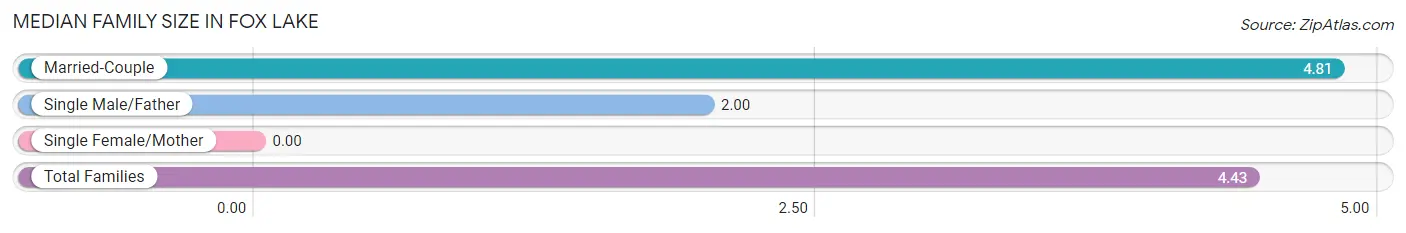
| Family Type | # Families | Family Size |
| Married-Couple | 26 (86.7%) | 4.81 |
| Single Male/Father | 4 (13.3%) | 2.00 |
| Single Female/Mother | 0 (0.0%) | - |
| Total Families | 30 (100.0%) | 4.43 |
Median Household Size in Fox Lake
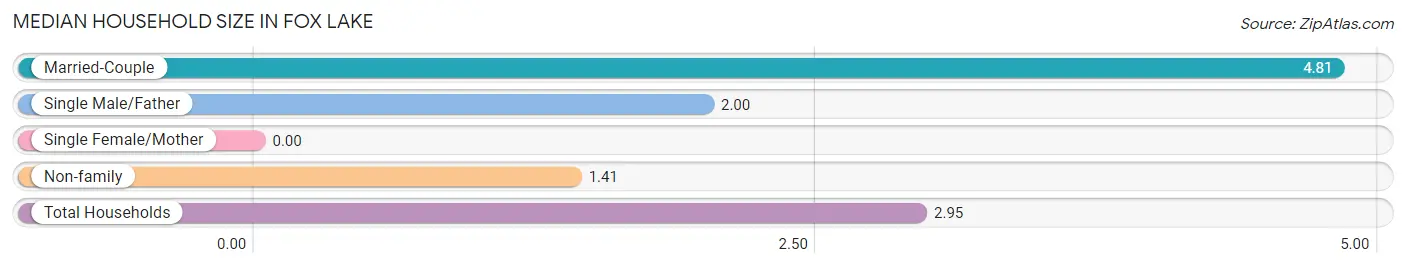
| Household Type | # Households | Household Size |
| Married-Couple | 26 (44.1%) | 4.81 |
| Single Male/Father | 4 (6.8%) | 2.00 |
| Single Female/Mother | 0 (0.0%) | - |
| Non-family | 29 (49.1%) | 1.41 |
| Total Households | 59 (100.0%) | 2.95 |
Household Size by Marriage Status in Fox Lake
Out of a total of 59 households in Fox Lake, 30 (50.8%) are family households, while 29 (49.1%) are nonfamily households. The most numerous type of family households are 2-person households, comprising 14, and the most common type of nonfamily households are 2-person households, comprising 24.
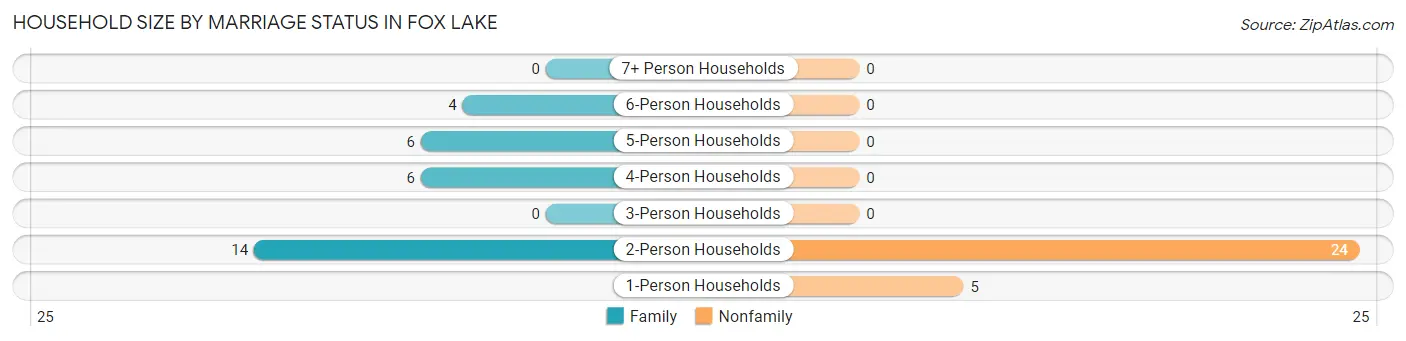
| Household Size | Family Households | Nonfamily Households |
| 1-Person Households | - | 5 (8.5%) |
| 2-Person Households | 14 (23.7%) | 24 (40.7%) |
| 3-Person Households | 0 (0.0%) | 0 (0.0%) |
| 4-Person Households | 6 (10.2%) | 0 (0.0%) |
| 5-Person Households | 6 (10.2%) | 0 (0.0%) |
| 6-Person Households | 4 (6.8%) | 0 (0.0%) |
| 7+ Person Households | 0 (0.0%) | 0 (0.0%) |
| Total | 30 (50.8%) | 29 (49.1%) |
Female Fertility in Fox Lake
Fertility by Age in Fox Lake
Average fertility rate in Fox Lake is 42.0 births per 1,000 women. Women in the age bracket of 35 to 50 years have the highest fertility rate with 118.0 births per 1,000 women. Women in the age bracket of 35 to 50 years acount for 100.0% of all women with births.
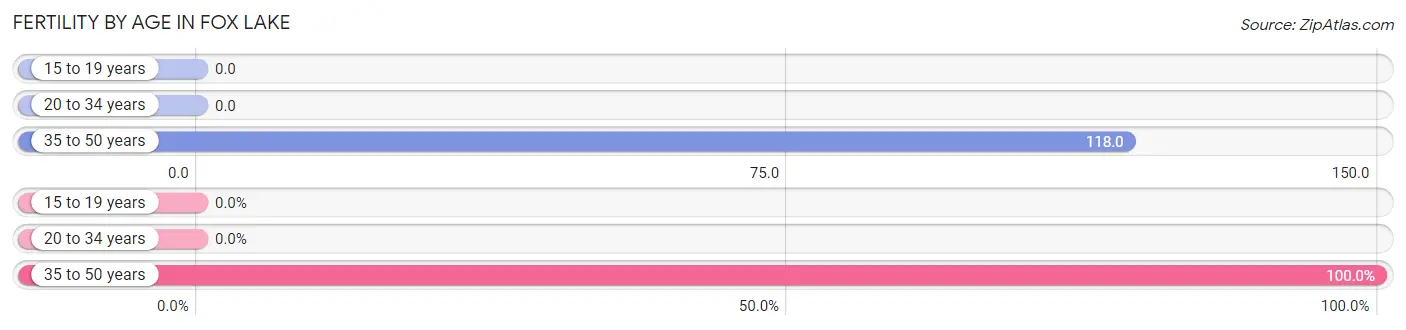
| Age Bracket | Women with Births | Births / 1,000 Women |
| 15 to 19 years | 0 (0.0%) | 0.0 |
| 20 to 34 years | 0 (0.0%) | 0.0 |
| 35 to 50 years | 2 (100.0%) | 118.0 |
| Total | 2 (100.0%) | 42.0 |
Fertility by Age by Marriage Status in Fox Lake
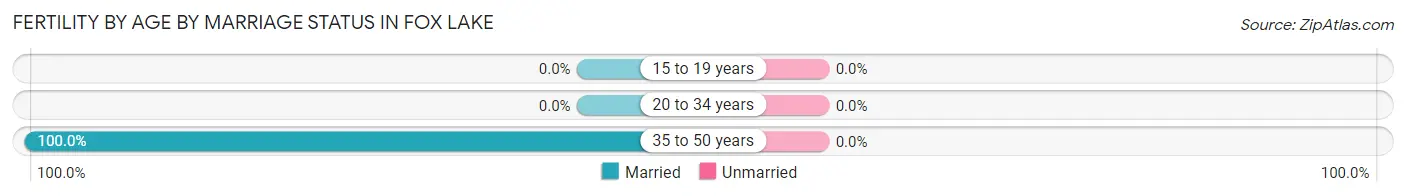
| Age Bracket | Married | Unmarried |
| 15 to 19 years | 0 (0.0%) | 0 (0.0%) |
| 20 to 34 years | 0 (0.0%) | 0 (0.0%) |
| 35 to 50 years | 2 (100.0%) | 0 (0.0%) |
| Total | 2 (100.0%) | 0 (0.0%) |
Fertility by Education in Fox Lake
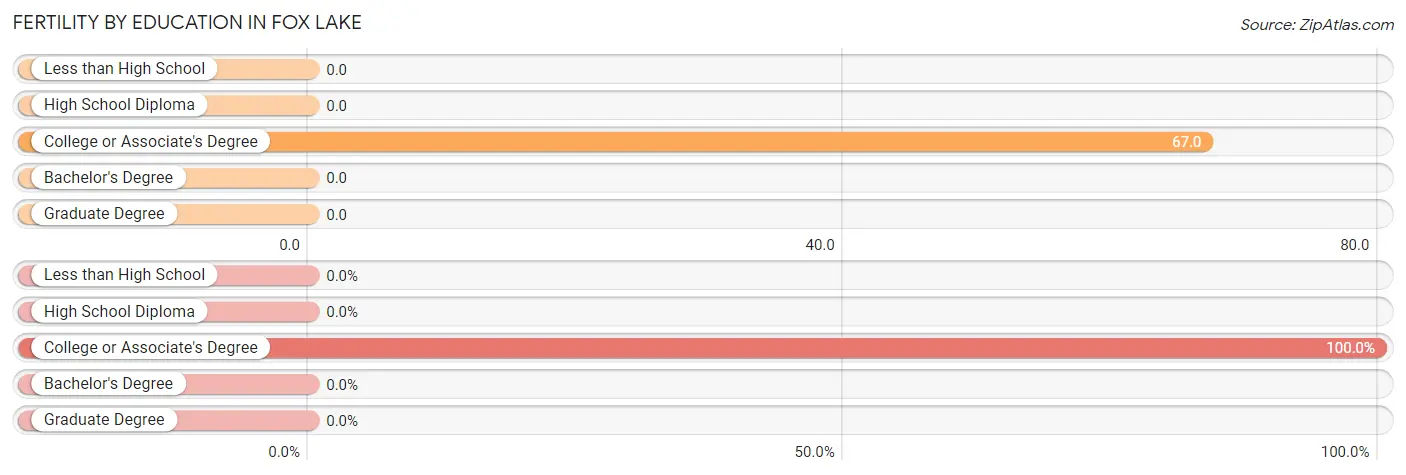
| Educational Attainment | Women with Births | Births / 1,000 Women |
| Less than High School | 0 (0.0%) | 0.0 |
| High School Diploma | 0 (0.0%) | 0.0 |
| College or Associate's Degree | 2 (100.0%) | 67.0 |
| Bachelor's Degree | 0 (0.0%) | 0.0 |
| Graduate Degree | 0 (0.0%) | 0.0 |
| Total | 2 (100.0%) | 42.0 |
Fertility by Education by Marriage Status in Fox Lake
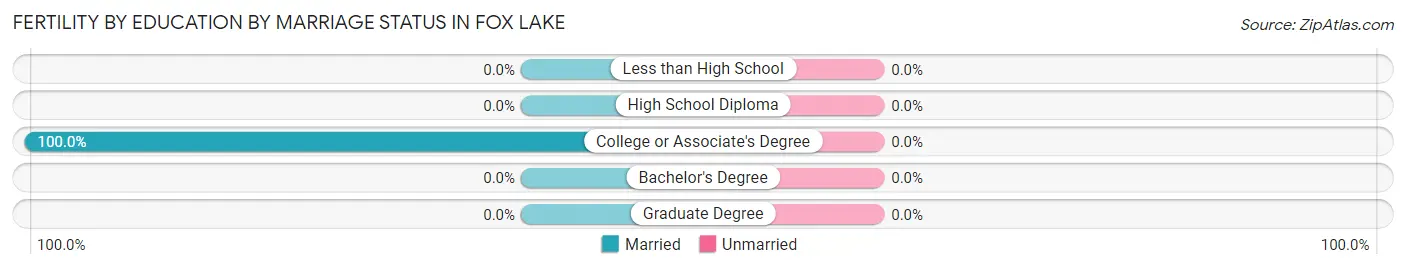
| Educational Attainment | Married | Unmarried |
| Less than High School | 0 (0.0%) | 0 (0.0%) |
| High School Diploma | 0 (0.0%) | 0 (0.0%) |
| College or Associate's Degree | 2 (100.0%) | 0 (0.0%) |
| Bachelor's Degree | 0 (0.0%) | 0 (0.0%) |
| Graduate Degree | 0 (0.0%) | 0 (0.0%) |
| Total | 2 (100.0%) | 0 (0.0%) |
Employment Characteristics in Fox Lake
Employment by Class of Employer in Fox Lake
Among the 96 employed individuals in Fox Lake, private company employees (57 | 59.4%), local government employees (16 | 16.7%), and self-employed (not incorporated) (13 | 13.5%) make up the most common classes of employment.
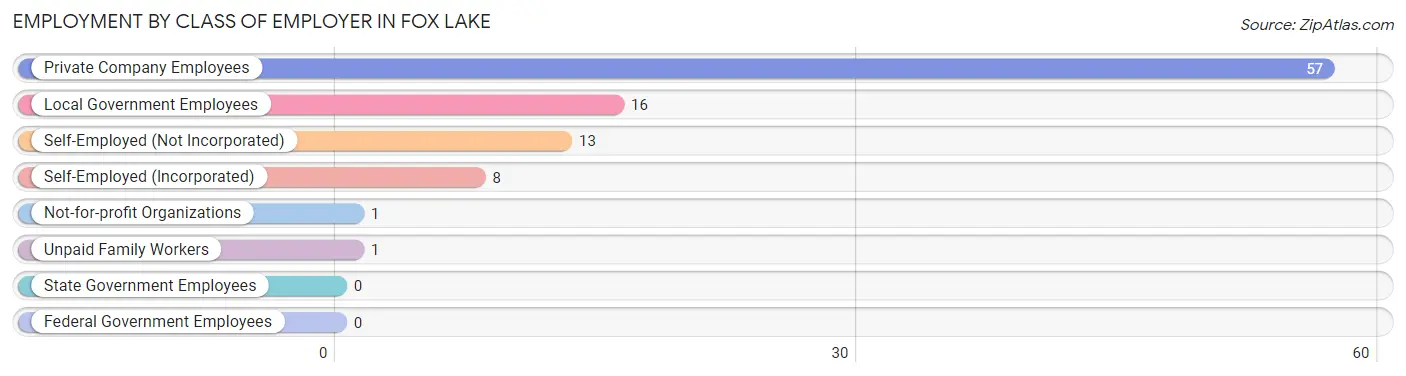
| Employer Class | # Employees | % Employees |
| Private Company Employees | 57 | 59.4% |
| Self-Employed (Incorporated) | 8 | 8.3% |
| Self-Employed (Not Incorporated) | 13 | 13.5% |
| Not-for-profit Organizations | 1 | 1.0% |
| Local Government Employees | 16 | 16.7% |
| State Government Employees | 0 | 0.0% |
| Federal Government Employees | 0 | 0.0% |
| Unpaid Family Workers | 1 | 1.0% |
| Total | 96 | 100.0% |
Employment Status by Age in Fox Lake
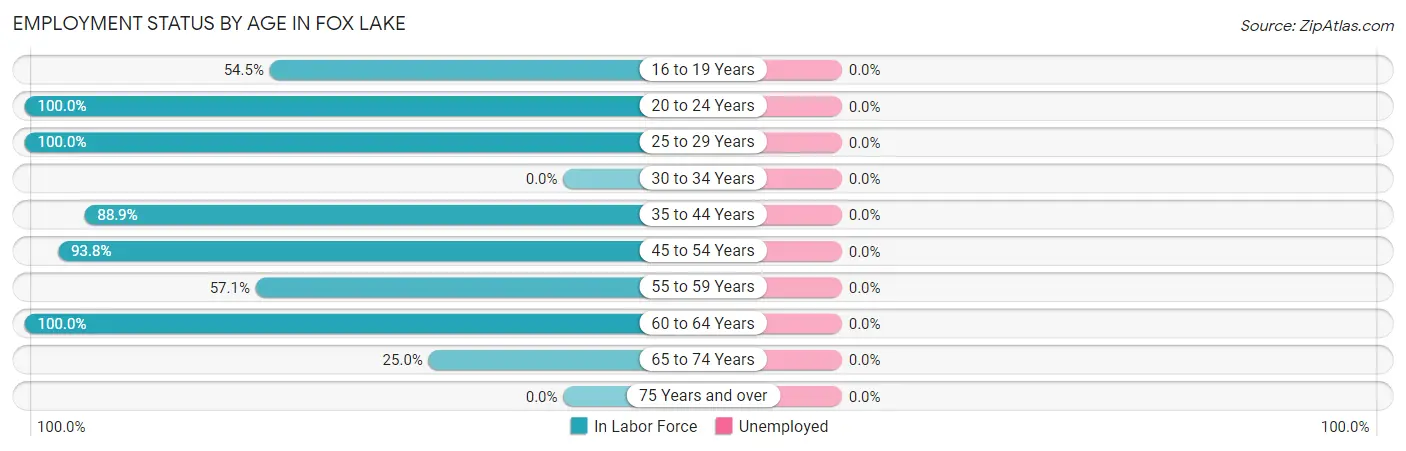
| Age Bracket | In Labor Force | Unemployed |
| 16 to 19 Years | 6 (54.5%) | 0 (0.0%) |
| 20 to 24 Years | 31 (100.0%) | 0 (0.0%) |
| 25 to 29 Years | 9 (100.0%) | 0 (0.0%) |
| 30 to 34 Years | 0 (0.0%) | 0 (0.0%) |
| 35 to 44 Years | 24 (88.9%) | 0 (0.0%) |
| 45 to 54 Years | 15 (93.8%) | 0 (0.0%) |
| 55 to 59 Years | 4 (57.1%) | 0 (0.0%) |
| 60 to 64 Years | 6 (100.0%) | 0 (0.0%) |
| 65 to 74 Years | 3 (25.0%) | 0 (0.0%) |
| 75 Years and over | 0 (0.0%) | 0 (0.0%) |
| Total | 98 (82.4%) | 0 (0.0%) |
Employment Status by Educational Attainment in Fox Lake
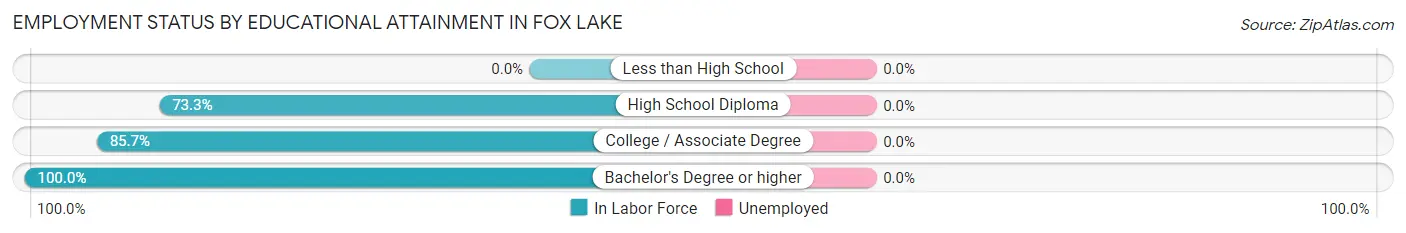
| Educational Attainment | In Labor Force | Unemployed |
| Less than High School | 0 (0.0%) | 0 (0.0%) |
| High School Diploma | 11 (73.3%) | 0 (0.0%) |
| College / Associate Degree | 18 (85.7%) | 0 (0.0%) |
| Bachelor's Degree or higher | 29 (100.0%) | 0 (0.0%) |
| Total | 58 (89.2%) | 0 (0.0%) |
Employment Occupations by Sex in Fox Lake
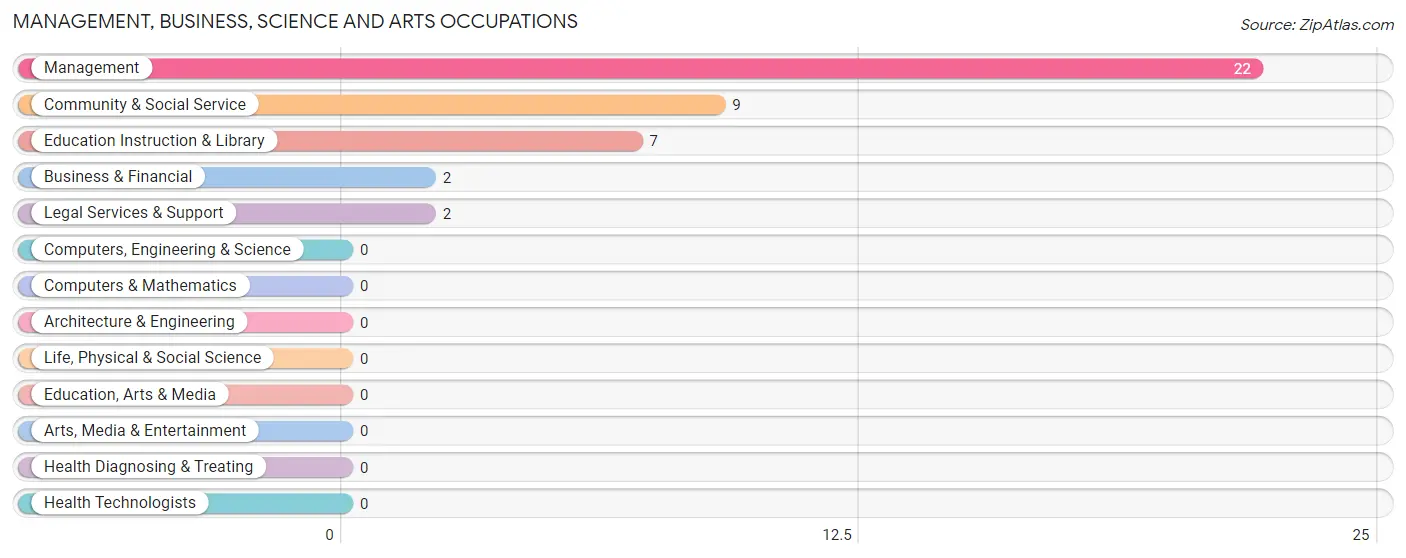
Management, Business, Science and Arts Occupations
The most common Management, Business, Science and Arts occupations in Fox Lake are Management (22 | 22.5%), Community & Social Service (9 | 9.2%), Education Instruction & Library (7 | 7.1%), Business & Financial (2 | 2.0%), and Legal Services & Support (2 | 2.0%).
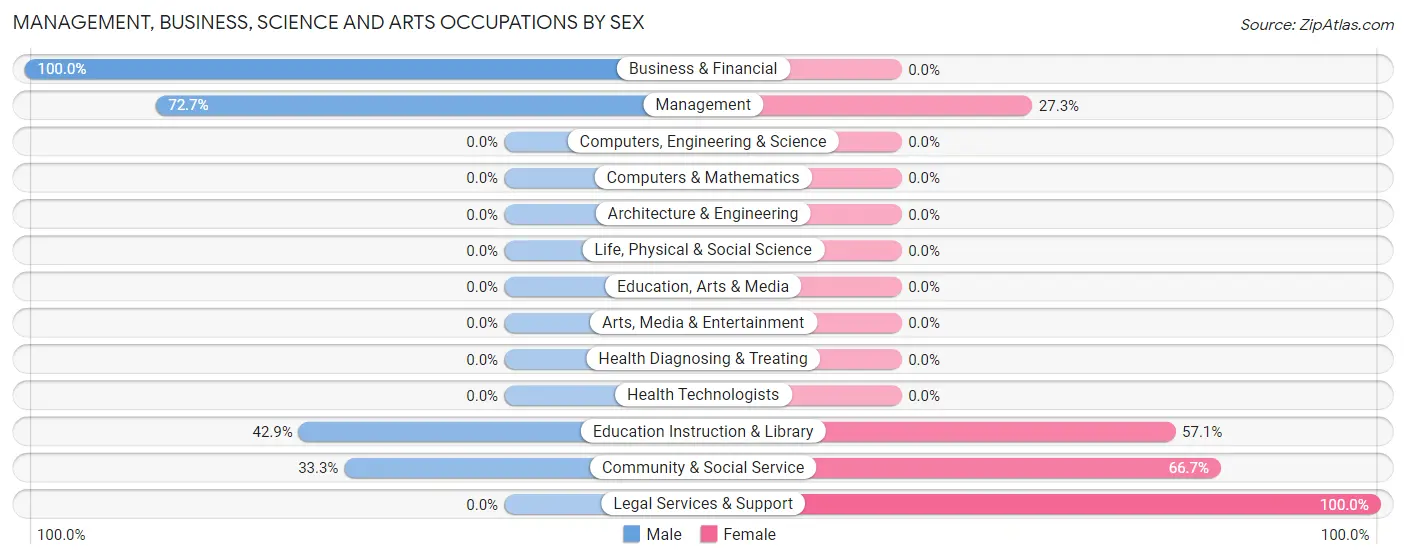
Management, Business, Science and Arts Occupations by Sex
Within the Management, Business, Science and Arts occupations in Fox Lake, the most male-oriented occupations are Business & Financial (100.0%), Management (72.7%), and Education Instruction & Library (42.9%), while the most female-oriented occupations are Legal Services & Support (100.0%), Community & Social Service (66.7%), and Education Instruction & Library (57.1%).
| Occupation | Male | Female |
| Management | 16 (72.7%) | 6 (27.3%) |
| Business & Financial | 2 (100.0%) | 0 (0.0%) |
| Computers, Engineering & Science | 0 (0.0%) | 0 (0.0%) |
| Computers & Mathematics | 0 (0.0%) | 0 (0.0%) |
| Architecture & Engineering | 0 (0.0%) | 0 (0.0%) |
| Life, Physical & Social Science | 0 (0.0%) | 0 (0.0%) |
| Community & Social Service | 3 (33.3%) | 6 (66.7%) |
| Education, Arts & Media | 0 (0.0%) | 0 (0.0%) |
| Legal Services & Support | 0 (0.0%) | 2 (100.0%) |
| Education Instruction & Library | 3 (42.9%) | 4 (57.1%) |
| Arts, Media & Entertainment | 0 (0.0%) | 0 (0.0%) |
| Health Diagnosing & Treating | 0 (0.0%) | 0 (0.0%) |
| Health Technologists | 0 (0.0%) | 0 (0.0%) |
| Total (Category) | 21 (63.6%) | 12 (36.4%) |
| Total (Overall) | 51 (52.0%) | 47 (48.0%) |
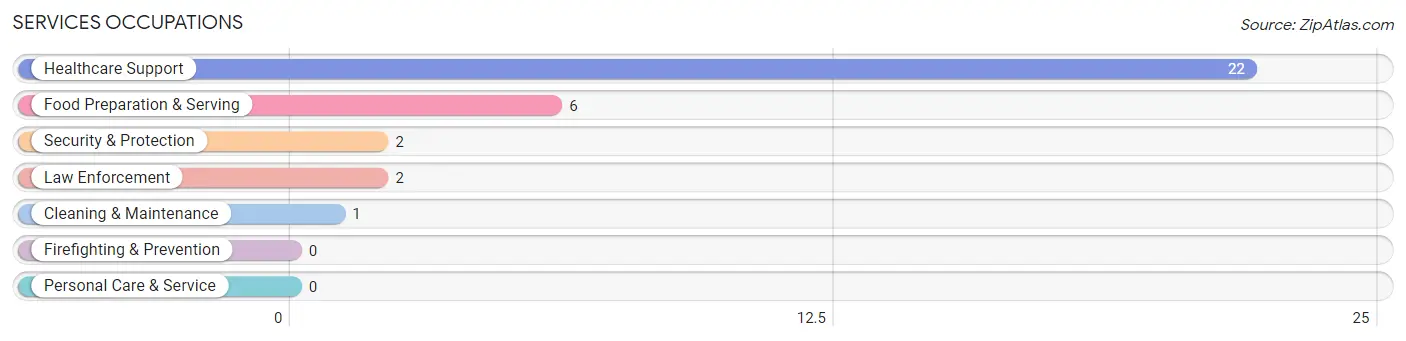
Services Occupations
The most common Services occupations in Fox Lake are Healthcare Support (22 | 22.5%), Food Preparation & Serving (6 | 6.1%), Security & Protection (2 | 2.0%), Law Enforcement (2 | 2.0%), and Cleaning & Maintenance (1 | 1.0%).
Services Occupations by Sex
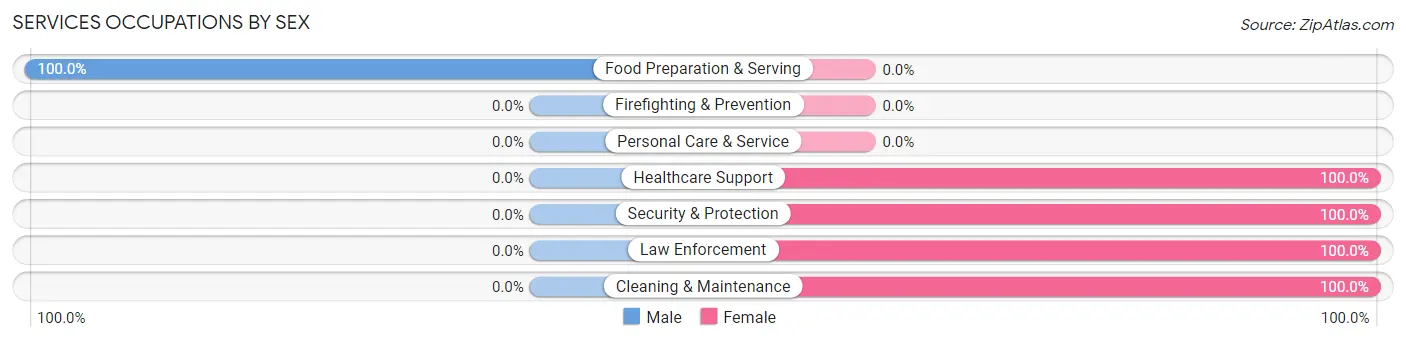
| Occupation | Male | Female |
| Healthcare Support | 0 (0.0%) | 22 (100.0%) |
| Security & Protection | 0 (0.0%) | 2 (100.0%) |
| Firefighting & Prevention | 0 (0.0%) | 0 (0.0%) |
| Law Enforcement | 0 (0.0%) | 2 (100.0%) |
| Food Preparation & Serving | 6 (100.0%) | 0 (0.0%) |
| Cleaning & Maintenance | 0 (0.0%) | 1 (100.0%) |
| Personal Care & Service | 0 (0.0%) | 0 (0.0%) |
| Total (Category) | 6 (19.4%) | 25 (80.6%) |
| Total (Overall) | 51 (52.0%) | 47 (48.0%) |
Sales and Office Occupations
The most common Sales and Office occupations in Fox Lake are Sales & Related (8 | 8.2%), and Office & Administration (7 | 7.1%).
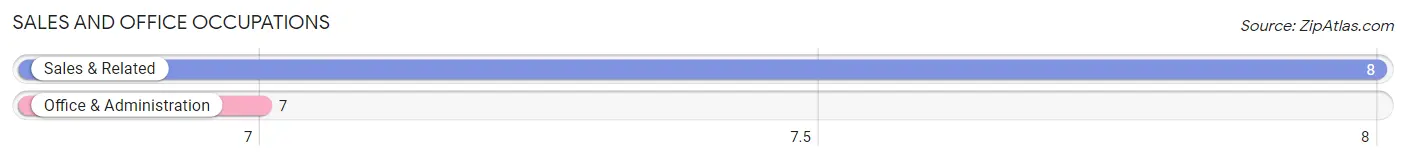
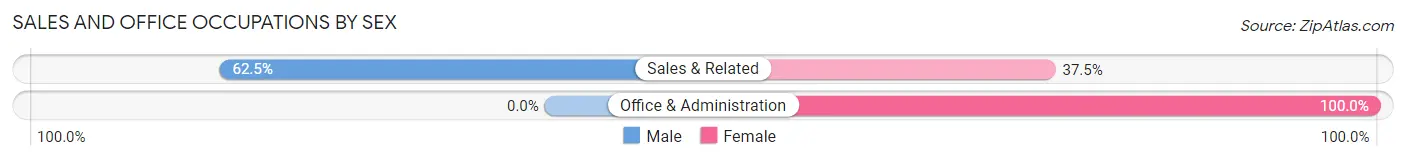
Sales and Office Occupations by Sex
| Occupation | Male | Female |
| Sales & Related | 5 (62.5%) | 3 (37.5%) |
| Office & Administration | 0 (0.0%) | 7 (100.0%) |
| Total (Category) | 5 (33.3%) | 10 (66.7%) |
| Total (Overall) | 51 (52.0%) | 47 (48.0%) |
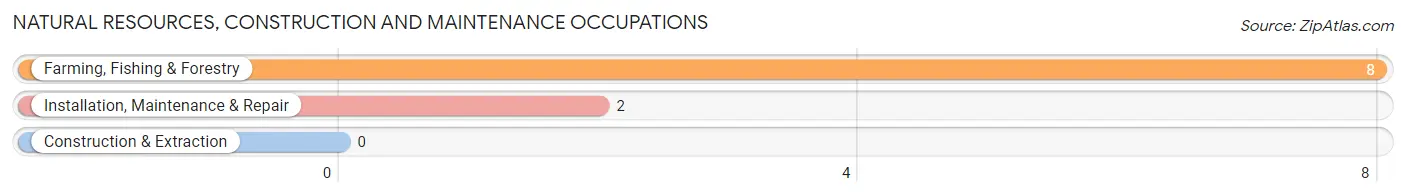
Natural Resources, Construction and Maintenance Occupations
The most common Natural Resources, Construction and Maintenance occupations in Fox Lake are Farming, Fishing & Forestry (8 | 8.2%), and Installation, Maintenance & Repair (2 | 2.0%).
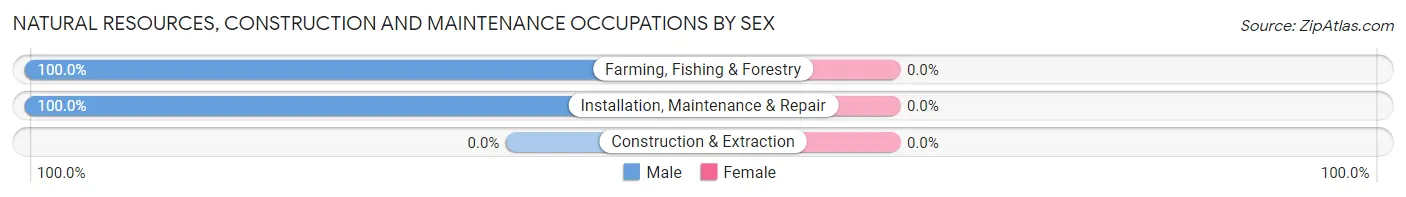
Natural Resources, Construction and Maintenance Occupations by Sex
| Occupation | Male | Female |
| Farming, Fishing & Forestry | 8 (100.0%) | 0 (0.0%) |
| Construction & Extraction | 0 (0.0%) | 0 (0.0%) |
| Installation, Maintenance & Repair | 2 (100.0%) | 0 (0.0%) |
| Total (Category) | 10 (100.0%) | 0 (0.0%) |
| Total (Overall) | 51 (52.0%) | 47 (48.0%) |
Production, Transportation and Moving Occupations
The most common Production, Transportation and Moving occupations in Fox Lake are Transportation (6 | 6.1%), and Production (3 | 3.1%).
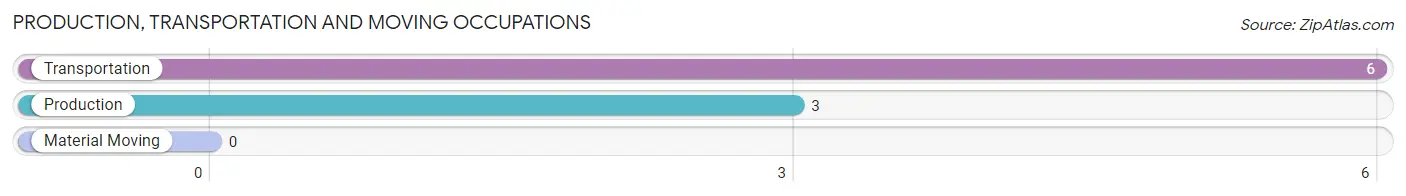
Production, Transportation and Moving Occupations by Sex
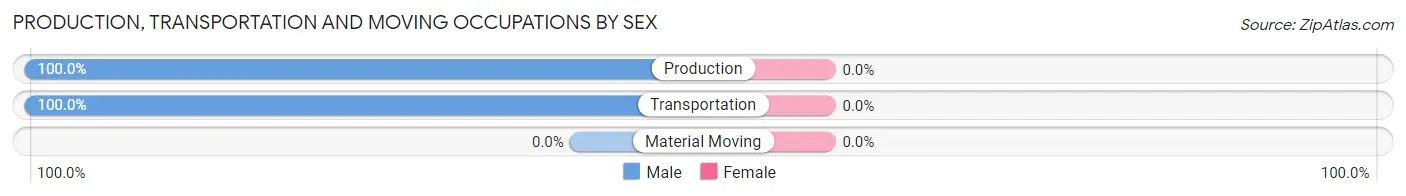
| Occupation | Male | Female |
| Production | 3 (100.0%) | 0 (0.0%) |
| Transportation | 6 (100.0%) | 0 (0.0%) |
| Material Moving | 0 (0.0%) | 0 (0.0%) |
| Total (Category) | 9 (100.0%) | 0 (0.0%) |
| Total (Overall) | 51 (52.0%) | 47 (48.0%) |
Employment Industries by Sex in Fox Lake
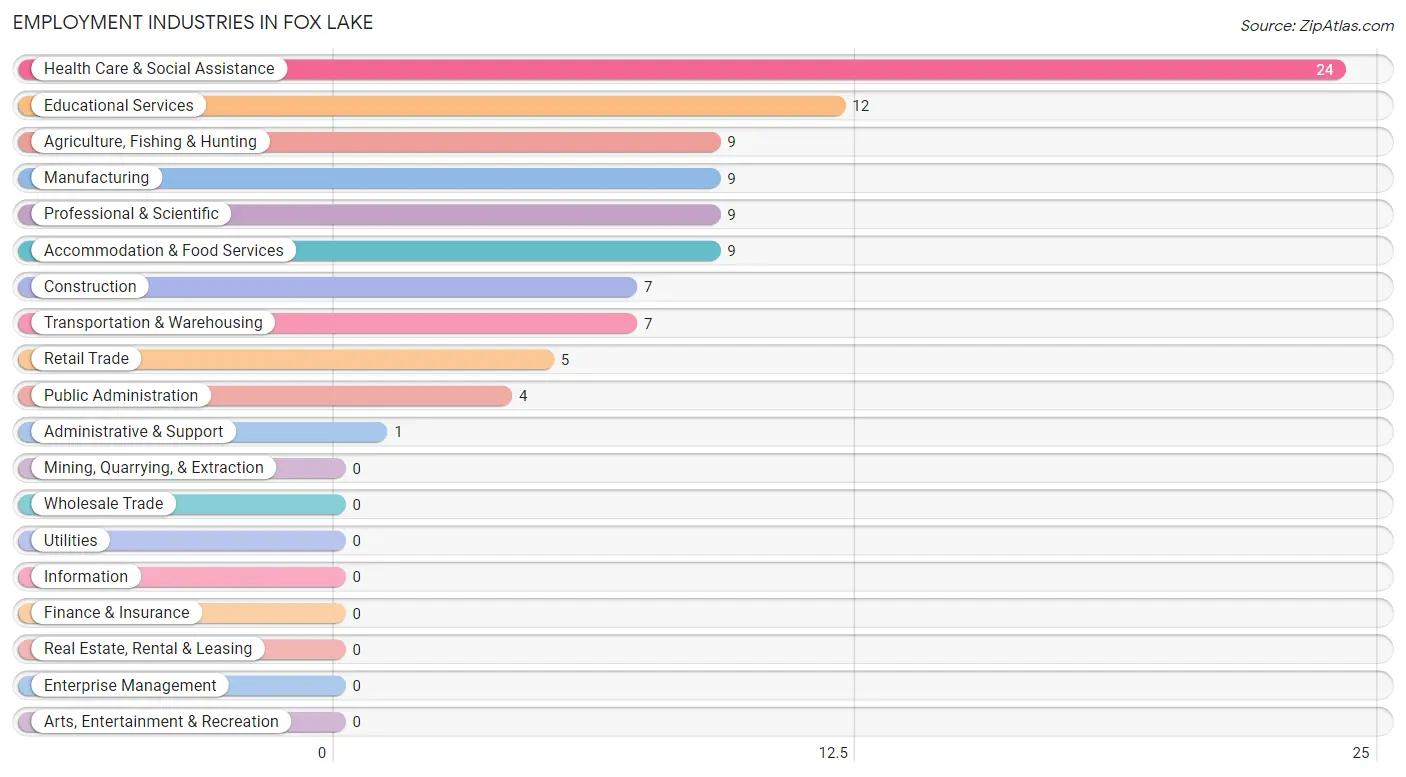
Employment Industries in Fox Lake
The major employment industries in Fox Lake include Health Care & Social Assistance (24 | 24.5%), Educational Services (12 | 12.2%), Agriculture, Fishing & Hunting (9 | 9.2%), Manufacturing (9 | 9.2%), and Professional & Scientific (9 | 9.2%).
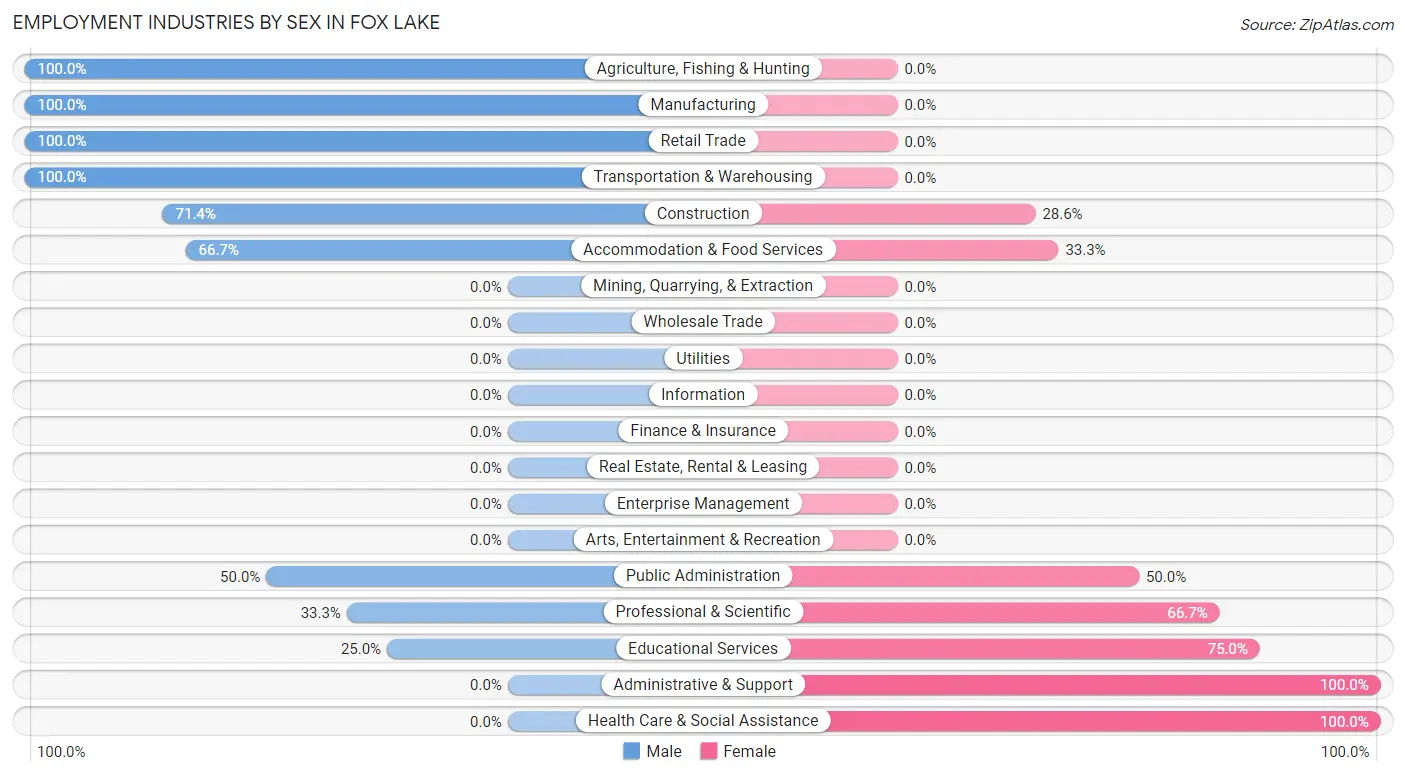
Employment Industries by Sex in Fox Lake
The Fox Lake industries that see more men than women are Agriculture, Fishing & Hunting (100.0%), Manufacturing (100.0%), and Retail Trade (100.0%), whereas the industries that tend to have a higher number of women are Administrative & Support (100.0%), Health Care & Social Assistance (100.0%), and Educational Services (75.0%).
| Industry | Male | Female |
| Agriculture, Fishing & Hunting | 9 (100.0%) | 0 (0.0%) |
| Mining, Quarrying, & Extraction | 0 (0.0%) | 0 (0.0%) |
| Construction | 5 (71.4%) | 2 (28.6%) |
| Manufacturing | 9 (100.0%) | 0 (0.0%) |
| Wholesale Trade | 0 (0.0%) | 0 (0.0%) |
| Retail Trade | 5 (100.0%) | 0 (0.0%) |
| Transportation & Warehousing | 7 (100.0%) | 0 (0.0%) |
| Utilities | 0 (0.0%) | 0 (0.0%) |
| Information | 0 (0.0%) | 0 (0.0%) |
| Finance & Insurance | 0 (0.0%) | 0 (0.0%) |
| Real Estate, Rental & Leasing | 0 (0.0%) | 0 (0.0%) |
| Professional & Scientific | 3 (33.3%) | 6 (66.7%) |
| Enterprise Management | 0 (0.0%) | 0 (0.0%) |
| Administrative & Support | 0 (0.0%) | 1 (100.0%) |
| Educational Services | 3 (25.0%) | 9 (75.0%) |
| Health Care & Social Assistance | 0 (0.0%) | 24 (100.0%) |
| Arts, Entertainment & Recreation | 0 (0.0%) | 0 (0.0%) |
| Accommodation & Food Services | 6 (66.7%) | 3 (33.3%) |
| Public Administration | 2 (50.0%) | 2 (50.0%) |
| Total | 51 (52.0%) | 47 (48.0%) |
Education in Fox Lake
School Enrollment in Fox Lake
The most common levels of schooling among the 72 students in Fox Lake are college / undergraduate (22 | 30.6%), middle school (15 | 20.8%), and high school (12 | 16.7%).
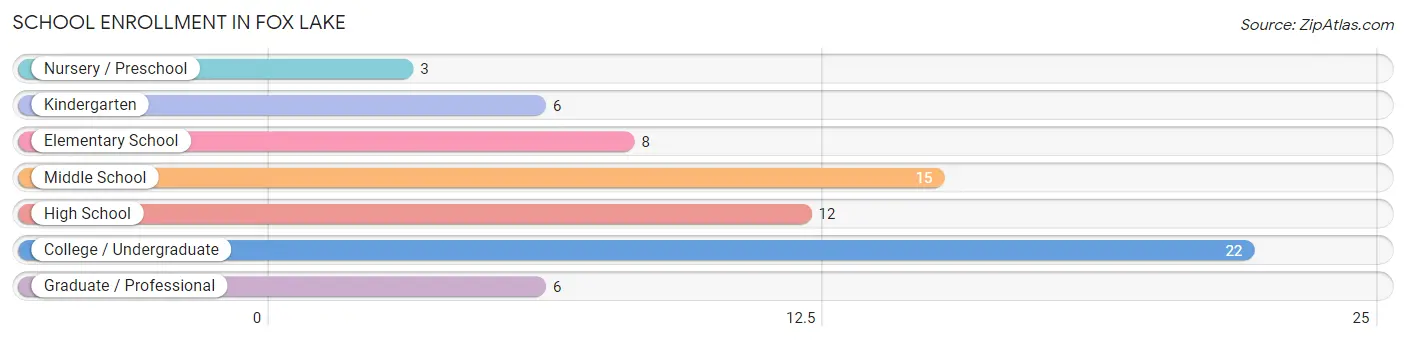
| School Level | # Students | % Students |
| Nursery / Preschool | 3 | 4.2% |
| Kindergarten | 6 | 8.3% |
| Elementary School | 8 | 11.1% |
| Middle School | 15 | 20.8% |
| High School | 12 | 16.7% |
| College / Undergraduate | 22 | 30.6% |
| Graduate / Professional | 6 | 8.3% |
| Total | 72 | 100.0% |
School Enrollment by Age by Funding Source in Fox Lake
Out of a total of 72 students who are enrolled in schools in Fox Lake, 9 (12.5%) attend a private institution, while the remaining 63 (87.5%) are enrolled in public schools. The age group of 5 to 9 year old has the highest likelihood of being enrolled in private schools, with 6 (42.9% in the age bracket) enrolled. Conversely, the age group of 3 to 4 year olds has the lowest likelihood of being enrolled in a private school, with 3 (100.0% in the age bracket) attending a public institution.
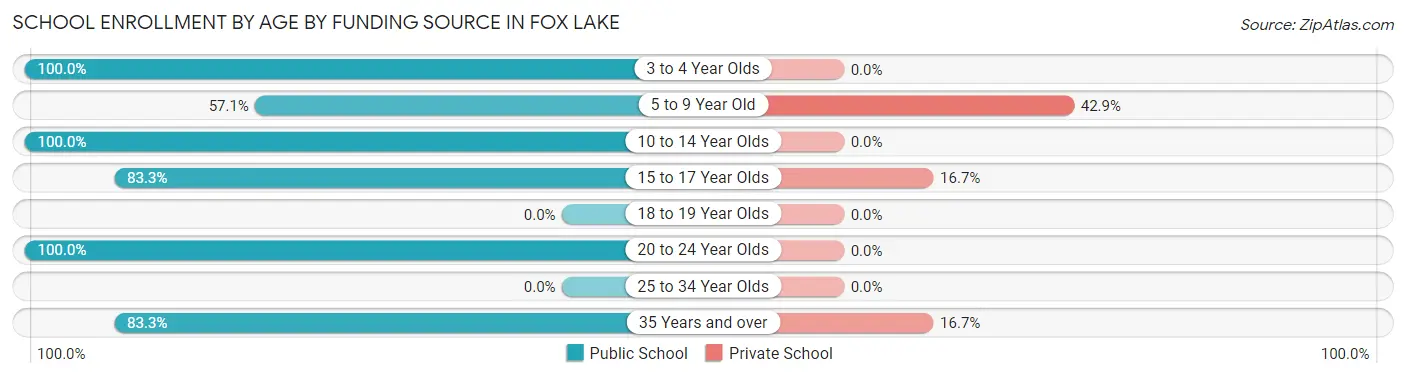
| Age Bracket | Public School | Private School |
| 3 to 4 Year Olds | 3 (100.0%) | 0 (0.0%) |
| 5 to 9 Year Old | 8 (57.1%) | 6 (42.9%) |
| 10 to 14 Year Olds | 15 (100.0%) | 0 (0.0%) |
| 15 to 17 Year Olds | 10 (83.3%) | 2 (16.7%) |
| 18 to 19 Year Olds | 0 (0.0%) | 0 (0.0%) |
| 20 to 24 Year Olds | 22 (100.0%) | 0 (0.0%) |
| 25 to 34 Year Olds | 0 (0.0%) | 0 (0.0%) |
| 35 Years and over | 5 (83.3%) | 1 (16.7%) |
| Total | 63 (87.5%) | 9 (12.5%) |
Educational Attainment by Field of Study in Fox Lake
Education (11 | 37.9%), arts & humanities (9 | 31.0%), bio, nature & agricultural (3 | 10.3%), business (3 | 10.3%), and communications (2 | 6.9%) are the most common fields of study among 29 individuals in Fox Lake who have obtained a bachelor's degree or higher.
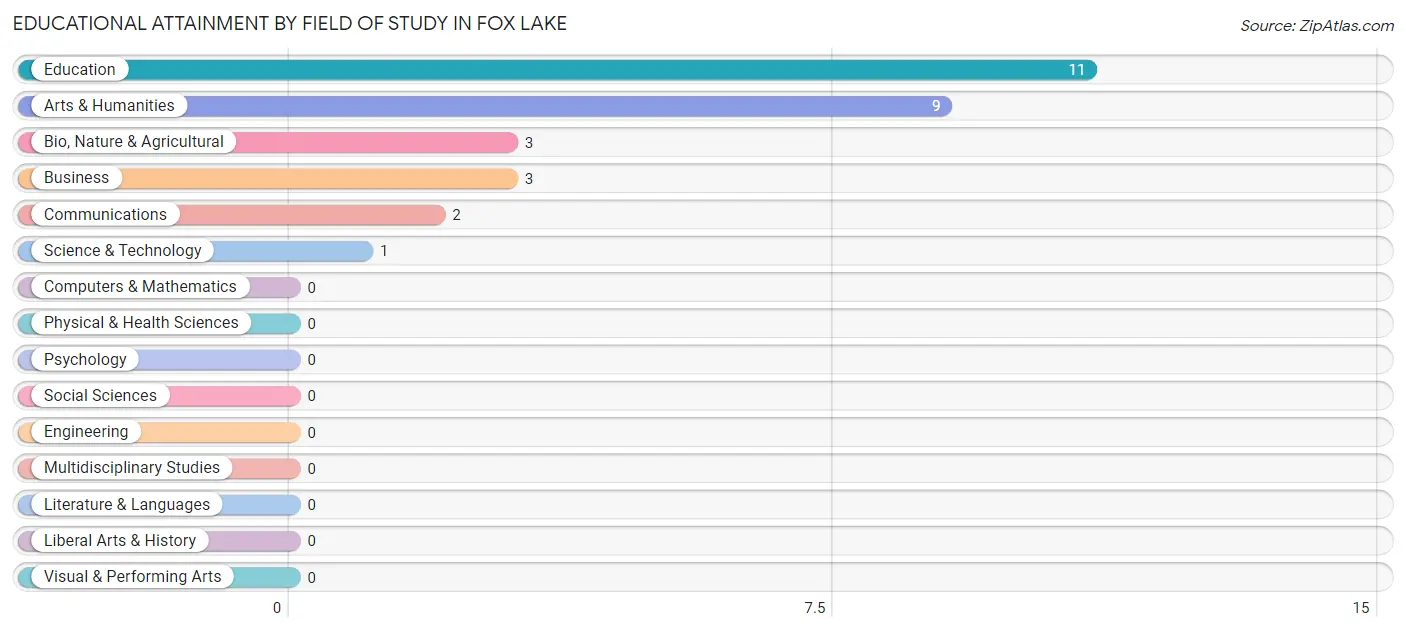
| Field of Study | # Graduates | % Graduates |
| Computers & Mathematics | 0 | 0.0% |
| Bio, Nature & Agricultural | 3 | 10.3% |
| Physical & Health Sciences | 0 | 0.0% |
| Psychology | 0 | 0.0% |
| Social Sciences | 0 | 0.0% |
| Engineering | 0 | 0.0% |
| Multidisciplinary Studies | 0 | 0.0% |
| Science & Technology | 1 | 3.5% |
| Business | 3 | 10.3% |
| Education | 11 | 37.9% |
| Literature & Languages | 0 | 0.0% |
| Liberal Arts & History | 0 | 0.0% |
| Visual & Performing Arts | 0 | 0.0% |
| Communications | 2 | 6.9% |
| Arts & Humanities | 9 | 31.0% |
| Total | 29 | 100.0% |
Transportation & Commute in Fox Lake
Vehicle Availability by Sex in Fox Lake
The most prevalent vehicle ownership categories in Fox Lake are males with 5 or more vehicles (18, accounting for 35.3%) and females with 5 or more vehicles (26, making up 40.0%).
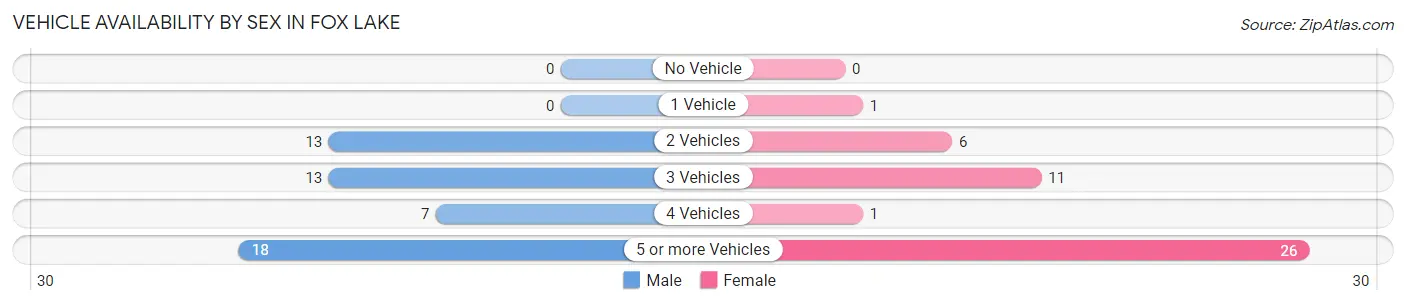
| Vehicles Available | Male | Female |
| No Vehicle | 0 (0.0%) | 0 (0.0%) |
| 1 Vehicle | 0 (0.0%) | 1 (2.2%) |
| 2 Vehicles | 13 (25.5%) | 6 (13.3%) |
| 3 Vehicles | 13 (25.5%) | 11 (24.4%) |
| 4 Vehicles | 7 (13.7%) | 1 (2.2%) |
| 5 or more Vehicles | 18 (35.3%) | 26 (57.8%) |
| Total | 51 (100.0%) | 45 (100.0%) |
Commute Time in Fox Lake
The most frequently occuring commute durations in Fox Lake are 35 to 39 minutes (24 commuters, 25.8%), less than 5 minutes (20 commuters, 21.5%), and 20 to 24 minutes (12 commuters, 12.9%).
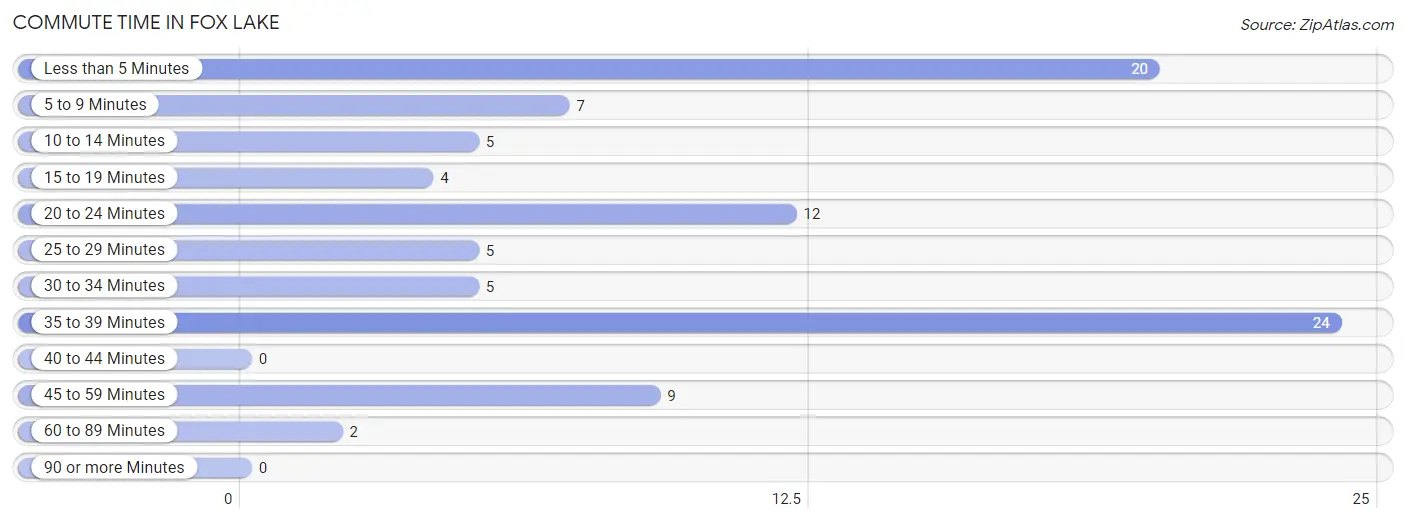
| Commute Time | # Commuters | % Commuters |
| Less than 5 Minutes | 20 | 21.5% |
| 5 to 9 Minutes | 7 | 7.5% |
| 10 to 14 Minutes | 5 | 5.4% |
| 15 to 19 Minutes | 4 | 4.3% |
| 20 to 24 Minutes | 12 | 12.9% |
| 25 to 29 Minutes | 5 | 5.4% |
| 30 to 34 Minutes | 5 | 5.4% |
| 35 to 39 Minutes | 24 | 25.8% |
| 40 to 44 Minutes | 0 | 0.0% |
| 45 to 59 Minutes | 9 | 9.7% |
| 60 to 89 Minutes | 2 | 2.1% |
| 90 or more Minutes | 0 | 0.0% |
Commute Time by Sex in Fox Lake
The most common commute times in Fox Lake are 20 to 24 minutes (12 commuters, 25.0%) for males and 35 to 39 minutes (22 commuters, 48.9%) for females.
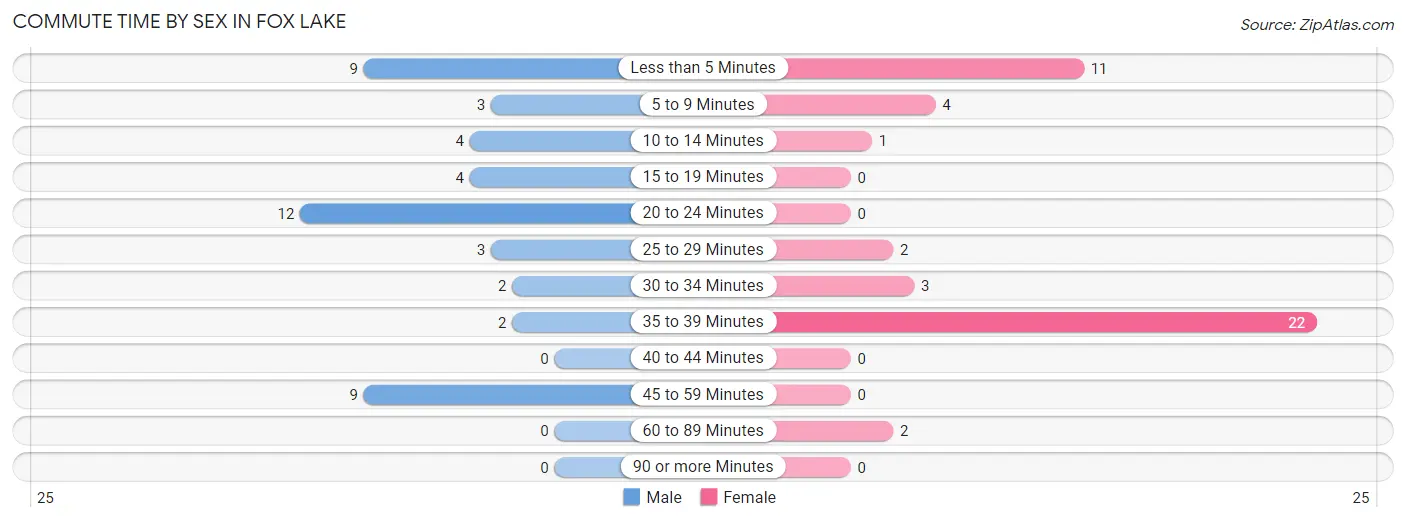
| Commute Time | Male | Female |
| Less than 5 Minutes | 9 (18.8%) | 11 (24.4%) |
| 5 to 9 Minutes | 3 (6.2%) | 4 (8.9%) |
| 10 to 14 Minutes | 4 (8.3%) | 1 (2.2%) |
| 15 to 19 Minutes | 4 (8.3%) | 0 (0.0%) |
| 20 to 24 Minutes | 12 (25.0%) | 0 (0.0%) |
| 25 to 29 Minutes | 3 (6.2%) | 2 (4.4%) |
| 30 to 34 Minutes | 2 (4.2%) | 3 (6.7%) |
| 35 to 39 Minutes | 2 (4.2%) | 22 (48.9%) |
| 40 to 44 Minutes | 0 (0.0%) | 0 (0.0%) |
| 45 to 59 Minutes | 9 (18.8%) | 0 (0.0%) |
| 60 to 89 Minutes | 0 (0.0%) | 2 (4.4%) |
| 90 or more Minutes | 0 (0.0%) | 0 (0.0%) |
Time of Departure to Work by Sex in Fox Lake
The most frequent times of departure to work in Fox Lake are 6:00 AM to 6:29 AM (13, 27.1%) for males and 4:00 PM to 11:59 PM (22, 48.9%) for females.
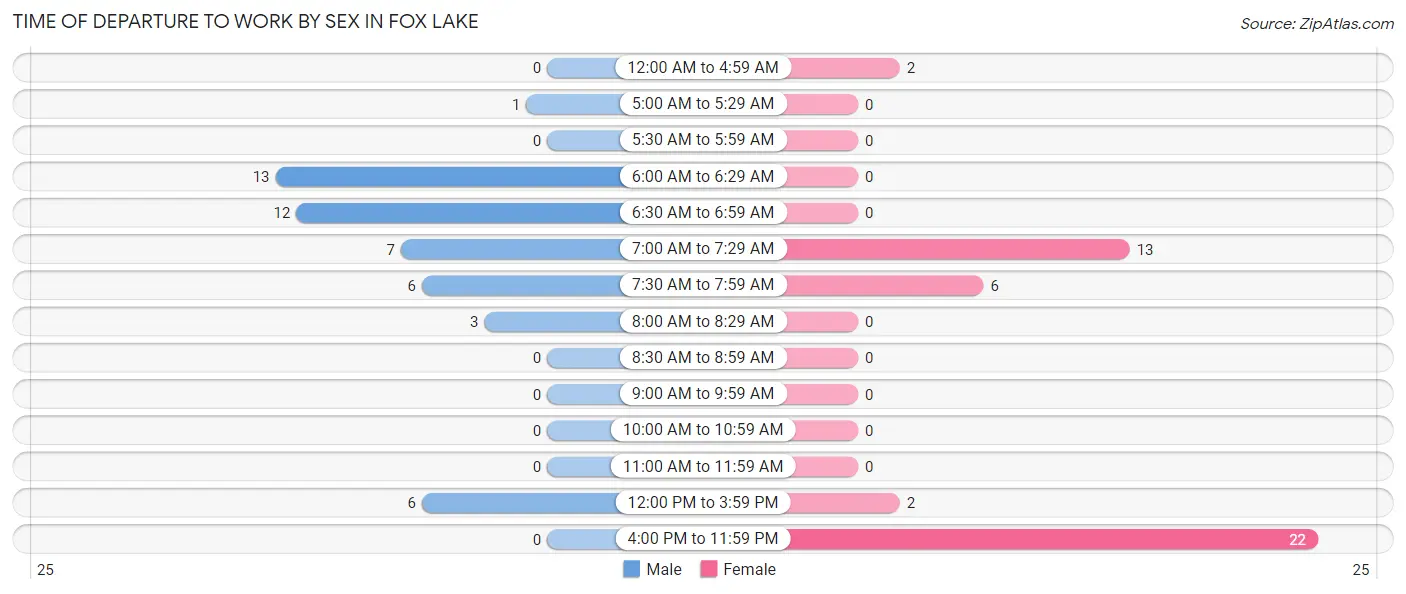
| Time of Departure | Male | Female |
| 12:00 AM to 4:59 AM | 0 (0.0%) | 2 (4.4%) |
| 5:00 AM to 5:29 AM | 1 (2.1%) | 0 (0.0%) |
| 5:30 AM to 5:59 AM | 0 (0.0%) | 0 (0.0%) |
| 6:00 AM to 6:29 AM | 13 (27.1%) | 0 (0.0%) |
| 6:30 AM to 6:59 AM | 12 (25.0%) | 0 (0.0%) |
| 7:00 AM to 7:29 AM | 7 (14.6%) | 13 (28.9%) |
| 7:30 AM to 7:59 AM | 6 (12.5%) | 6 (13.3%) |
| 8:00 AM to 8:29 AM | 3 (6.2%) | 0 (0.0%) |
| 8:30 AM to 8:59 AM | 0 (0.0%) | 0 (0.0%) |
| 9:00 AM to 9:59 AM | 0 (0.0%) | 0 (0.0%) |
| 10:00 AM to 10:59 AM | 0 (0.0%) | 0 (0.0%) |
| 11:00 AM to 11:59 AM | 0 (0.0%) | 0 (0.0%) |
| 12:00 PM to 3:59 PM | 6 (12.5%) | 2 (4.4%) |
| 4:00 PM to 11:59 PM | 0 (0.0%) | 22 (48.9%) |
| Total | 48 (100.0%) | 45 (100.0%) |
Housing Occupancy in Fox Lake
Occupancy by Ownership in Fox Lake
Of the total 59 dwellings in Fox Lake, owner-occupied units account for 40 (67.8%), while renter-occupied units make up 19 (32.2%).
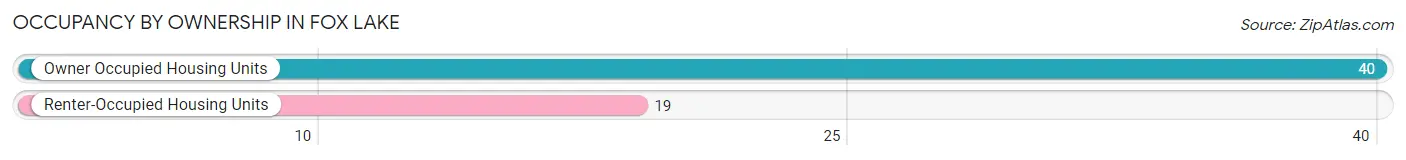
| Occupancy | # Housing Units | % Housing Units |
| Owner Occupied Housing Units | 40 | 67.8% |
| Renter-Occupied Housing Units | 19 | 32.2% |
| Total Occupied Housing Units | 59 | 100.0% |
Occupancy by Household Size in Fox Lake
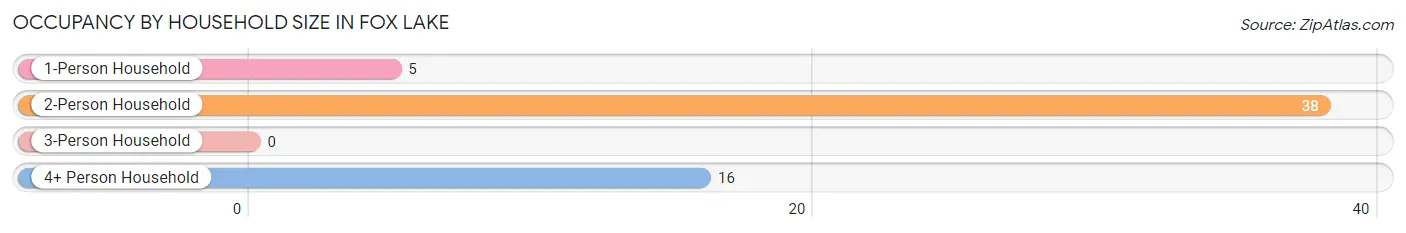
| Household Size | # Housing Units | % Housing Units |
| 1-Person Household | 5 | 8.5% |
| 2-Person Household | 38 | 64.4% |
| 3-Person Household | 0 | 0.0% |
| 4+ Person Household | 16 | 27.1% |
| Total Housing Units | 59 | 100.0% |
Occupancy by Ownership by Household Size in Fox Lake
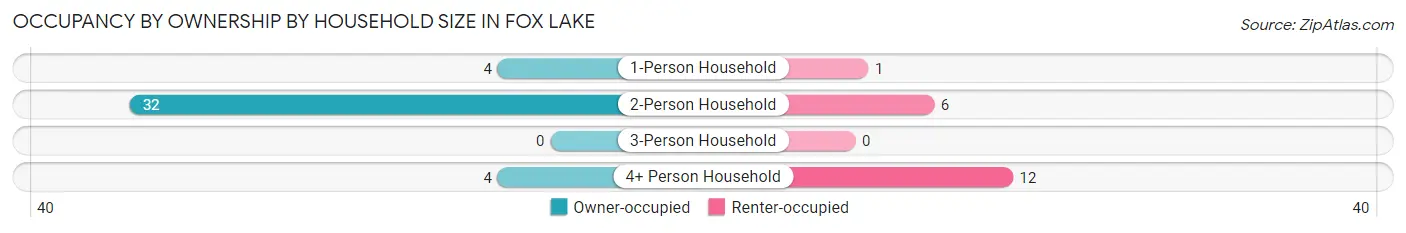
| Household Size | Owner-occupied | Renter-occupied |
| 1-Person Household | 4 (80.0%) | 1 (20.0%) |
| 2-Person Household | 32 (84.2%) | 6 (15.8%) |
| 3-Person Household | 0 (0.0%) | 0 (0.0%) |
| 4+ Person Household | 4 (25.0%) | 12 (75.0%) |
| Total Housing Units | 40 (67.8%) | 19 (32.2%) |
Occupancy by Educational Attainment in Fox Lake
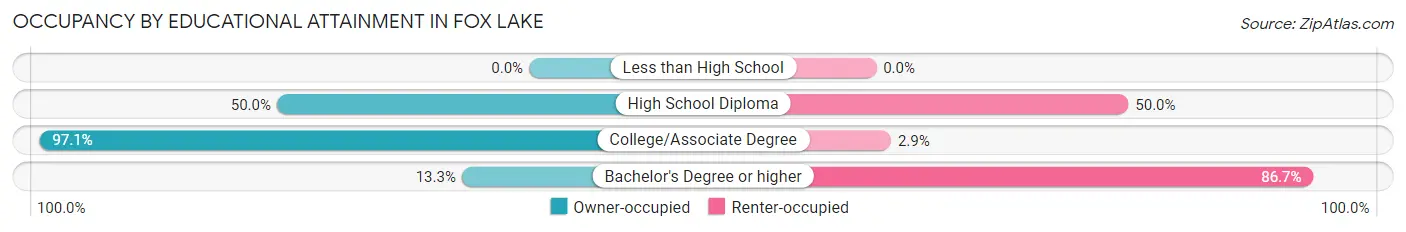
| Household Size | Owner-occupied | Renter-occupied |
| Less than High School | 0 (0.0%) | 0 (0.0%) |
| High School Diploma | 5 (50.0%) | 5 (50.0%) |
| College/Associate Degree | 33 (97.1%) | 1 (2.9%) |
| Bachelor's Degree or higher | 2 (13.3%) | 13 (86.7%) |
Occupancy by Age of Householder in Fox Lake
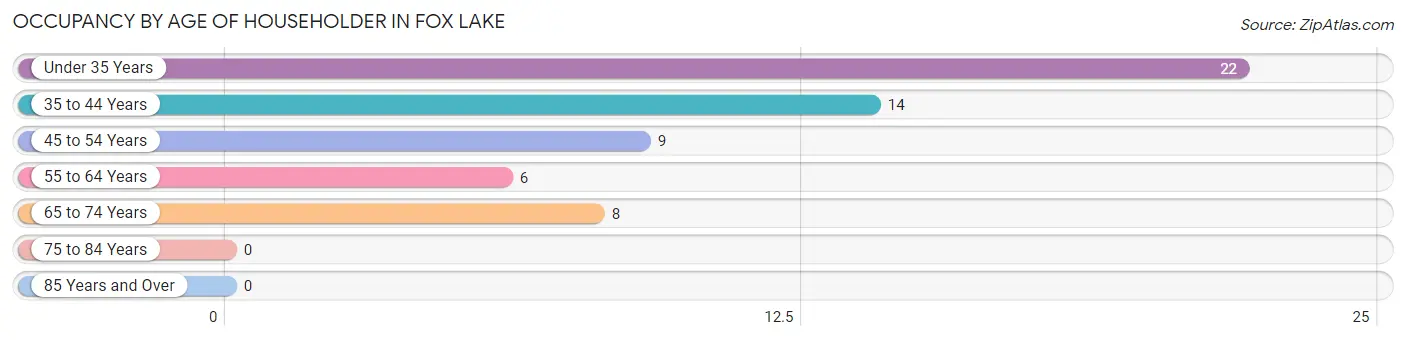
| Age Bracket | # Households | % Households |
| Under 35 Years | 22 | 37.3% |
| 35 to 44 Years | 14 | 23.7% |
| 45 to 54 Years | 9 | 15.2% |
| 55 to 64 Years | 6 | 10.2% |
| 65 to 74 Years | 8 | 13.6% |
| 75 to 84 Years | 0 | 0.0% |
| 85 Years and Over | 0 | 0.0% |
| Total | 59 | 100.0% |
Housing Finances in Fox Lake
Median Income by Occupancy in Fox Lake
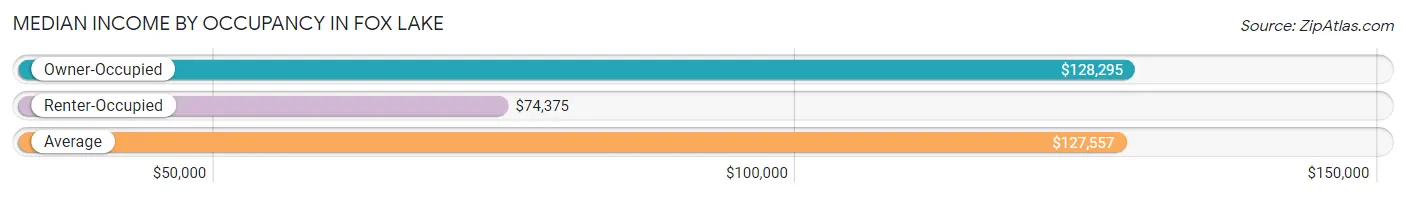
| Occupancy Type | # Households | Median Income |
| Owner-Occupied | 40 (67.8%) | $128,295 |
| Renter-Occupied | 19 (32.2%) | $74,375 |
| Average | 59 (100.0%) | $127,557 |
Occupancy by Householder Income Bracket in Fox Lake
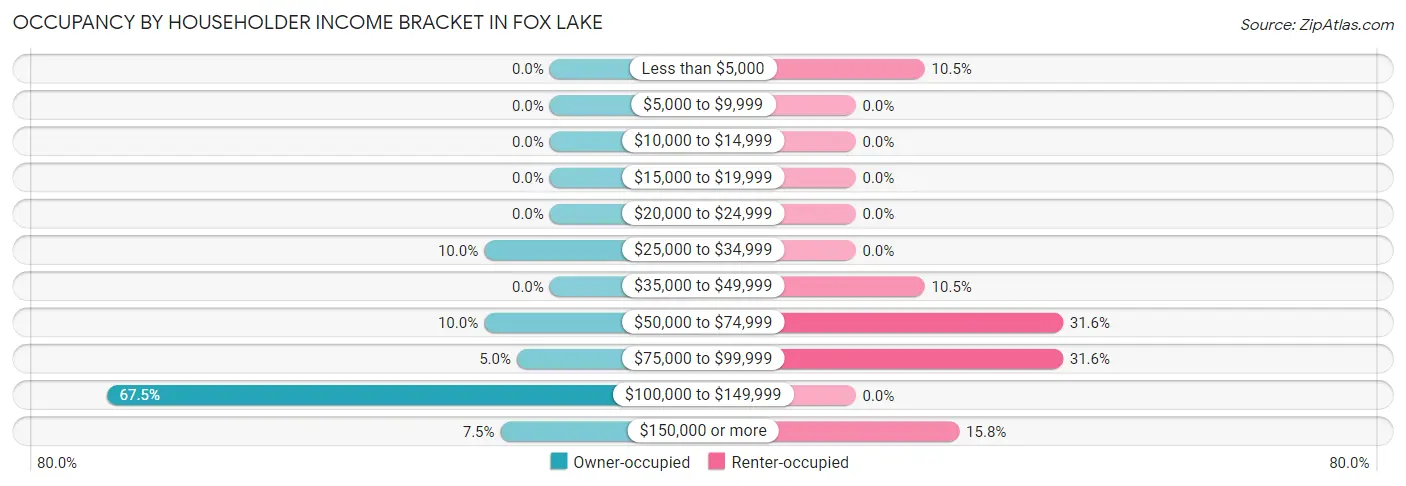
| Income Bracket | Owner-occupied | Renter-occupied |
| Less than $5,000 | 0 (0.0%) | 2 (10.5%) |
| $5,000 to $9,999 | 0 (0.0%) | 0 (0.0%) |
| $10,000 to $14,999 | 0 (0.0%) | 0 (0.0%) |
| $15,000 to $19,999 | 0 (0.0%) | 0 (0.0%) |
| $20,000 to $24,999 | 0 (0.0%) | 0 (0.0%) |
| $25,000 to $34,999 | 4 (10.0%) | 0 (0.0%) |
| $35,000 to $49,999 | 0 (0.0%) | 2 (10.5%) |
| $50,000 to $74,999 | 4 (10.0%) | 6 (31.6%) |
| $75,000 to $99,999 | 2 (5.0%) | 6 (31.6%) |
| $100,000 to $149,999 | 27 (67.5%) | 0 (0.0%) |
| $150,000 or more | 3 (7.5%) | 3 (15.8%) |
| Total | 40 (100.0%) | 19 (100.0%) |
Monthly Housing Cost Tiers in Fox Lake
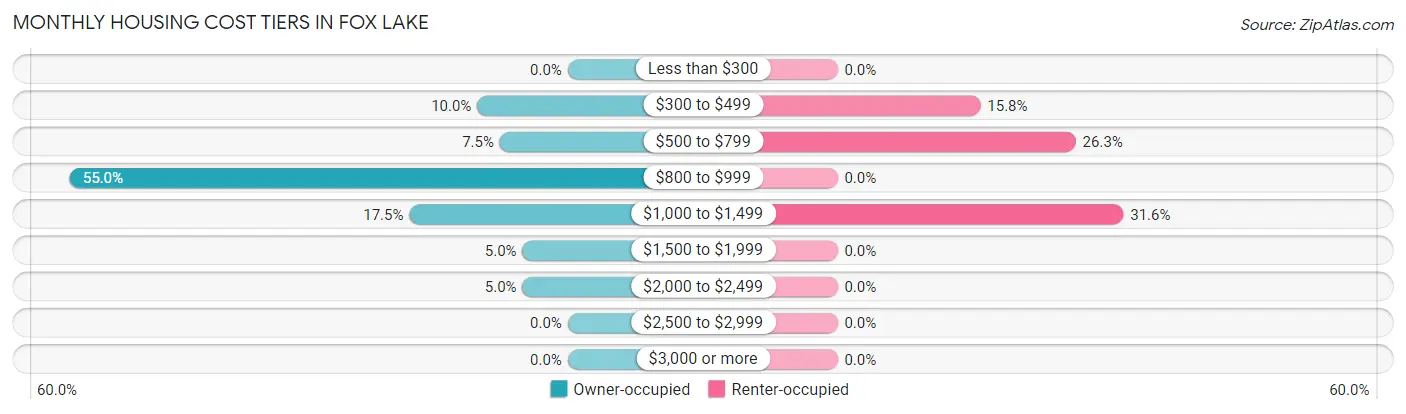
| Monthly Cost | Owner-occupied | Renter-occupied |
| Less than $300 | 0 (0.0%) | 0 (0.0%) |
| $300 to $499 | 4 (10.0%) | 3 (15.8%) |
| $500 to $799 | 3 (7.5%) | 5 (26.3%) |
| $800 to $999 | 22 (55.0%) | 0 (0.0%) |
| $1,000 to $1,499 | 7 (17.5%) | 6 (31.6%) |
| $1,500 to $1,999 | 2 (5.0%) | 0 (0.0%) |
| $2,000 to $2,499 | 2 (5.0%) | 0 (0.0%) |
| $2,500 to $2,999 | 0 (0.0%) | 0 (0.0%) |
| $3,000 or more | 0 (0.0%) | 0 (0.0%) |
| Total | 40 (100.0%) | 19 (100.0%) |
Physical Housing Characteristics in Fox Lake
Housing Structures in Fox Lake
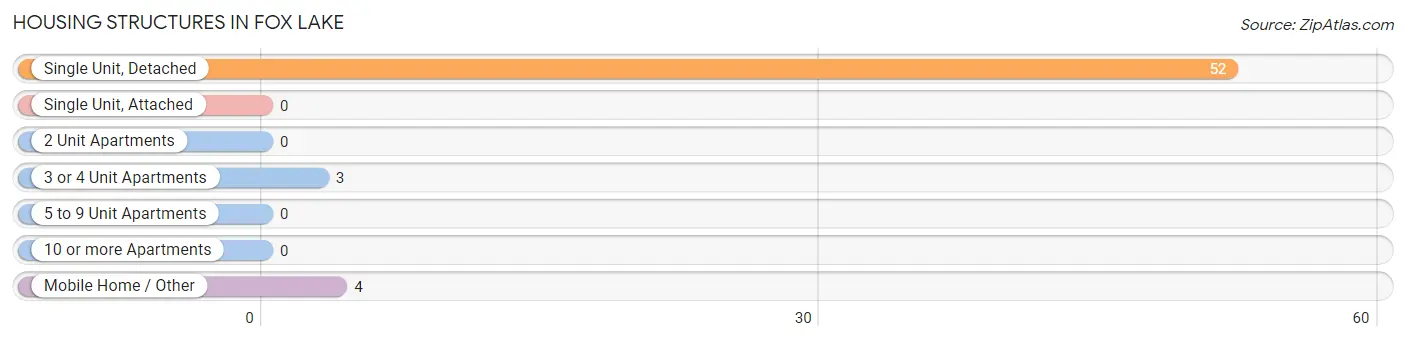
| Structure Type | # Housing Units | % Housing Units |
| Single Unit, Detached | 52 | 88.1% |
| Single Unit, Attached | 0 | 0.0% |
| 2 Unit Apartments | 0 | 0.0% |
| 3 or 4 Unit Apartments | 3 | 5.1% |
| 5 to 9 Unit Apartments | 0 | 0.0% |
| 10 or more Apartments | 0 | 0.0% |
| Mobile Home / Other | 4 | 6.8% |
| Total | 59 | 100.0% |
Housing Structures by Occupancy in Fox Lake
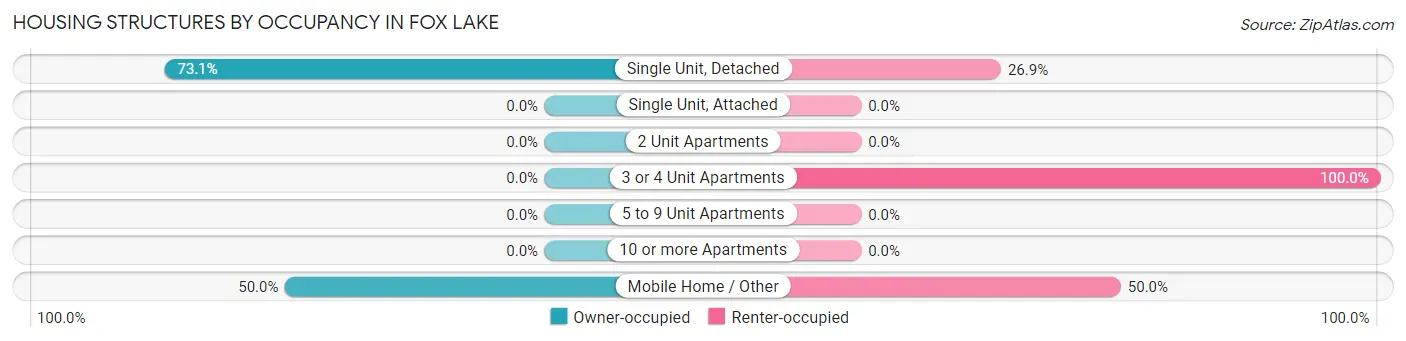
| Structure Type | Owner-occupied | Renter-occupied |
| Single Unit, Detached | 38 (73.1%) | 14 (26.9%) |
| Single Unit, Attached | 0 (0.0%) | 0 (0.0%) |
| 2 Unit Apartments | 0 (0.0%) | 0 (0.0%) |
| 3 or 4 Unit Apartments | 0 (0.0%) | 3 (100.0%) |
| 5 to 9 Unit Apartments | 0 (0.0%) | 0 (0.0%) |
| 10 or more Apartments | 0 (0.0%) | 0 (0.0%) |
| Mobile Home / Other | 2 (50.0%) | 2 (50.0%) |
| Total | 40 (67.8%) | 19 (32.2%) |
Housing Structures by Number of Rooms in Fox Lake
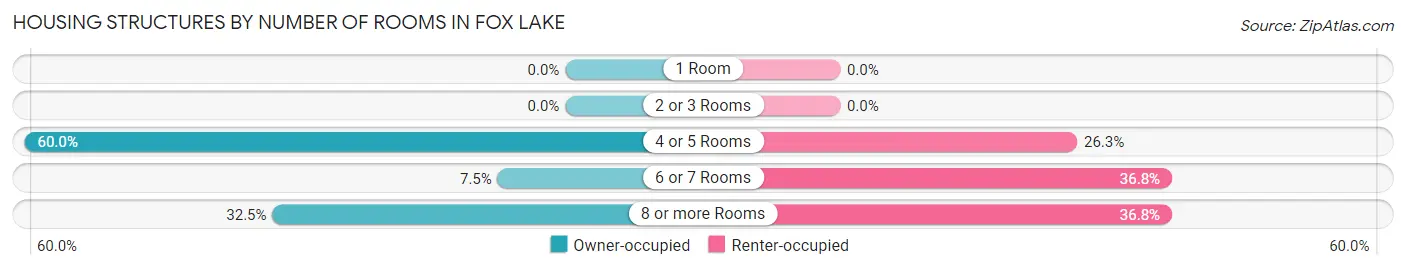
| Number of Rooms | Owner-occupied | Renter-occupied |
| 1 Room | 0 (0.0%) | 0 (0.0%) |
| 2 or 3 Rooms | 0 (0.0%) | 0 (0.0%) |
| 4 or 5 Rooms | 24 (60.0%) | 5 (26.3%) |
| 6 or 7 Rooms | 3 (7.5%) | 7 (36.8%) |
| 8 or more Rooms | 13 (32.5%) | 7 (36.8%) |
| Total | 40 (100.0%) | 19 (100.0%) |
Housing Structure by Heating Type in Fox Lake
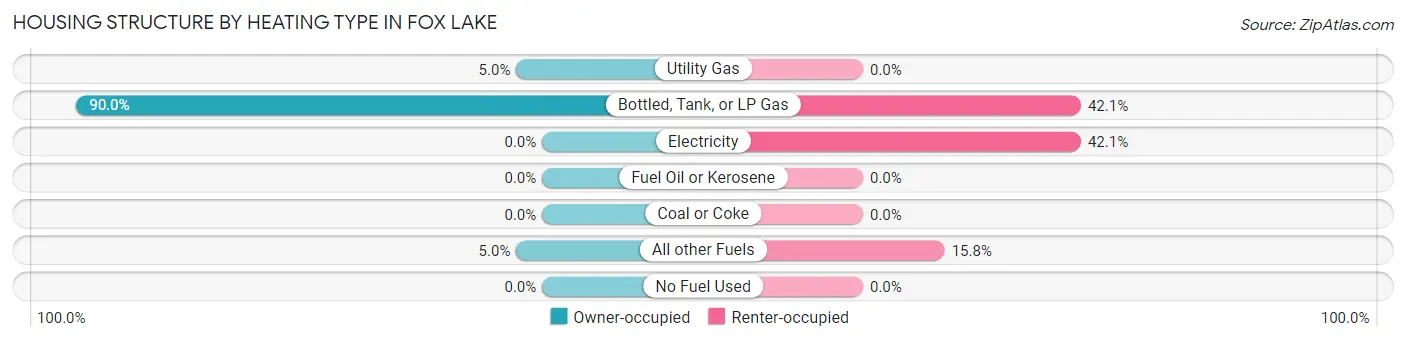
| Heating Type | Owner-occupied | Renter-occupied |
| Utility Gas | 2 (5.0%) | 0 (0.0%) |
| Bottled, Tank, or LP Gas | 36 (90.0%) | 8 (42.1%) |
| Electricity | 0 (0.0%) | 8 (42.1%) |
| Fuel Oil or Kerosene | 0 (0.0%) | 0 (0.0%) |
| Coal or Coke | 0 (0.0%) | 0 (0.0%) |
| All other Fuels | 2 (5.0%) | 3 (15.8%) |
| No Fuel Used | 0 (0.0%) | 0 (0.0%) |
| Total | 40 (100.0%) | 19 (100.0%) |
Household Vehicle Usage in Fox Lake
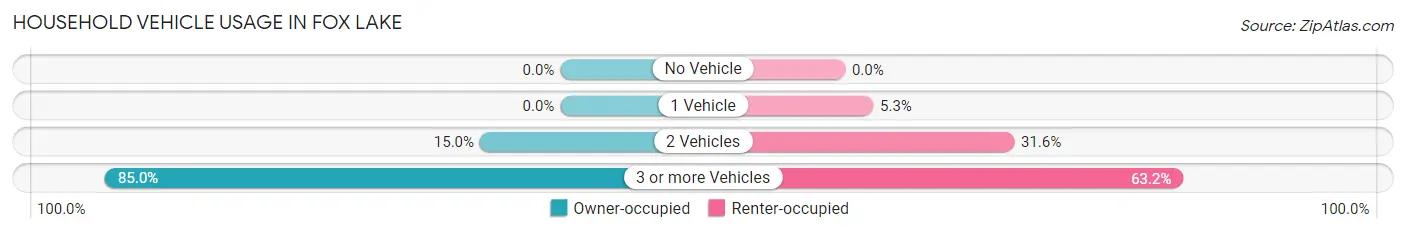
| Vehicles per Household | Owner-occupied | Renter-occupied |
| No Vehicle | 0 (0.0%) | 0 (0.0%) |
| 1 Vehicle | 0 (0.0%) | 1 (5.3%) |
| 2 Vehicles | 6 (15.0%) | 6 (31.6%) |
| 3 or more Vehicles | 34 (85.0%) | 12 (63.2%) |
| Total | 40 (100.0%) | 19 (100.0%) |
Real Estate & Mortgages in Fox Lake
Real Estate and Mortgage Overview in Fox Lake
| Characteristic | Without Mortgage | With Mortgage |
| Housing Units | 9 | 31 |
| Median Property Value | - | - |
| Median Household Income | - | - |
| Monthly Housing Costs | $717 | $0 |
| Real Estate Taxes | $1,250 | $0 |
Property Value by Mortgage Status in Fox Lake
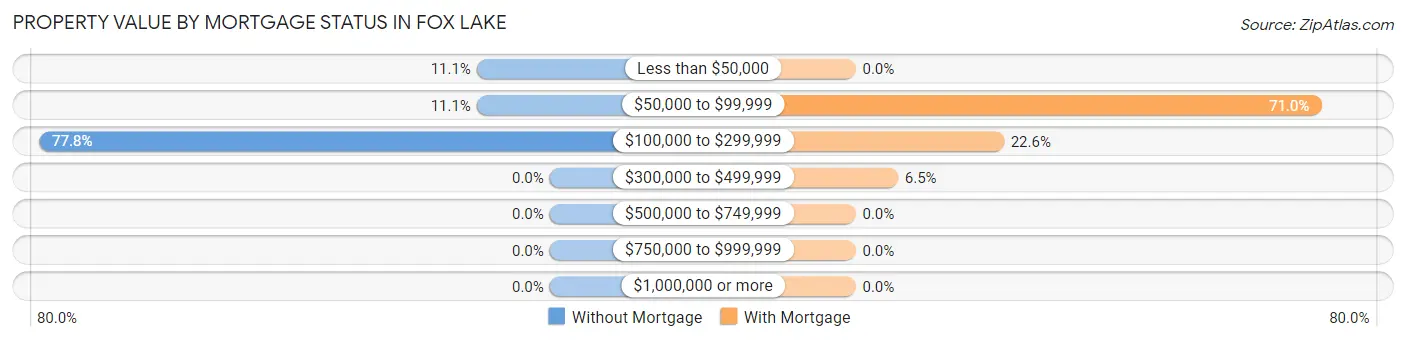
| Property Value | Without Mortgage | With Mortgage |
| Less than $50,000 | 1 (11.1%) | 0 (0.0%) |
| $50,000 to $99,999 | 1 (11.1%) | 22 (71.0%) |
| $100,000 to $299,999 | 7 (77.8%) | 7 (22.6%) |
| $300,000 to $499,999 | 0 (0.0%) | 2 (6.5%) |
| $500,000 to $749,999 | 0 (0.0%) | 0 (0.0%) |
| $750,000 to $999,999 | 0 (0.0%) | 0 (0.0%) |
| $1,000,000 or more | 0 (0.0%) | 0 (0.0%) |
| Total | 9 (100.0%) | 31 (100.0%) |
Household Income by Mortgage Status in Fox Lake
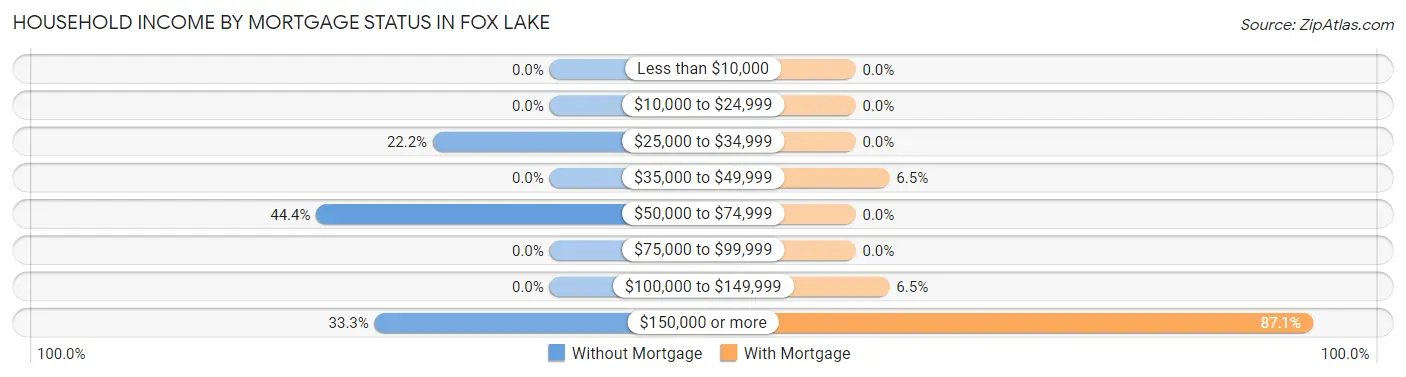
| Household Income | Without Mortgage | With Mortgage |
| Less than $10,000 | 0 (0.0%) | 0 (0.0%) |
| $10,000 to $24,999 | 0 (0.0%) | 0 (0.0%) |
| $25,000 to $34,999 | 2 (22.2%) | 0 (0.0%) |
| $35,000 to $49,999 | 0 (0.0%) | 2 (6.5%) |
| $50,000 to $74,999 | 4 (44.4%) | 0 (0.0%) |
| $75,000 to $99,999 | 0 (0.0%) | 0 (0.0%) |
| $100,000 to $149,999 | 0 (0.0%) | 2 (6.5%) |
| $150,000 or more | 3 (33.3%) | 27 (87.1%) |
| Total | 9 (100.0%) | 31 (100.0%) |
Property Value to Household Income Ratio in Fox Lake
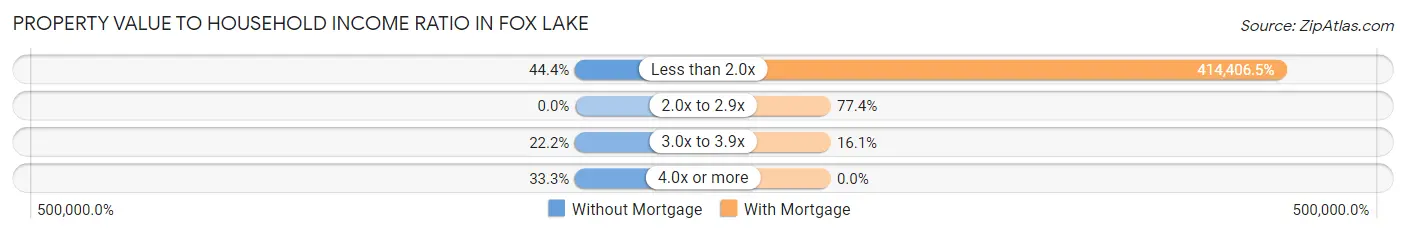
| Value-to-Income Ratio | Without Mortgage | With Mortgage |
| Less than 2.0x | 4 (44.4%) | 128,466 (414,406.5%) |
| 2.0x to 2.9x | 0 (0.0%) | 24 (77.4%) |
| 3.0x to 3.9x | 2 (22.2%) | 5 (16.1%) |
| 4.0x or more | 3 (33.3%) | 0 (0.0%) |
| Total | 9 (100.0%) | 31 (100.0%) |
Real Estate Taxes by Mortgage Status in Fox Lake
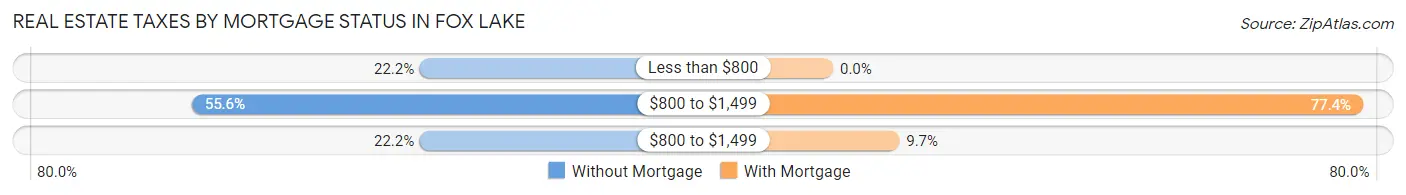
| Property Taxes | Without Mortgage | With Mortgage |
| Less than $800 | 2 (22.2%) | 0 (0.0%) |
| $800 to $1,499 | 5 (55.6%) | 24 (77.4%) |
| $800 to $1,499 | 2 (22.2%) | 3 (9.7%) |
| Total | 9 (100.0%) | 31 (100.0%) |
Health & Disability in Fox Lake
Health Insurance Coverage by Age in Fox Lake
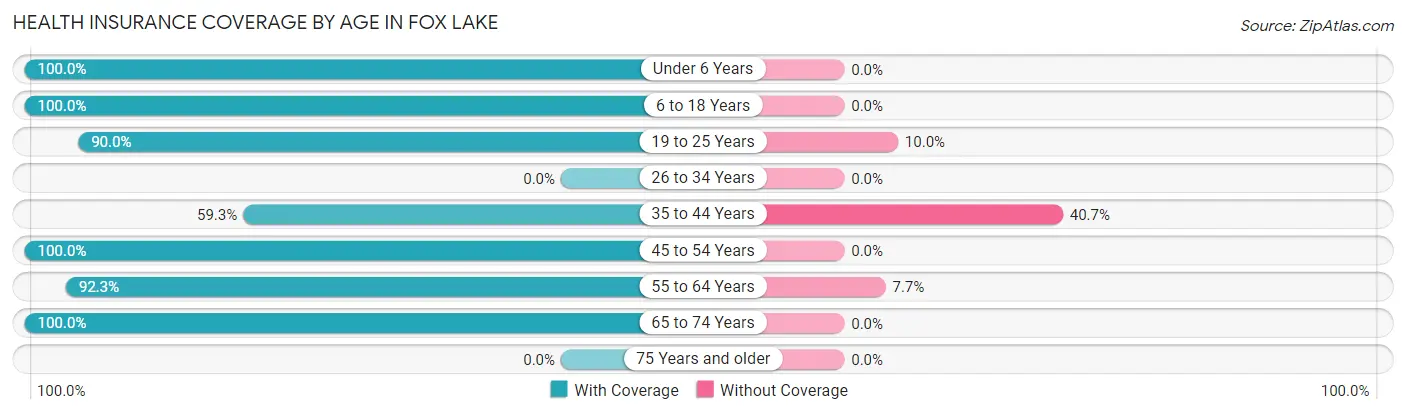
| Age Bracket | With Coverage | Without Coverage |
| Under 6 Years | 22 (100.0%) | 0 (0.0%) |
| 6 to 18 Years | 44 (100.0%) | 0 (0.0%) |
| 19 to 25 Years | 36 (90.0%) | 4 (10.0%) |
| 26 to 34 Years | 0 (0.0%) | 0 (0.0%) |
| 35 to 44 Years | 16 (59.3%) | 11 (40.7%) |
| 45 to 54 Years | 16 (100.0%) | 0 (0.0%) |
| 55 to 64 Years | 12 (92.3%) | 1 (7.7%) |
| 65 to 74 Years | 12 (100.0%) | 0 (0.0%) |
| 75 Years and older | 0 (0.0%) | 0 (0.0%) |
| Total | 158 (90.8%) | 16 (9.2%) |
Health Insurance Coverage by Citizenship Status in Fox Lake
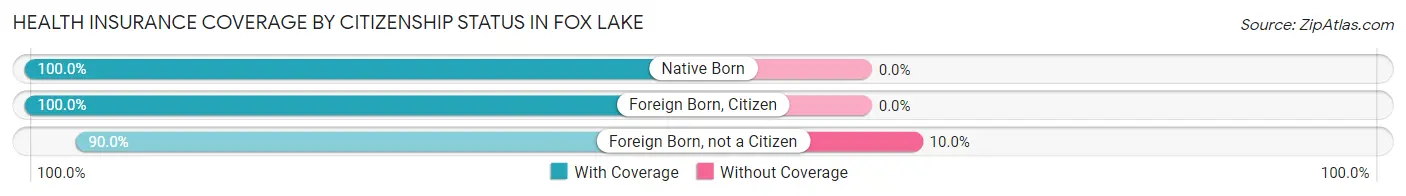
| Citizenship Status | With Coverage | Without Coverage |
| Native Born | 22 (100.0%) | 0 (0.0%) |
| Foreign Born, Citizen | 44 (100.0%) | 0 (0.0%) |
| Foreign Born, not a Citizen | 36 (90.0%) | 4 (10.0%) |
Health Insurance Coverage by Household Income in Fox Lake
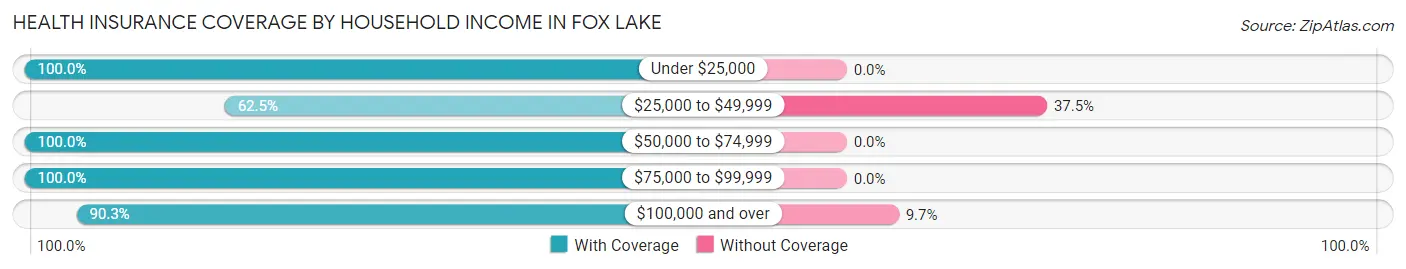
| Household Income | With Coverage | Without Coverage |
| Under $25,000 | 4 (100.0%) | 0 (0.0%) |
| $25,000 to $49,999 | 15 (62.5%) | 9 (37.5%) |
| $50,000 to $74,999 | 26 (100.0%) | 0 (0.0%) |
| $75,000 to $99,999 | 48 (100.0%) | 0 (0.0%) |
| $100,000 and over | 65 (90.3%) | 7 (9.7%) |
Public vs Private Health Insurance Coverage by Age in Fox Lake
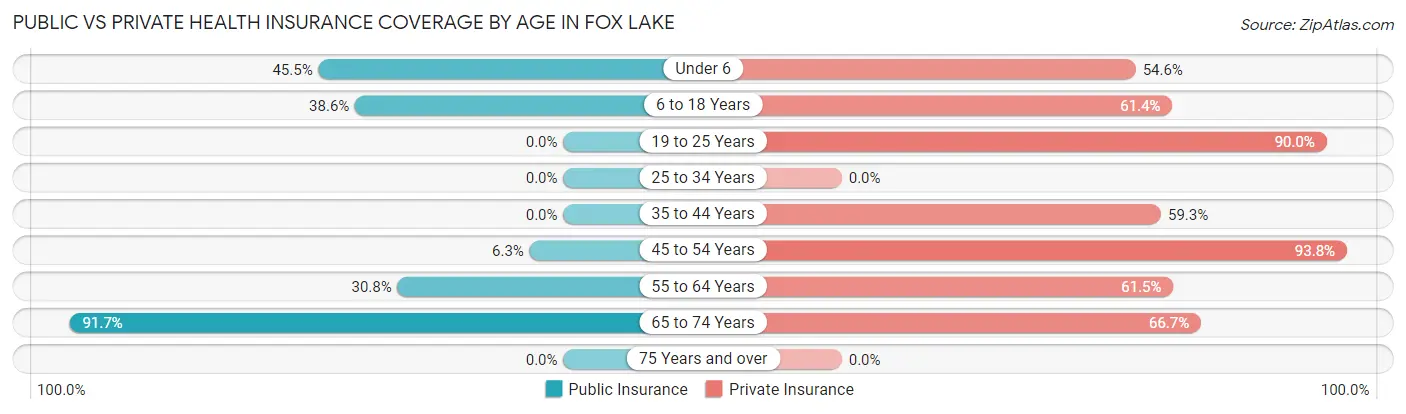
| Age Bracket | Public Insurance | Private Insurance |
| Under 6 | 10 (45.5%) | 12 (54.5%) |
| 6 to 18 Years | 17 (38.6%) | 27 (61.4%) |
| 19 to 25 Years | 0 (0.0%) | 36 (90.0%) |
| 25 to 34 Years | 0 (0.0%) | 0 (0.0%) |
| 35 to 44 Years | 0 (0.0%) | 16 (59.3%) |
| 45 to 54 Years | 1 (6.2%) | 15 (93.8%) |
| 55 to 64 Years | 4 (30.8%) | 8 (61.5%) |
| 65 to 74 Years | 11 (91.7%) | 8 (66.7%) |
| 75 Years and over | 0 (0.0%) | 0 (0.0%) |
| Total | 43 (24.7%) | 122 (70.1%) |
Disability Status by Sex by Age in Fox Lake
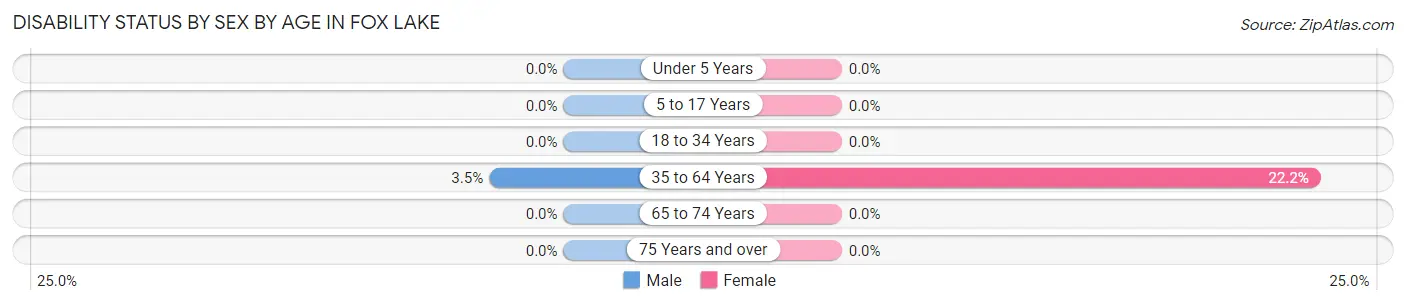
| Age Bracket | Male | Female |
| Under 5 Years | 0 (0.0%) | 0 (0.0%) |
| 5 to 17 Years | 0 (0.0%) | 0 (0.0%) |
| 18 to 34 Years | 0 (0.0%) | 0 (0.0%) |
| 35 to 64 Years | 1 (3.5%) | 6 (22.2%) |
| 65 to 74 Years | 0 (0.0%) | 0 (0.0%) |
| 75 Years and over | 0 (0.0%) | 0 (0.0%) |
Disability Class by Sex by Age in Fox Lake
Disability Class: Hearing Difficulty
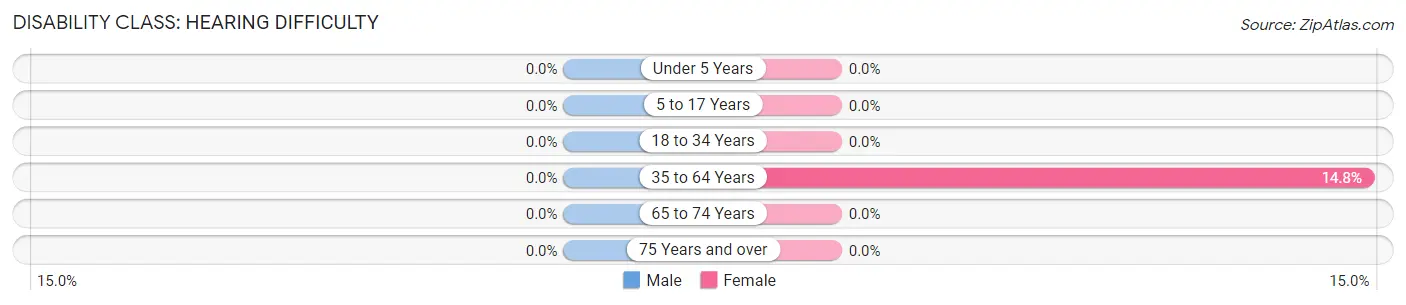
| Age Bracket | Male | Female |
| Under 5 Years | 0 (0.0%) | 0 (0.0%) |
| 5 to 17 Years | 0 (0.0%) | 0 (0.0%) |
| 18 to 34 Years | 0 (0.0%) | 0 (0.0%) |
| 35 to 64 Years | 0 (0.0%) | 4 (14.8%) |
| 65 to 74 Years | 0 (0.0%) | 0 (0.0%) |
| 75 Years and over | 0 (0.0%) | 0 (0.0%) |
Disability Class: Vision Difficulty
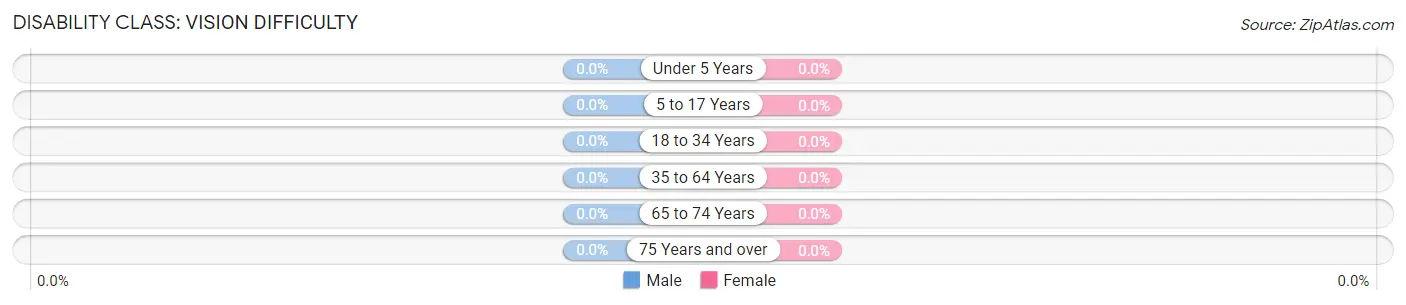
| Age Bracket | Male | Female |
| Under 5 Years | 0 (0.0%) | 0 (0.0%) |
| 5 to 17 Years | 0 (0.0%) | 0 (0.0%) |
| 18 to 34 Years | 0 (0.0%) | 0 (0.0%) |
| 35 to 64 Years | 0 (0.0%) | 0 (0.0%) |
| 65 to 74 Years | 0 (0.0%) | 0 (0.0%) |
| 75 Years and over | 0 (0.0%) | 0 (0.0%) |
Disability Class: Cognitive Difficulty

| Age Bracket | Male | Female |
| 5 to 17 Years | 0 (0.0%) | 0 (0.0%) |
| 18 to 34 Years | 0 (0.0%) | 0 (0.0%) |
| 35 to 64 Years | 1 (3.5%) | 2 (7.4%) |
| 65 to 74 Years | 0 (0.0%) | 0 (0.0%) |
| 75 Years and over | 0 (0.0%) | 0 (0.0%) |
Disability Class: Ambulatory Difficulty
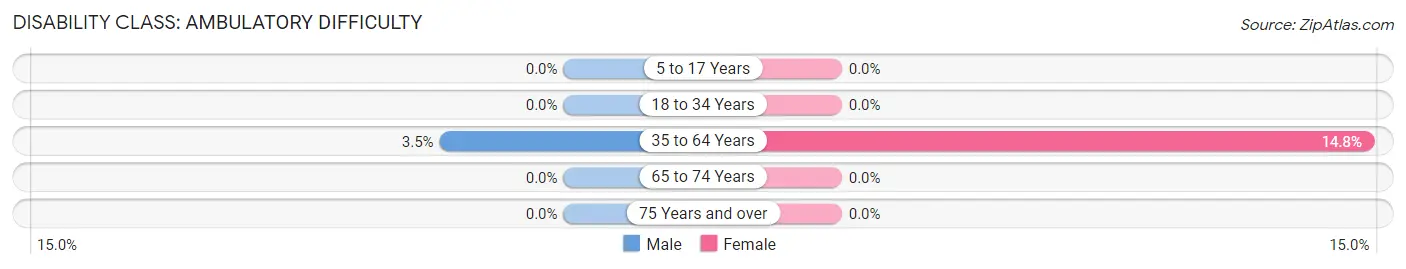
| Age Bracket | Male | Female |
| 5 to 17 Years | 0 (0.0%) | 0 (0.0%) |
| 18 to 34 Years | 0 (0.0%) | 0 (0.0%) |
| 35 to 64 Years | 1 (3.5%) | 4 (14.8%) |
| 65 to 74 Years | 0 (0.0%) | 0 (0.0%) |
| 75 Years and over | 0 (0.0%) | 0 (0.0%) |
Disability Class: Self-Care Difficulty
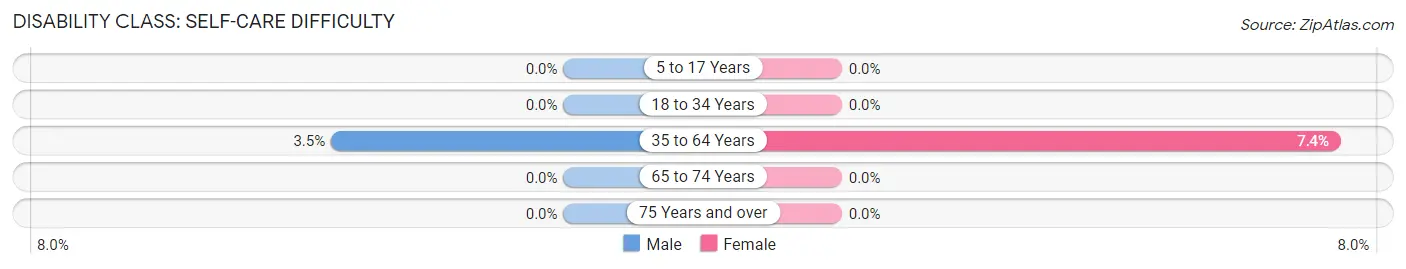
| Age Bracket | Male | Female |
| 5 to 17 Years | 0 (0.0%) | 0 (0.0%) |
| 18 to 34 Years | 0 (0.0%) | 0 (0.0%) |
| 35 to 64 Years | 1 (3.5%) | 2 (7.4%) |
| 65 to 74 Years | 0 (0.0%) | 0 (0.0%) |
| 75 Years and over | 0 (0.0%) | 0 (0.0%) |
Technology Access in Fox Lake
Computing Device Access in Fox Lake
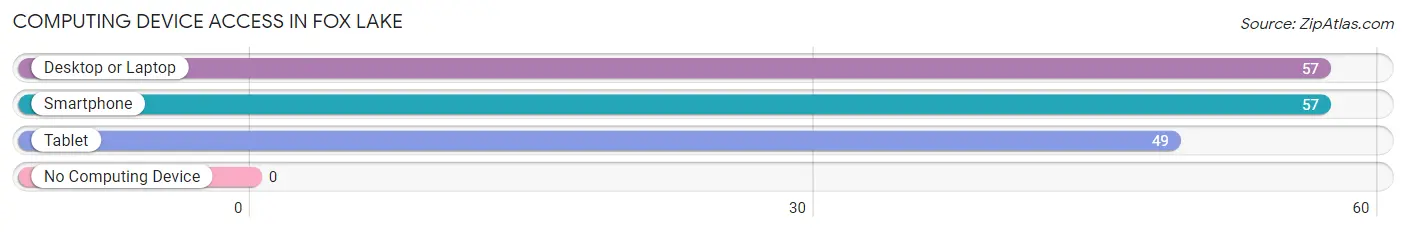
| Device Type | # Households | % Households |
| Desktop or Laptop | 57 | 96.6% |
| Smartphone | 57 | 96.6% |
| Tablet | 49 | 83.1% |
| No Computing Device | 0 | 0.0% |
| Total | 59 | 100.0% |
Internet Access in Fox Lake
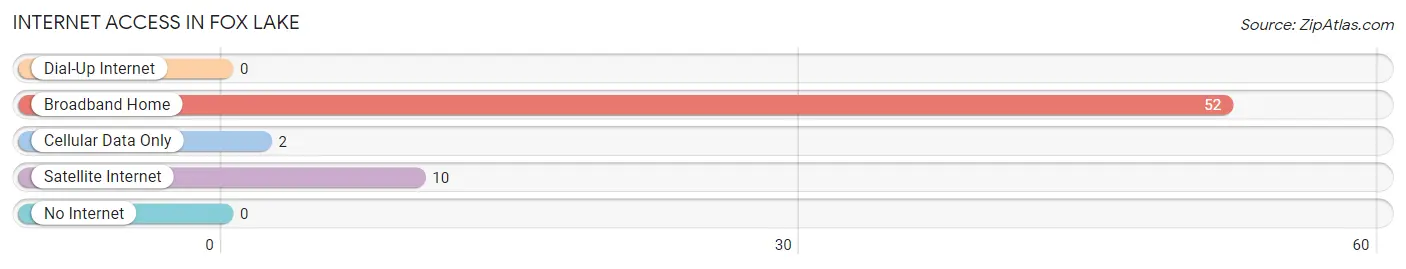
| Internet Type | # Households | % Households |
| Dial-Up Internet | 0 | 0.0% |
| Broadband Home | 52 | 88.1% |
| Cellular Data Only | 2 | 3.4% |
| Satellite Internet | 10 | 17.0% |
| No Internet | 0 | 0.0% |
| Total | 59 | 100.0% |
Fox Lake Summary
Fox Lake is a small unincorporated community located in the Flathead Valley of northwestern Montana. It is situated in the Flathead National Forest, approximately 25 miles south of Kalispell and 40 miles north of Whitefish. The community is located on the western shore of Fox Lake, a small lake that is part of the Flathead River drainage system.
History
The area around Fox Lake has been inhabited for thousands of years by the Kootenai and Salish tribes. The first European settlers arrived in the area in the late 1800s, and the community of Fox Lake was established in the early 1900s. The community was named after the lake, which was named after a local trapper, John Fox.
The area around Fox Lake was originally used for logging and mining, but in the early 1900s, the area began to be developed for recreational purposes. The first resort was built in the area in the 1920s, and the area quickly became a popular destination for fishing, camping, and other outdoor activities.
Geography
Fox Lake is located in the Flathead Valley of northwestern Montana. The community is situated on the western shore of Fox Lake, a small lake that is part of the Flathead River drainage system. The lake is approximately 1.5 miles long and 0.5 miles wide. The lake is surrounded by mountains, including the Mission Mountains to the east and the Swan Range to the west.
The area around Fox Lake is mostly forested, with a mix of coniferous and deciduous trees. The area is also home to a variety of wildlife, including deer, elk, moose, and bear.
Economy
The economy of Fox Lake is largely based on tourism. The area is a popular destination for fishing, camping, and other outdoor activities. There are several resorts and lodges in the area, as well as a number of restaurants and other businesses catering to tourists.
The area is also home to a number of small businesses, including a general store, a gas station, and a post office.
Demographics
As of the 2010 census, the population of Fox Lake was 545. The racial makeup of the community was 97.3% White, 0.2% African American, 0.7% Native American, 0.2% Asian, 0.2% from other races, and 1.6% from two or more races.
The median household income in Fox Lake was $37,500, and the median family income was $41,250. The per capita income was $19,890. About 11.3% of families and 14.2% of the population were below the poverty line.
Conclusion
Fox Lake is a small unincorporated community located in the Flathead Valley of northwestern Montana. It is situated on the western shore of Fox Lake, a small lake that is part of the Flathead River drainage system. The area is mostly forested, with a mix of coniferous and deciduous trees. The economy of Fox Lake is largely based on tourism, and the area is a popular destination for fishing, camping, and other outdoor activities. As of the 2010 census, the population of Fox Lake was 545. The median household income in Fox Lake was $37,500, and the median family income was $41,250.
Common Questions
What is Per Capita Income in Fox Lake?
Per Capita income in Fox Lake is $33,106.
What is the Median Family Income in Fox Lake?
Median Family Income in Fox Lake is $81,250.
What is the Median Household income in Fox Lake?
Median Household Income in Fox Lake is $127,557.
What is Inequality or Gini Index in Fox Lake?
Inequality or Gini Index in Fox Lake is 0.34.
What is the Total Population of Fox Lake?
Total Population of Fox Lake is 174.
What is the Total Male Population of Fox Lake?
Total Male Population of Fox Lake is 85.
What is the Total Female Population of Fox Lake?
Total Female Population of Fox Lake is 89.
What is the Ratio of Males per 100 Females in Fox Lake?
There are 95.51 Males per 100 Females in Fox Lake.
What is the Ratio of Females per 100 Males in Fox Lake?
There are 104.71 Females per 100 Males in Fox Lake.
What is the Median Population Age in Fox Lake?
Median Population Age in Fox Lake is 23.0 Years.
What is the Average Family Size in Fox Lake
Average Family Size in Fox Lake is 4.4 People.
What is the Average Household Size in Fox Lake
Average Household Size in Fox Lake is 3.0 People.
How Large is the Labor Force in Fox Lake?
There are 98 People in the Labor Forcein in Fox Lake.
What is the Percentage of People in the Labor Force in Fox Lake?
82.4% of People are in the Labor Force in Fox Lake.