Zip Codes with the Highest Percentage of Self-Employed / Not Incorporated in Iowa
RELATED REPORTS & OPTIONS
Self-Employed / Not Incorporated
Iowa
Compare Zip Codes
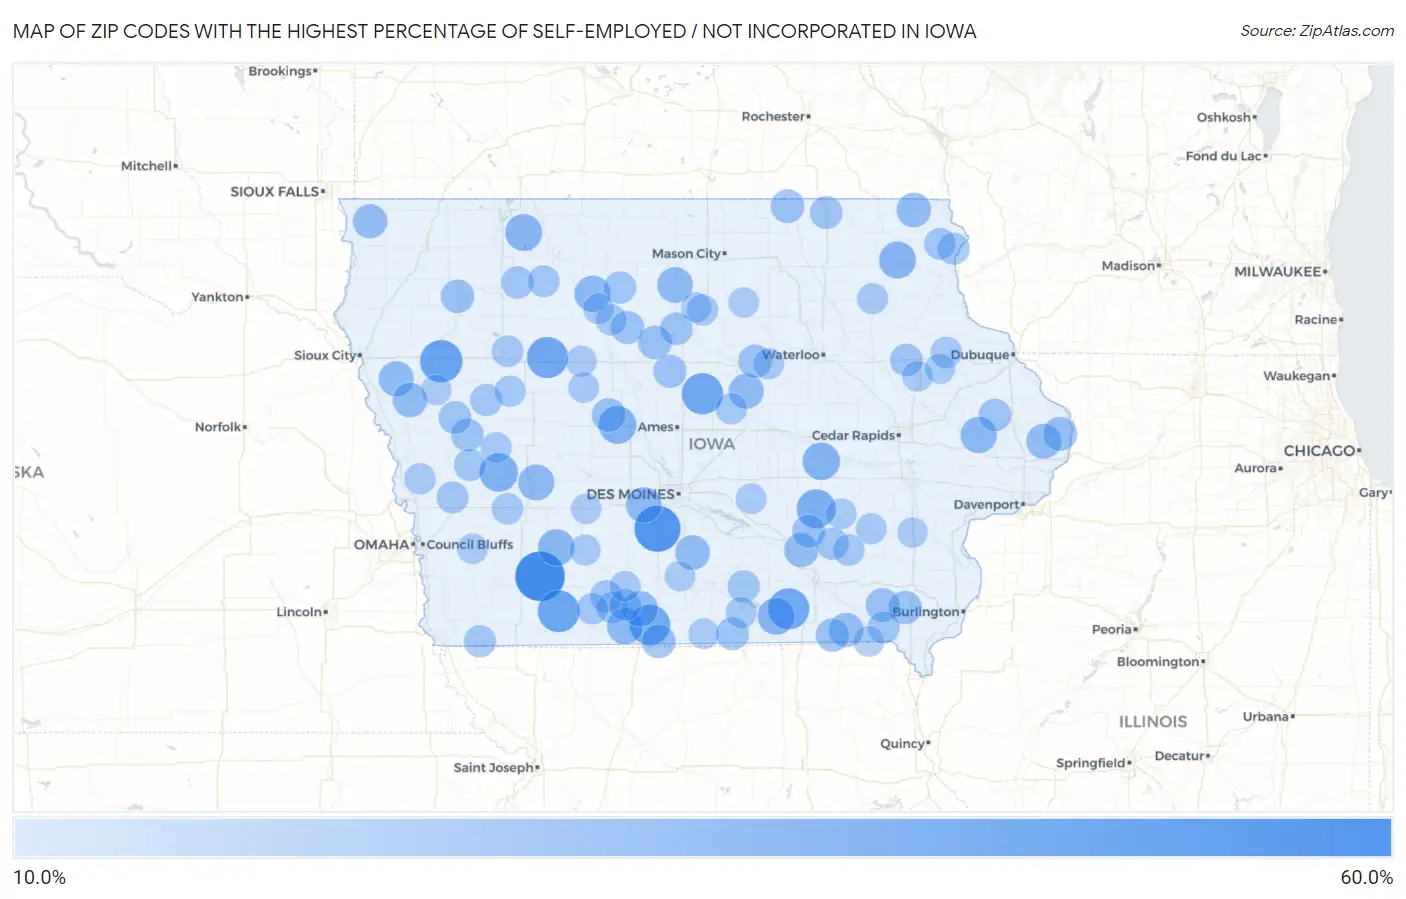
Map of Zip Codes with the Highest Percentage of Self-Employed / Not Incorporated in Iowa
10.0%
60.0%
Zip Codes with the Highest Percentage of Self-Employed / Not Incorporated in Iowa
| Zip Code | % Self-Employed / Not Incorporated | vs State | vs National | |
| 1. | 50839 | 57.1% | 6.3%(+50.8)#1 | 5.8%(+51.3)#155 |
| 2. | 50033 | 50.0% | 6.3%(+43.7)#2 | 5.8%(+44.2)#235 |
| 3. | 51018 | 42.6% | 6.3%(+36.3)#3 | 5.8%(+36.8)#347 |
| 4. | 50862 | 41.5% | 6.3%(+35.2)#4 | 5.8%(+35.7)#372 |
| 5. | 50102 | 40.4% | 6.3%(+34.0)#5 | 5.8%(+34.5)#399 |
| 6. | 50551 | 40.0% | 6.3%(+33.7)#6 | 5.8%(+34.2)#406 |
| 7. | 52594 | 39.8% | 6.3%(+33.5)#7 | 5.8%(+34.0)#411 |
| 8. | 50067 | 38.7% | 6.3%(+32.4)#8 | 5.8%(+32.9)#443 |
| 9. | 50104 | 35.5% | 6.3%(+29.1)#9 | 5.8%(+29.7)#547 |
| 10. | 51447 | 34.5% | 6.3%(+28.1)#10 | 5.8%(+28.7)#567 |
| 11. | 50031 | 33.3% | 6.3%(+27.0)#11 | 5.8%(+27.5)#612 |
| 12. | 52232 | 32.4% | 6.3%(+26.0)#12 | 5.8%(+26.6)#655 |
| 13. | 52593 | 31.6% | 6.3%(+25.3)#13 | 5.8%(+25.8)#689 |
| 14. | 52133 | 31.5% | 6.3%(+25.2)#14 | 5.8%(+25.7)#693 |
| 15. | 51364 | 31.5% | 6.3%(+25.2)#15 | 5.8%(+25.7)#695 |
| 16. | 50837 | 30.7% | 6.3%(+24.4)#16 | 5.8%(+24.9)#734 |
| 17. | 52323 | 30.3% | 6.3%(+23.9)#17 | 5.8%(+24.5)#755 |
| 18. | 50570 | 29.9% | 6.3%(+23.5)#18 | 5.8%(+24.0)#779 |
| 19. | 50133 | 29.8% | 6.3%(+23.5)#19 | 5.8%(+24.0)#780 |
| 20. | 50117 | 29.7% | 6.3%(+23.3)#20 | 5.8%(+23.9)#791 |
| 21. | 50439 | 29.1% | 6.3%(+22.7)#21 | 5.8%(+23.3)#822 |
| 22. | 50108 | 28.9% | 6.3%(+22.6)#22 | 5.8%(+23.1)#826 |
| 23. | 50038 | 28.8% | 6.3%(+22.5)#23 | 5.8%(+23.0)#833 |
| 24. | 51015 | 28.0% | 6.3%(+21.7)#24 | 5.8%(+22.2)#896 |
| 25. | 50269 | 27.9% | 6.3%(+21.6)#25 | 5.8%(+22.1)#898 |
| 26. | 52750 | 27.5% | 6.3%(+21.1)#26 | 5.8%(+21.7)#926 |
| 27. | 50145 | 27.3% | 6.3%(+20.9)#27 | 5.8%(+21.5)#946 |
| 28. | 52140 | 26.9% | 6.3%(+20.5)#28 | 5.8%(+21.1)#965 |
| 29. | 51051 | 26.7% | 6.3%(+20.3)#29 | 5.8%(+20.9)#993 |
| 30. | 52570 | 26.2% | 6.3%(+19.9)#30 | 5.8%(+20.4)#1,023 |
| 31. | 51230 | 26.2% | 6.3%(+19.9)#31 | 5.8%(+20.4)#1,024 |
| 32. | 52543 | 26.2% | 6.3%(+19.9)#32 | 5.8%(+20.4)#1,029 |
| 33. | 52701 | 25.6% | 6.3%(+19.3)#33 | 5.8%(+19.8)#1,085 |
| 34. | 50064 | 25.3% | 6.3%(+18.9)#34 | 5.8%(+19.4)#1,123 |
| 35. | 50599 | 25.1% | 6.3%(+18.8)#35 | 5.8%(+19.3)#1,136 |
| 36. | 52651 | 25.0% | 6.3%(+18.7)#36 | 5.8%(+19.2)#1,143 |
| 37. | 50065 | 24.9% | 6.3%(+18.6)#37 | 5.8%(+19.1)#1,163 |
| 38. | 50455 | 24.9% | 6.3%(+18.5)#38 | 5.8%(+19.0)#1,169 |
| 39. | 51029 | 24.7% | 6.3%(+18.3)#39 | 5.8%(+18.9)#1,187 |
| 40. | 52584 | 24.6% | 6.3%(+18.2)#40 | 5.8%(+18.8)#1,197 |
| 41. | 52649 | 24.5% | 6.3%(+18.2)#41 | 5.8%(+18.7)#1,205 |
| 42. | 50680 | 24.4% | 6.3%(+18.1)#42 | 5.8%(+18.6)#1,218 |
| 43. | 50591 | 24.0% | 6.3%(+17.7)#43 | 5.8%(+18.2)#1,249 |
| 44. | 52586 | 23.9% | 6.3%(+17.6)#44 | 5.8%(+18.1)#1,262 |
| 45. | 50132 | 23.8% | 6.3%(+17.5)#45 | 5.8%(+18.0)#1,270 |
| 46. | 52590 | 23.4% | 6.3%(+17.1)#46 | 5.8%(+17.6)#1,317 |
| 47. | 52155 | 23.3% | 6.3%(+16.9)#47 | 5.8%(+17.5)#1,325 |
| 48. | 51520 | 23.1% | 6.3%(+16.7)#48 | 5.8%(+17.3)#1,342 |
| 49. | 51439 | 23.1% | 6.3%(+16.7)#49 | 5.8%(+17.2)#1,350 |
| 50. | 52207 | 22.9% | 6.3%(+16.6)#50 | 5.8%(+17.1)#1,364 |
| 51. | 50101 | 22.9% | 6.3%(+16.5)#51 | 5.8%(+17.0)#1,371 |
| 52. | 50654 | 22.8% | 6.3%(+16.4)#52 | 5.8%(+17.0)#1,382 |
| 53. | 51366 | 22.7% | 6.3%(+16.3)#53 | 5.8%(+16.8)#1,396 |
| 54. | 50560 | 22.3% | 6.3%(+15.9)#54 | 5.8%(+16.4)#1,438 |
| 55. | 52562 | 22.2% | 6.3%(+15.9)#55 | 5.8%(+16.4)#1,450 |
| 56. | 50861 | 22.0% | 6.3%(+15.7)#56 | 5.8%(+16.2)#1,475 |
| 57. | 51530 | 21.9% | 6.3%(+15.6)#57 | 5.8%(+16.1)#1,483 |
| 58. | 51647 | 21.9% | 6.3%(+15.6)#58 | 5.8%(+16.1)#1,485 |
| 59. | 52569 | 21.9% | 6.3%(+15.6)#59 | 5.8%(+16.1)#1,487 |
| 60. | 51448 | 21.9% | 6.3%(+15.6)#60 | 5.8%(+16.1)#1,495 |
| 61. | 52620 | 21.7% | 6.3%(+15.4)#61 | 5.8%(+15.9)#1,521 |
| 62. | 52146 | 21.7% | 6.3%(+15.4)#62 | 5.8%(+15.9)#1,525 |
| 63. | 51563 | 21.6% | 6.3%(+15.3)#63 | 5.8%(+15.8)#1,537 |
| 64. | 50863 | 21.5% | 6.3%(+15.2)#64 | 5.8%(+15.7)#1,559 |
| 65. | 52170 | 21.4% | 6.3%(+15.0)#65 | 5.8%(+15.5)#1,584 |
| 66. | 50074 | 21.3% | 6.3%(+15.0)#66 | 5.8%(+15.5)#1,585 |
| 67. | 50527 | 21.3% | 6.3%(+14.9)#67 | 5.8%(+15.5)#1,598 |
| 68. | 50567 | 21.2% | 6.3%(+14.8)#68 | 5.8%(+15.4)#1,613 |
| 69. | 51552 | 20.9% | 6.3%(+14.6)#69 | 5.8%(+15.1)#1,660 |
| 70. | 52576 | 20.8% | 6.3%(+14.5)#70 | 5.8%(+15.0)#1,668 |
| 71. | 50845 | 20.8% | 6.3%(+14.4)#71 | 5.8%(+15.0)#1,680 |
| 72. | 52041 | 20.6% | 6.3%(+14.3)#72 | 5.8%(+14.8)#1,705 |
| 73. | 50051 | 20.4% | 6.3%(+14.1)#73 | 5.8%(+14.6)#1,735 |
| 74. | 51466 | 20.4% | 6.3%(+14.1)#74 | 5.8%(+14.6)#1,740 |
| 75. | 52581 | 20.3% | 6.3%(+14.0)#75 | 5.8%(+14.5)#1,752 |
| 76. | 51550 | 20.3% | 6.3%(+13.9)#76 | 5.8%(+14.5)#1,761 |
| 77. | 50452 | 20.2% | 6.3%(+13.8)#77 | 5.8%(+14.4)#1,777 |
| 78. | 50529 | 20.0% | 6.3%(+13.6)#78 | 5.8%(+14.1)#1,836 |
| 79. | 52164 | 19.8% | 6.3%(+13.5)#79 | 5.8%(+14.0)#1,857 |
| 80. | 52248 | 19.7% | 6.3%(+13.4)#80 | 5.8%(+13.9)#1,873 |
| 81. | 50642 | 19.7% | 6.3%(+13.3)#81 | 5.8%(+13.8)#1,886 |
| 82. | 50582 | 19.6% | 6.3%(+13.3)#82 | 5.8%(+13.8)#1,892 |
| 83. | 50858 | 19.6% | 6.3%(+13.3)#83 | 5.8%(+13.8)#1,898 |
| 84. | 51454 | 19.6% | 6.3%(+13.3)#84 | 5.8%(+13.8)#1,902 |
| 85. | 50552 | 19.6% | 6.3%(+13.2)#85 | 5.8%(+13.7)#1,907 |
| 86. | 52355 | 19.4% | 6.3%(+13.1)#86 | 5.8%(+13.6)#1,933 |
| 87. | 52573 | 19.4% | 6.3%(+13.1)#87 | 5.8%(+13.6)#1,934 |
| 88. | 50232 | 19.3% | 6.3%(+12.9)#88 | 5.8%(+13.5)#1,955 |
| 89. | 50254 | 19.2% | 6.3%(+12.9)#89 | 5.8%(+13.4)#1,965 |
| 90. | 52330 | 19.1% | 6.3%(+12.8)#90 | 5.8%(+13.3)#2,003 |
| 91. | 50538 | 19.0% | 6.3%(+12.7)#91 | 5.8%(+13.2)#2,018 |
| 92. | 50008 | 19.0% | 6.3%(+12.7)#92 | 5.8%(+13.2)#2,026 |
| 93. | 51525 | 18.9% | 6.3%(+12.6)#93 | 5.8%(+13.1)#2,058 |
| 94. | 51019 | 18.9% | 6.3%(+12.6)#94 | 5.8%(+13.1)#2,062 |
| 95. | 50605 | 18.9% | 6.3%(+12.5)#95 | 5.8%(+13.1)#2,070 |
| 96. | 50164 | 18.8% | 6.3%(+12.5)#96 | 5.8%(+13.0)#2,086 |
| 97. | 50420 | 18.7% | 6.3%(+12.4)#97 | 5.8%(+12.9)#2,108 |
| 98. | 52223 | 18.7% | 6.3%(+12.4)#98 | 5.8%(+12.9)#2,113 |
| 99. | 50275 | 18.6% | 6.3%(+12.3)#99 | 5.8%(+12.8)#2,134 |
| 100. | 52201 | 18.5% | 6.3%(+12.2)#100 | 5.8%(+12.7)#2,161 |
Common Questions
What are the Top 10 Zip Codes with the Highest Percentage of Self-Employed / Not Incorporated in Iowa?
Top 10 Zip Codes with the Highest Percentage of Self-Employed / Not Incorporated in Iowa are:
What zip code has the Highest Percentage of Self-Employed / Not Incorporated in Iowa?
50839 has the Highest Percentage of Self-Employed / Not Incorporated in Iowa with 57.1%.
What is the Percentage of Self-Employed / Not Incorporated in the State of Iowa?
Percentage of Self-Employed / Not Incorporated in Iowa is 6.3%.
What is the Percentage of Self-Employed / Not Incorporated in the United States?
Percentage of Self-Employed / Not Incorporated in the United States is 5.8%.