Zip Codes with the Highest Percentage of Population Employed in Education Instruction & Library in Iowa
RELATED REPORTS & OPTIONS
Education Instruction & Library
Iowa
Compare Zip Codes
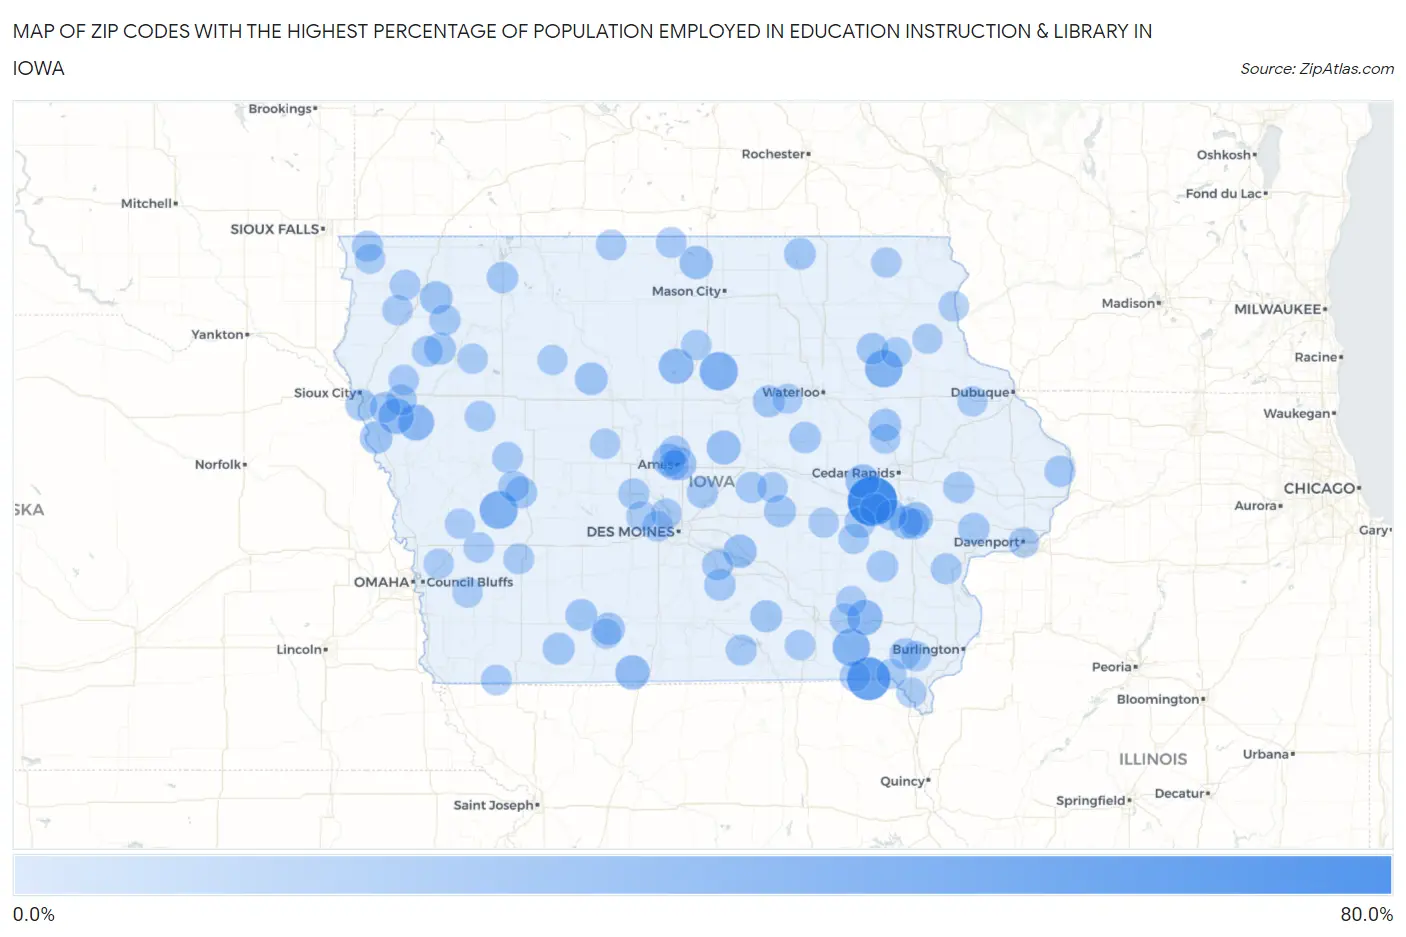
Map of Zip Codes with the Highest Percentage of Population Employed in Education Instruction & Library in Iowa
0.0%
80.0%
Zip Codes with the Highest Percentage of Population Employed in Education Instruction & Library in Iowa
| Zip Code | % Employed | vs State | vs National | |
| 1. | 52307 | 64.6% | 6.5%(+58.1)#1 | 6.2%(+58.4)#33 |
| 2. | 52573 | 45.6% | 6.5%(+39.1)#2 | 6.2%(+39.4)#94 |
| 3. | 50041 | 31.7% | 6.5%(+25.3)#3 | 6.2%(+25.6)#236 |
| 4. | 51447 | 31.0% | 6.5%(+24.6)#4 | 6.2%(+24.9)#251 |
| 5. | 50671 | 29.5% | 6.5%(+23.1)#5 | 6.2%(+23.4)#269 |
| 6. | 52551 | 29.0% | 6.5%(+22.6)#6 | 6.2%(+22.8)#273 |
| 7. | 51044 | 25.0% | 6.5%(+18.5)#7 | 6.2%(+18.8)#365 |
| 8. | 51015 | 24.0% | 6.5%(+17.5)#8 | 6.2%(+17.8)#411 |
| 9. | 52557 | 23.4% | 6.5%(+16.9)#9 | 6.2%(+17.2)#446 |
| 10. | 50101 | 22.9% | 6.5%(+16.4)#10 | 6.2%(+16.7)#474 |
| 11. | 50140 | 21.4% | 6.5%(+14.9)#11 | 6.2%(+15.2)#547 |
| 12. | 50239 | 19.7% | 6.5%(+13.3)#12 | 6.2%(+13.5)#672 |
| 13. | 52354 | 19.6% | 6.5%(+13.1)#13 | 6.2%(+13.4)#687 |
| 14. | 50446 | 18.0% | 6.5%(+11.6)#14 | 6.2%(+11.8)#838 |
| 15. | 52245 | 17.9% | 6.5%(+11.4)#15 | 6.2%(+11.7)#852 |
| 16. | 50214 | 17.7% | 6.5%(+11.2)#16 | 6.2%(+11.5)#876 |
| 17. | 52246 | 17.3% | 6.5%(+10.8)#17 | 6.2%(+11.1)#916 |
| 18. | 51231 | 16.5% | 6.5%(+10.1)#18 | 6.2%(+10.3)#1,022 |
| 19. | 50524 | 16.5% | 6.5%(+10.0)#19 | 6.2%(+10.3)#1,032 |
| 20. | 50010 | 16.4% | 6.5%(+9.95)#20 | 6.2%(+10.2)#1,039 |
| 21. | 51055 | 16.2% | 6.5%(+9.75)#21 | 6.2%(+10.0)#1,065 |
| 22. | 50014 | 15.9% | 6.5%(+9.42)#22 | 6.2%(+9.69)#1,119 |
| 23. | 50831 | 15.4% | 6.5%(+8.93)#23 | 6.2%(+9.20)#1,219 |
| 24. | 52352 | 15.1% | 6.5%(+8.67)#24 | 6.2%(+8.94)#1,260 |
| 25. | 50112 | 14.4% | 6.5%(+7.90)#25 | 6.2%(+8.17)#1,432 |
| 26. | 50862 | 14.3% | 6.5%(+7.83)#26 | 6.2%(+8.10)#1,461 |
| 27. | 52531 | 14.3% | 6.5%(+7.82)#27 | 6.2%(+8.09)#1,467 |
| 28. | 51014 | 14.2% | 6.5%(+7.79)#28 | 6.2%(+8.06)#1,472 |
| 29. | 50642 | 14.1% | 6.5%(+7.64)#29 | 6.2%(+7.91)#1,520 |
| 30. | 50842 | 13.8% | 6.5%(+7.34)#30 | 6.2%(+7.61)#1,620 |
| 31. | 50466 | 13.6% | 6.5%(+7.12)#31 | 6.2%(+7.39)#1,687 |
| 32. | 51111 | 13.6% | 6.5%(+7.11)#32 | 6.2%(+7.38)#1,693 |
| 33. | 50655 | 13.3% | 6.5%(+6.90)#33 | 6.2%(+7.17)#1,763 |
| 34. | 50110 | 13.3% | 6.5%(+6.88)#34 | 6.2%(+7.15)#1,779 |
| 35. | 52778 | 13.2% | 6.5%(+6.74)#35 | 6.2%(+7.01)#1,830 |
| 36. | 50675 | 13.1% | 6.5%(+6.66)#36 | 6.2%(+6.93)#1,857 |
| 37. | 50062 | 12.9% | 6.5%(+6.48)#37 | 6.2%(+6.75)#1,932 |
| 38. | 52359 | 12.7% | 6.5%(+6.22)#38 | 6.2%(+6.49)#2,034 |
| 39. | 51340 | 12.7% | 6.5%(+6.22)#39 | 6.2%(+6.49)#2,036 |
| 40. | 52701 | 12.2% | 6.5%(+5.74)#40 | 6.2%(+6.01)#2,287 |
| 41. | 50161 | 12.1% | 6.5%(+5.67)#41 | 6.2%(+5.94)#2,321 |
| 42. | 52337 | 12.1% | 6.5%(+5.65)#42 | 6.2%(+5.92)#2,334 |
| 43. | 51046 | 11.9% | 6.5%(+5.50)#43 | 6.2%(+5.76)#2,415 |
| 44. | 50141 | 11.7% | 6.5%(+5.26)#44 | 6.2%(+5.53)#2,562 |
| 45. | 51039 | 11.7% | 6.5%(+5.23)#45 | 6.2%(+5.50)#2,582 |
| 46. | 52240 | 11.6% | 6.5%(+5.13)#46 | 6.2%(+5.40)#2,645 |
| 47. | 52631 | 11.5% | 6.5%(+5.09)#47 | 6.2%(+5.36)#2,671 |
| 48. | 50225 | 11.4% | 6.5%(+4.96)#48 | 6.2%(+5.23)#2,771 |
| 49. | 52581 | 11.4% | 6.5%(+4.93)#49 | 6.2%(+5.20)#2,801 |
| 50. | 51242 | 11.3% | 6.5%(+4.84)#50 | 6.2%(+5.11)#2,854 |
| 51. | 52361 | 11.3% | 6.5%(+4.82)#51 | 6.2%(+5.09)#2,875 |
| 52. | 51467 | 11.3% | 6.5%(+4.80)#52 | 6.2%(+5.07)#2,887 |
| 53. | 52754 | 11.2% | 6.5%(+4.79)#53 | 6.2%(+5.06)#2,895 |
| 54. | 52322 | 11.2% | 6.5%(+4.74)#54 | 6.2%(+5.01)#2,915 |
| 55. | 50039 | 11.2% | 6.5%(+4.74)#55 | 6.2%(+5.01)#2,920 |
| 56. | 51035 | 11.1% | 6.5%(+4.70)#56 | 6.2%(+4.96)#2,947 |
| 57. | 51007 | 11.1% | 6.5%(+4.69)#57 | 6.2%(+4.96)#2,949 |
| 58. | 51455 | 11.1% | 6.5%(+4.66)#58 | 6.2%(+4.93)#2,969 |
| 59. | 50022 | 11.0% | 6.5%(+4.58)#59 | 6.2%(+4.85)#3,039 |
| 60. | 50105 | 11.0% | 6.5%(+4.53)#60 | 6.2%(+4.80)#3,068 |
| 61. | 52542 | 10.8% | 6.5%(+4.37)#61 | 6.2%(+4.64)#3,187 |
| 62. | 50473 | 10.8% | 6.5%(+4.33)#62 | 6.2%(+4.60)#3,217 |
| 63. | 51630 | 10.8% | 6.5%(+4.33)#63 | 6.2%(+4.60)#3,218 |
| 64. | 51431 | 10.7% | 6.5%(+4.20)#64 | 6.2%(+4.47)#3,313 |
| 65. | 51521 | 10.6% | 6.5%(+4.17)#65 | 6.2%(+4.44)#3,341 |
| 66. | 52533 | 10.6% | 6.5%(+4.15)#66 | 6.2%(+4.42)#3,358 |
| 67. | 52801 | 10.6% | 6.5%(+4.14)#67 | 6.2%(+4.40)#3,373 |
| 68. | 50325 | 10.6% | 6.5%(+4.10)#68 | 6.2%(+4.37)#3,409 |
| 69. | 50131 | 10.5% | 6.5%(+4.09)#69 | 6.2%(+4.36)#3,417 |
| 70. | 52236 | 10.5% | 6.5%(+4.04)#70 | 6.2%(+4.31)#3,465 |
| 71. | 51234 | 10.4% | 6.5%(+3.97)#71 | 6.2%(+4.24)#3,534 |
| 72. | 50106 | 10.3% | 6.5%(+3.87)#72 | 6.2%(+4.14)#3,622 |
| 73. | 51041 | 10.3% | 6.5%(+3.86)#73 | 6.2%(+4.13)#3,632 |
| 74. | 50012 | 10.2% | 6.5%(+3.73)#74 | 6.2%(+3.99)#3,756 |
| 75. | 50556 | 10.2% | 6.5%(+3.72)#75 | 6.2%(+3.99)#3,764 |
| 76. | 52316 | 10.1% | 6.5%(+3.66)#76 | 6.2%(+3.93)#3,816 |
| 77. | 50606 | 10.1% | 6.5%(+3.65)#77 | 6.2%(+3.92)#3,824 |
| 78. | 51028 | 10.1% | 6.5%(+3.63)#78 | 6.2%(+3.90)#3,841 |
| 79. | 52552 | 10.1% | 6.5%(+3.61)#79 | 6.2%(+3.87)#3,872 |
| 80. | 51005 | 10.0% | 6.5%(+3.55)#80 | 6.2%(+3.82)#3,916 |
| 81. | 51549 | 10.0% | 6.5%(+3.50)#81 | 6.2%(+3.77)#3,989 |
| 82. | 50420 | 9.9% | 6.5%(+3.49)#82 | 6.2%(+3.76)#4,000 |
| 83. | 52158 | 9.9% | 6.5%(+3.49)#83 | 6.2%(+3.75)#4,007 |
| 84. | 52580 | 9.9% | 6.5%(+3.48)#84 | 6.2%(+3.75)#4,012 |
| 85. | 50861 | 9.9% | 6.5%(+3.42)#85 | 6.2%(+3.69)#4,085 |
| 86. | 52657 | 9.8% | 6.5%(+3.30)#86 | 6.2%(+3.57)#4,219 |
| 87. | 52619 | 9.7% | 6.5%(+3.21)#87 | 6.2%(+3.48)#4,321 |
| 88. | 51565 | 9.7% | 6.5%(+3.21)#88 | 6.2%(+3.48)#4,322 |
| 89. | 50063 | 9.7% | 6.5%(+3.21)#89 | 6.2%(+3.48)#4,327 |
| 90. | 52626 | 9.6% | 6.5%(+3.16)#90 | 6.2%(+3.42)#4,393 |
| 91. | 52221 | 9.6% | 6.5%(+3.15)#91 | 6.2%(+3.42)#4,397 |
| 92. | 52101 | 9.6% | 6.5%(+3.11)#92 | 6.2%(+3.37)#4,460 |
| 93. | 52043 | 9.5% | 6.5%(+3.07)#93 | 6.2%(+3.34)#4,494 |
| 94. | 50217 | 9.5% | 6.5%(+3.07)#94 | 6.2%(+3.34)#4,496 |
| 95. | 52046 | 9.5% | 6.5%(+3.06)#95 | 6.2%(+3.33)#4,512 |
| 96. | 50574 | 9.5% | 6.5%(+3.01)#96 | 6.2%(+3.28)#4,563 |
| 97. | 51576 | 9.4% | 6.5%(+2.99)#97 | 6.2%(+3.26)#4,585 |
| 98. | 51230 | 9.4% | 6.5%(+2.99)#98 | 6.2%(+3.26)#4,592 |
| 99. | 50624 | 9.4% | 6.5%(+2.97)#99 | 6.2%(+3.24)#4,617 |
| 100. | 52213 | 9.4% | 6.5%(+2.95)#100 | 6.2%(+3.22)#4,647 |
Common Questions
What are the Top 10 Zip Codes with the Highest Percentage of Population Employed in Education Instruction & Library in Iowa?
Top 10 Zip Codes with the Highest Percentage of Population Employed in Education Instruction & Library in Iowa are:
What zip code has the Highest Percentage of Population Employed in Education Instruction & Library in Iowa?
52307 has the Highest Percentage of Population Employed in Education Instruction & Library in Iowa with 64.6%.
What is the Percentage of Population Employed in Education Instruction & Library in the State of Iowa?
Percentage of Population Employed in Education Instruction & Library in Iowa is 6.5%.
What is the Percentage of Population Employed in Education Instruction & Library in the United States?
Percentage of Population Employed in Education Instruction & Library in the United States is 6.2%.