Zip Codes with the Highest Male Poverty Level in Iowa
RELATED REPORTS & OPTIONS
Highest Poverty | Male
Iowa
Compare Zip Codes
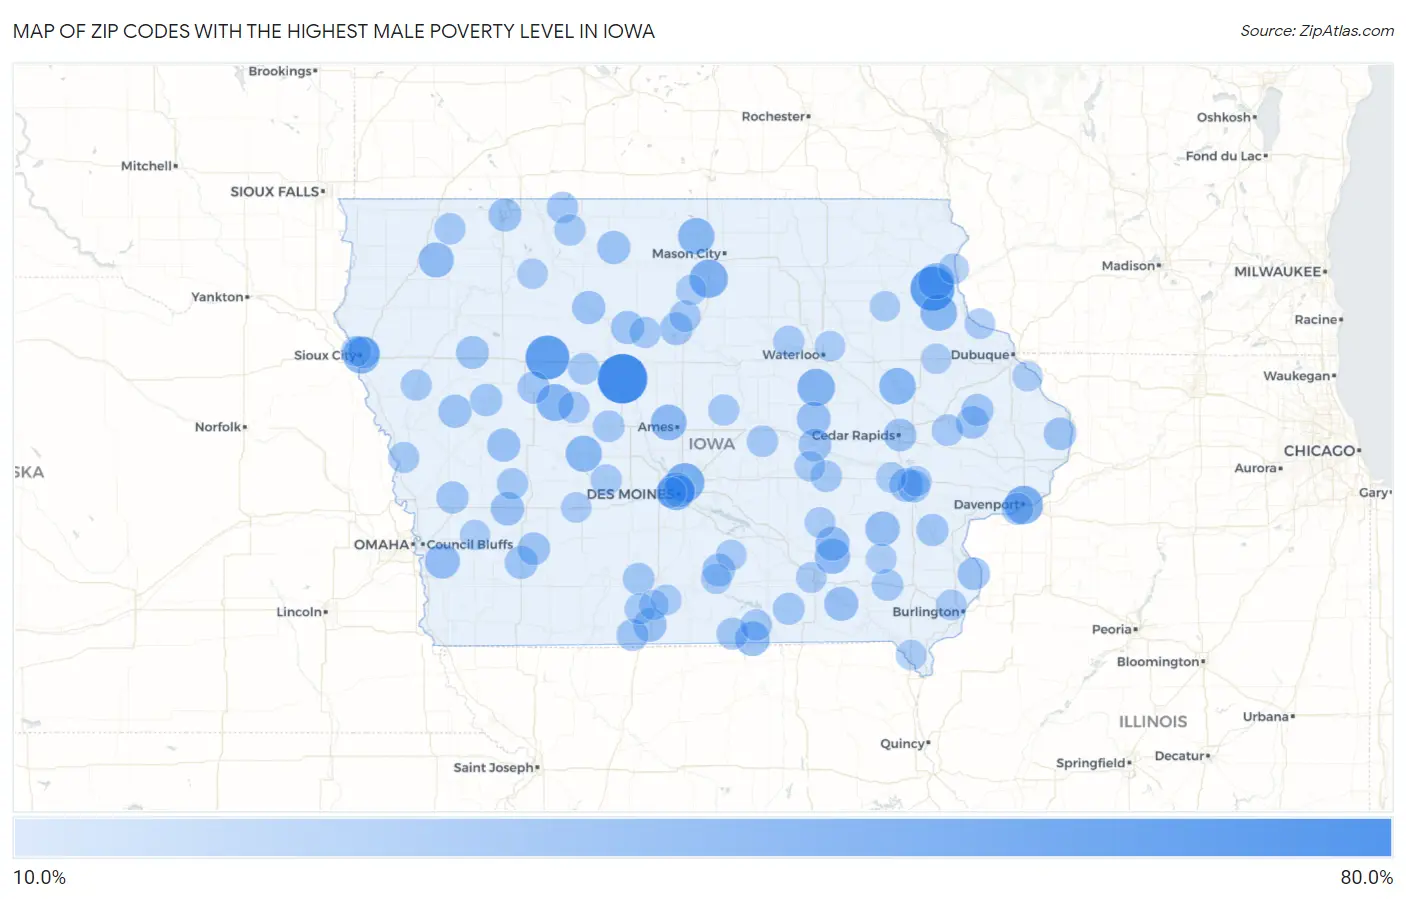
Map of Zip Codes with the Highest Male Poverty Level in Iowa
10.0%
80.0%
Zip Codes with the Highest Male Poverty Level in Iowa
| Zip Code | Male Poverty | vs State | vs National | |
| 1. | 50521 | 76.5% | 10.0%(+66.5)#1 | 11.3%(+65.1)#166 |
| 2. | 52072 | 59.3% | 10.0%(+49.3)#2 | 11.3%(+48.0)#322 |
| 3. | 50551 | 58.8% | 10.0%(+48.9)#3 | 11.3%(+47.5)#335 |
| 4. | 50032 | 43.3% | 10.0%(+33.3)#4 | 11.3%(+32.0)#805 |
| 5. | 52801 | 42.1% | 10.0%(+32.1)#5 | 11.3%(+30.7)#869 |
| 6. | 50477 | 41.5% | 10.0%(+31.5)#6 | 11.3%(+30.1)#899 |
| 7. | 50314 | 40.1% | 10.0%(+30.1)#7 | 11.3%(+28.8)#986 |
| 8. | 50612 | 39.3% | 10.0%(+29.3)#8 | 11.3%(+28.0)#1,039 |
| 9. | 51101 | 37.9% | 10.0%(+27.9)#9 | 11.3%(+26.6)#1,117 |
| 10. | 51451 | 37.5% | 10.0%(+27.5)#10 | 11.3%(+26.2)#1,146 |
| 11. | 52044 | 36.7% | 10.0%(+26.7)#11 | 11.3%(+25.3)#1,217 |
| 12. | 52344 | 36.1% | 10.0%(+26.1)#12 | 11.3%(+24.8)#1,272 |
| 13. | 50434 | 36.1% | 10.0%(+26.1)#13 | 11.3%(+24.7)#1,278 |
| 14. | 52047 | 35.5% | 10.0%(+25.5)#14 | 11.3%(+24.2)#1,330 |
| 15. | 50026 | 35.2% | 10.0%(+25.2)#15 | 11.3%(+23.8)#1,357 |
| 16. | 50014 | 34.1% | 10.0%(+24.1)#16 | 11.3%(+22.7)#1,481 |
| 17. | 52568 | 32.5% | 10.0%(+22.5)#17 | 11.3%(+21.2)#1,707 |
| 18. | 51231 | 31.9% | 10.0%(+22.0)#18 | 11.3%(+20.6)#1,776 |
| 19. | 51554 | 31.0% | 10.0%(+21.0)#19 | 11.3%(+19.6)#1,930 |
| 20. | 52549 | 30.4% | 10.0%(+20.4)#20 | 11.3%(+19.1)#2,023 |
| 21. | 52359 | 30.1% | 10.0%(+20.1)#21 | 11.3%(+18.8)#2,081 |
| 22. | 52562 | 29.0% | 10.0%(+19.1)#22 | 11.3%(+17.7)#2,281 |
| 23. | 52588 | 28.9% | 10.0%(+19.0)#23 | 11.3%(+17.6)#2,297 |
| 24. | 52217 | 28.3% | 10.0%(+18.3)#24 | 11.3%(+16.9)#2,443 |
| 25. | 52246 | 27.3% | 10.0%(+17.3)#25 | 11.3%(+16.0)#2,682 |
| 26. | 51552 | 27.1% | 10.0%(+17.2)#26 | 11.3%(+15.8)#2,724 |
| 27. | 50067 | 26.9% | 10.0%(+17.0)#27 | 11.3%(+15.6)#2,765 |
| 28. | 51432 | 26.7% | 10.0%(+16.7)#28 | 11.3%(+15.3)#2,823 |
| 29. | 50522 | 26.5% | 10.0%(+16.5)#29 | 11.3%(+15.1)#2,861 |
| 30. | 51460 | 26.3% | 10.0%(+16.3)#30 | 11.3%(+15.0)#2,903 |
| 31. | 50520 | 26.3% | 10.0%(+16.3)#31 | 11.3%(+14.9)#2,911 |
| 32. | 50591 | 26.3% | 10.0%(+16.3)#32 | 11.3%(+14.9)#2,918 |
| 33. | 50847 | 25.7% | 10.0%(+15.7)#33 | 11.3%(+14.4)#3,056 |
| 34. | 51020 | 25.5% | 10.0%(+15.5)#34 | 11.3%(+14.2)#3,109 |
| 35. | 51355 | 25.5% | 10.0%(+15.5)#35 | 11.3%(+14.2)#3,110 |
| 36. | 50843 | 25.0% | 10.0%(+15.0)#36 | 11.3%(+13.7)#3,242 |
| 37. | 50272 | 25.0% | 10.0%(+15.0)#37 | 11.3%(+13.7)#3,250 |
| 38. | 50101 | 25.0% | 10.0%(+15.0)#38 | 11.3%(+13.7)#3,254 |
| 39. | 52215 | 24.9% | 10.0%(+14.9)#39 | 11.3%(+13.6)#3,279 |
| 40. | 52362 | 24.9% | 10.0%(+14.9)#40 | 11.3%(+13.5)#3,287 |
| 41. | 52401 | 24.7% | 10.0%(+14.7)#41 | 11.3%(+13.3)#3,332 |
| 42. | 52701 | 24.4% | 10.0%(+14.5)#42 | 11.3%(+13.1)#3,394 |
| 43. | 52646 | 24.4% | 10.0%(+14.4)#43 | 11.3%(+13.0)#3,408 |
| 44. | 52240 | 24.2% | 10.0%(+14.2)#44 | 11.3%(+12.8)#3,479 |
| 45. | 51448 | 24.1% | 10.0%(+14.1)#45 | 11.3%(+12.7)#3,517 |
| 46. | 51433 | 23.7% | 10.0%(+13.7)#46 | 11.3%(+12.3)#3,650 |
| 47. | 51563 | 23.5% | 10.0%(+13.6)#47 | 11.3%(+12.2)#3,693 |
| 48. | 52739 | 23.3% | 10.0%(+13.3)#48 | 11.3%(+11.9)#3,784 |
| 49. | 52321 | 23.3% | 10.0%(+13.3)#49 | 11.3%(+11.9)#3,796 |
| 50. | 50316 | 22.8% | 10.0%(+12.9)#50 | 11.3%(+11.5)#3,946 |
| 51. | 51105 | 22.7% | 10.0%(+12.8)#51 | 11.3%(+11.4)#3,980 |
| 52. | 50140 | 22.7% | 10.0%(+12.7)#52 | 11.3%(+11.3)#4,001 |
| 53. | 52594 | 22.5% | 10.0%(+12.5)#53 | 11.3%(+11.2)#4,080 |
| 54. | 52802 | 22.4% | 10.0%(+12.4)#54 | 11.3%(+11.0)#4,123 |
| 55. | 52590 | 22.3% | 10.0%(+12.4)#55 | 11.3%(+11.0)#4,130 |
| 56. | 50174 | 22.1% | 10.0%(+12.1)#56 | 11.3%(+10.7)#4,240 |
| 57. | 50107 | 21.9% | 10.0%(+11.9)#57 | 11.3%(+10.6)#4,336 |
| 58. | 52347 | 21.7% | 10.0%(+11.7)#58 | 11.3%(+10.4)#4,433 |
| 59. | 52635 | 21.6% | 10.0%(+11.6)#59 | 11.3%(+10.3)#4,471 |
| 60. | 52544 | 21.2% | 10.0%(+11.2)#60 | 11.3%(+9.88)#4,638 |
| 61. | 50050 | 21.2% | 10.0%(+11.2)#61 | 11.3%(+9.85)#4,651 |
| 62. | 50531 | 21.1% | 10.0%(+11.2)#62 | 11.3%(+9.80)#4,674 |
| 63. | 50586 | 21.1% | 10.0%(+11.1)#63 | 11.3%(+9.71)#4,704 |
| 64. | 52312 | 21.1% | 10.0%(+11.1)#64 | 11.3%(+9.71)#4,707 |
| 65. | 50470 | 20.9% | 10.0%(+11.0)#65 | 11.3%(+9.59)#4,753 |
| 66. | 50078 | 20.9% | 10.0%(+11.0)#66 | 11.3%(+9.59)#4,755 |
| 67. | 51543 | 20.9% | 10.0%(+10.9)#67 | 11.3%(+9.51)#4,795 |
| 68. | 50578 | 20.6% | 10.0%(+10.6)#68 | 11.3%(+9.28)#4,899 |
| 69. | 51350 | 20.5% | 10.0%(+10.5)#69 | 11.3%(+9.17)#4,950 |
| 70. | 50146 | 20.3% | 10.0%(+10.4)#70 | 11.3%(+8.99)#5,039 |
| 71. | 50533 | 20.3% | 10.0%(+10.4)#71 | 11.3%(+8.98)#5,044 |
| 72. | 50660 | 20.2% | 10.0%(+10.2)#72 | 11.3%(+8.86)#5,095 |
| 73. | 51545 | 20.0% | 10.0%(+10.0)#73 | 11.3%(+8.66)#5,193 |
| 74. | 51044 | 20.0% | 10.0%(+10.0)#74 | 11.3%(+8.66)#5,199 |
| 75. | 50239 | 20.0% | 10.0%(+10.0)#75 | 11.3%(+8.66)#5,202 |
| 76. | 50108 | 19.9% | 10.0%(+9.93)#76 | 11.3%(+8.57)#5,242 |
| 77. | 52655 | 19.2% | 10.0%(+9.19)#77 | 11.3%(+7.83)#5,657 |
| 78. | 50057 | 19.1% | 10.0%(+9.18)#78 | 11.3%(+7.81)#5,670 |
| 79. | 50268 | 19.0% | 10.0%(+9.04)#79 | 11.3%(+7.67)#5,749 |
| 80. | 50264 | 19.0% | 10.0%(+9.02)#80 | 11.3%(+7.65)#5,758 |
| 81. | 52501 | 18.9% | 10.0%(+8.96)#81 | 11.3%(+7.59)#5,800 |
| 82. | 52066 | 18.8% | 10.0%(+8.78)#82 | 11.3%(+7.41)#5,921 |
| 83. | 52211 | 18.7% | 10.0%(+8.75)#83 | 11.3%(+7.38)#5,935 |
| 84. | 50048 | 18.6% | 10.0%(+8.62)#84 | 11.3%(+7.25)#6,032 |
| 85. | 51103 | 18.6% | 10.0%(+8.61)#85 | 11.3%(+7.24)#6,034 |
| 86. | 52245 | 18.6% | 10.0%(+8.58)#86 | 11.3%(+7.21)#6,054 |
| 87. | 50457 | 18.4% | 10.0%(+8.47)#87 | 11.3%(+7.10)#6,130 |
| 88. | 50703 | 18.4% | 10.0%(+8.42)#88 | 11.3%(+7.05)#6,162 |
| 89. | 50515 | 18.4% | 10.0%(+8.41)#89 | 11.3%(+7.04)#6,171 |
| 90. | 52619 | 18.3% | 10.0%(+8.37)#90 | 11.3%(+7.00)#6,202 |
| 91. | 50049 | 18.2% | 10.0%(+8.25)#91 | 11.3%(+6.88)#6,284 |
| 92. | 52142 | 18.2% | 10.0%(+8.22)#92 | 11.3%(+6.85)#6,302 |
| 93. | 52158 | 18.2% | 10.0%(+8.21)#93 | 11.3%(+6.84)#6,313 |
| 94. | 50311 | 18.2% | 10.0%(+8.20)#94 | 11.3%(+6.83)#6,330 |
| 95. | 52540 | 18.1% | 10.0%(+8.16)#95 | 11.3%(+6.79)#6,352 |
| 96. | 52322 | 18.0% | 10.0%(+8.06)#96 | 11.3%(+6.69)#6,408 |
| 97. | 50262 | 18.0% | 10.0%(+8.00)#97 | 11.3%(+6.64)#6,444 |
| 98. | 51560 | 17.9% | 10.0%(+7.95)#98 | 11.3%(+6.58)#6,488 |
| 99. | 52036 | 17.9% | 10.0%(+7.94)#99 | 11.3%(+6.57)#6,494 |
| 100. | 52071 | 17.8% | 10.0%(+7.84)#100 | 11.3%(+6.47)#6,573 |
Common Questions
What are the Top 10 Zip Codes with the Highest Male Poverty Level in Iowa?
Top 10 Zip Codes with the Highest Male Poverty Level in Iowa are:
What zip code has the Highest Male Poverty Level in Iowa?
50521 has the Highest Male Poverty Level in Iowa with 76.5%.
What is the Poverty Level Among Males in the State of Iowa?
Poverty Level Among Males in Iowa is 10.0%.
What is the Poverty Level Among Males in the United States?
Poverty Level Among Males in the United States is 11.3%.